Tag: Market

All market related articles are found here. Educative, informative and written clearly.

  • Share Turnover Ratio – What Is It and How to Calculate?

    Share Turnover Ratio – What Is It and How to Calculate?

    Share Turnover Ratio - What Is It and How to Calculate?
    The share turnover ratio isn’t the most important measure you have to take into consideration when picking a stock but it is important to know will you need a lot of time to sell off the stock.

    Share turnover ratio shows how difficult or easy, is to buy or sell shares of some stock on the market. Share turnover ratio compares the number of shares traded during some period with the total volume of shares that available for trade during the given period. Investors often avoid the shares of a company with low share turnover. 

    Share turnover is a measure of stock liquidity. When we want to measure it we have to divide the total number of shares traded during the given period by the average number of shares available for sale. For example, if the 1 million shares are traded during the year, and the average volume of shares for sale was 100.000 then we can say that turnover was 10 times. Shares can have higher or lower turnover. The higher share turnover shows that the company has more liquid shares.

    So, we can say that the share turnover compares the number of traded shares to the number of outstanding shares. When we see a high level of share turnover, this means investors can easier and smoother buy and sell the shares.

    They often believe that smaller companies have less share turnover because they are, as investors think, less liquid than big companies. But that might be a great mistake. It isn’t rare that smaller companies have a greater amount of share turnover compared to big companies. 

    How is this possible?

    Very often the reason is the price per share. Big company’s price per share can be several hundreds of dollars and only rich investors are buying them. Yes, large companies have huge floats, thousands of shares might trade daily. But what percentage do they have? The real percentage of their total outstanding shares is small. 

    On the other side, a small company’s share is significantly cheaper and such is traded more frequently. So, they may have a higher daily trading volume.

    Possibilities of share turnover ratio

    The share turnover ratio compares sellers versus buyers of stock. To calculate it we will need two numbers to know. One is the daily trading volume of stock and the other is the number of shares available for sale. This second number is actually a daily float of stock, the total number of outstanding shares. The result is expressed in percentages. And you will see, every time when we get as a result, the high share turnover ratio we can be sure that there is a high daily volume and low float. Also, a low daily volume and the high float will always give us, as a result, a low share turnover ratio. 

    But these figures are so relative. The real share turnover ratio depends on the company and the sector it belongs to. For example, you can see from time to time that some stocks have a high turnover ratio but it can be periodically. When the demand for some stock rises, the turnover ratio will grow at the same time. So, this ratio isn’t able to show how the company is healthy. 

    The limitations of share turnover ratio

    The share turnover ratio can show how easy investors can buy or sell their shares of some stock. Literally, this ratio isn’t able to tell us anything about the company’s performance. Let’s assume you are examining a large company’s stock. You know that the company has, let’s say, 4 billion shares outstanding. It is a really large company. Also, the known fact for you is the averaged trading volume. It is, for example, 40 million per month. So, this company’s share turnover ratio is 1%. What does this number tell us? The stock is illiquid. Would you avoid this stock? Remember, it is a big, well-known company, with great history, with a permanent rise, good management, great prospect. Of course, you wouldn’t. Contrary, everyone would like to buy that stock. That is a case with Apple, for example. Would you avoid investing in that company? The point is that the low share turnover ratio shouldn’t be the most important concern when picking a stock.

    Moreover, when a stock is dropping and only a few want to buy it, that stock will have low turnover. But the same is true if the stock is expensive. If single share costs, for example, $800 only a small number of investors can afford to buy it and the share turnover ratio will be very low.

    So, do you understand why this ratio isn’t reliable when you want to estimate how good stock is? That is the reason why you should use the other parameters too. 

    Is this measure important at all?

    In short, yes. 

    It is an important measure and investors should be aware of it. A low share turnover ratio indicates that you may need a lot of time to sell off such stock and, what is also important, the stock price may decrease while you are waiting to find someone and sell it. Hence, not many investors are willing to put their money as such a risk and buy the share of the company with a low share turnover ratio. But always keep in mind, a low share turnover ratio is normal for a small market-cap company. But we owe you an explanation of what is an average daily trading volume.

    Average daily trading volume

    Average daily trading volume or short ADTV is the average number of shares traded during one day in a particular stock. Daily volume simply means how many shares are traded per day. So, we can average daily volume. It is a crucial measure because high or low trading volume triggers different kinds of traders and investors. Some investors and traders favor high average daily trading volume. It is because with high volume is easier to get into and out of the position. As we already said, when the stock has low volume it is more likely to be harder to enter or exit at the proper price since there are less buyers and sellers. But when the traders and investors start to value the stock differently ADTV can increase or decrease. For example, if the average daily trading volume is higher, that means the stock is less volatile and more investors would like to buy it. But this doesn’t mean that stocks with high volume don’t change in price because they can change a lot.  

    The higher the trading volume is, the more buyers and sellers will easier and faster execute a trade.

    This is a useful tool for analyzing the price action of any liquid stock. For example, the increasing volume may confirm the breakout. If there is any lack of volume, the breakout may fail. But that is the subject for a longer article.

    Bottom line

    Several figures and ratios deliver information about stocks and represent great help to investors when deciding whether they should buy or sell. The stock volume and the share turnover ratio are one of them. They provide valuable information about any stock.

    Share turnover ratio is an important measure for investors but shouldn’t be used as a sole criterion. If investors or traders use this one solely it is more likely they will miss out on very important data, for example about the quality of the stock, and make a wrong investing decision.

    One suggestion before doing anything in real: use our preferred trading platform virtual trading system and check the two formula pattern.

  • What Is Alpha In Investing – How to Beat the Market

    What Is Alpha In Investing – How to Beat the Market

    What Is Alpha In Investing
    Alpha represents a measure of an asset’s return on investment compared to the risk-adjusted expected return.
    Beta represents a measure of volatility. Beta measures how an asset moves versus a benchmark.

    What is Alpha? Alpha is a measure of the performance of an investment in comparison to a fitting market index, for example, the S&P 500. The base value is zero. And when you see the number one in Alpha that means that the return on the investment outperformed the overall market average by 1%. A negative alpha number shows that the return on the investment is underperforming in comparison to the market average. This measure is applicable over a strictly defined time frame.

    What is Alpha more? It is one of the performance ratios that investors use to evaluate both individual stocks and portfolio as a whole. Alpha is shown as a single number, for example, 1, 2, 5 but expressed as a percentage. It shows us how an investment performed related to a benchmark index. For example, a positive alpha of 4 (+4) suggests that the portfolio’s return outperformed the benchmark index’s performance by 4%.  But the alpha of negative 4 (-4) means that the portfolio underperformed the index by 4%. When alpha is zero that means that your investment had a return that met the overall market return.

    What is Alpha of a portfolio?

    It is the excess return the portfolio yields related to the index. When you are investing in some ETF or mutual funds you should look if they have high alpha because you will have better ROI (Return on Investment).

    But you cannot use this ratio solely, you have to use it together with a beta. Beta is a measure of investment volatility. The beta will show you how volatile one investment is compared to the volatility of, for example, the S&P 500 index.

    These two ratios are used to analyze a portfolio of investments and assess their theoretical performance.

    How to calculate?

    First, you have to calculate the expected rate of return of your portfolio. But you have to do that based on the risk-free rate of return, market risk premium, and a beta of the portfolio. The final step is to deduct this result from the actual rate of return of your portfolio.

    Here is the formula

    Expected rate of return = Risk-free rate of return – β x (Market return – Risk-free rate of return)

     and

    Alpha of the portfolio = Actual rate of return of the portfolio – Expected Rate of Return on Portfolio

    The risk-free rate can be discovered from the average annual return of security, over a longer period of time.

    You will find the market return by tracking the average annual return of a benchmark index, for example, S&P500. The market risk premium is calculated by deducting the risk-free rate of return from the market return.

    Market risk premium = Market return – Risk rate of return

    The next step is to find a beta of a portfolio. It is determined by estimating the movement of the portfolio in comparison to the benchmark index. 

    So, now when we have this result, expected rate of return, we can calculate further. We have to find the actual rate of return. It is calculated based on its current value and the prior value.

    And here we are, we have the formula for calculation of alpha of the portfolio. All we have to do is to deduct the expected rate of return of the portfolio from the actual rate of return of the portfolio.

    That was a step by step guide for this calculation.

    Becoming an Alpha investor

    There is a great discussion about should the average investor look for alpha results of a portfolio. But we can hear that investors mention alpha. This is nothing more than the amount by which they have beaten or underperformed the benchmark index. It can be the S&P 500 index if you are investing in the US stock market. In such a case, that would be your benchmark.

    For example, if the benchmark index is up 4% over the period, and your portfolio is up 6%, your alpha is +2. But if your portfolio is up 2%, your alpha is -2.

    Of course, everyone would like to beat the benchmark index all the time. 

    What is the Alpha investing strategy?

    We know that Alpha is a measure of returns after the risk is estimated. Risk is determined as beta, a measure of how volatile one investment is related to the volatility of the benchmark index.

    Alpha strategies cover equity funds with stock selection. Also, hedge fund strategies are a popular addition in alpha portfolios.

    Something called “pure alpha” covers hedge funds and risk premia strategies. The point is that by adding an alpha strategy to your overall portfolio you can boost returns of the other investment strategies that are not in correlation.

    Alpha is the active return on investment, measures the performance of an investment against a market index. The investment alpha is the excess return of investment relative to the return of an index.

    You can generate alpha if you diversify your portfolio in a way to eliminate disorganized risks. By adding and subtracting you are managing the risk and the risk becomes organized not spontaneously. When alpha is zero that means the portfolio is in line with an index. That indicates that you didn’t add or lose any value in your portfolio.

    When an investor wants to pick a potential investment, she or he considers beta. But also the fund manager’s capacity to generate alpha. For example, a fund has a beta of 1 which means it is volatile as much as the S&P index. To generate alpha, a fund manager has to generate a return greater than the S&P 500 index.

    For example, a fund returns 12% per year. That fund has a beta of 1. If we know that the S&P 500 index returns 10%, it is said the fund manager generated alpha returns.

    If we consider the risks, we’ll see the fund and the S&P index have the same risk. So, the fund manager generated better returns, so such managers generated alpha. 

    Alpha in use

    You can use alpha to outperform the market by taking more risks but after the risk is considered. Well, you know that risk and reward are in tight relation. If you take more risks, the potential reward will go up. Hence, limited risks, limited rewards.

    For example, hedge funds use the concept of alpha. They use beta too, but we will write later about the beta. The nature of hedge funds is to seek to generate returns despite what the market does. Some hedge funds can be hedged completely by investing 50% in long positions and 50% in short positions. The managers will increase the value of long positions and decrease the value of their short positions to generate positive returns. But such a manager should be a ninja to provide gains not from high risk but from smart investment selection. If you find a manager that can give you at least a 4% annual return without a correlation to the market, you can even borrow the money and invest. But it is so rare.

    Alpha Described

    What is alpha more? It is often called the Jensen index. It is related to the capital asset pricing model which is used to estimate the required return of an investment. Also, it is used to estimate realized achievement for a diversified portfolio. Alpha serves to discover how much the achieved return of the portfolio differs from the required return.

    Alpha will show you how good the performance of your investment is in comparison to return that has to be earned for the risk you took. To put this simply, was your performance adequate to the risk you took to get a return.

    A positive alpha means that you performed better than was expected based on the risk. A negative alpha indicates that you performed worse than the required return of the portfolio. 

    The Jensen index allows comparing your performances as a portfolio manager or relative to the market itself. When using alpha, it’s important to compare funds inside the same asset class. Comparing funds from one asset class, otherwise, it is meaningless. How can you compare frogs and apples?

    What is beta?

    When stock fluctuates more than the market has a beta greater than 1.0. If stock runs less than the market, the beta is less than 1.0. High-beta stocks are riskier but give higher potential returns. Vice versa, stocks with lower beta carries less risk but yield lower returns.

    Beta is usually used as a risk-reward measure. It helps you determine how much risk you are willing to take to reach the return for taking on that risk. 

    To calculate the beta of security, you have to know the covariance between the return of the security and the return of the market. Also, you will need to know the variance of the market returns. The formula to calculate beta is

    Beta = Covariance/Variance

    ​Covariance shows how two stocks move together. If it is positive that means the stocks are moving together in both cases, when their prices go up or down. But if it is negative, that means the stocks move opposite to each other. You would use it to measure the similarity in price moves of two different stocks.

    Variance indicates how far a stock moves relative to its average. You would use variance to measure the volatility of stock’s price over time.  

    The formula for calculating beta is as shown above.

    Beta is very useful and simple to describe quantitative measure since it uses regression analysis to gauge the volatility. There are many ways in which beta can be read. For example, the stock has a beta of 1.8 which means that for every 1% correction in the market return there will be a 1.8% shift in return of that stock. But we also can say that this stock is 80% riskier than the market as a whole. 

    Limitations of Alpha

    Alpha has limitations that investors should count when using it. One is related to different types of funds. If you try to use this ratio to analyze portfolios that invest in different asset classes, it can produce incorrect results. The different essence of the various funds will change the results of the measure. Alpha is the most suitable if you use it strictly for stock market investments. Also,  you can use it as a fund matching tool or evaluating comparable funds. For example, two large-cap growth funds. You cannot compare a mid-cap value fund with a large-cap growth fund.

    The other important point is to choose a benchmark index. 

    Since the alpha is calculated and compared to a benchmark that is thought suitable for the portfolio, you should choose a proper benchmark. The most used is the S&P 500 stock index. But, you might need some other if you have an investment portfolio of sector funds, for example. if you want to evaluate a portfolio of stocks invested in the tech sector, a more relevant index benchmark would be the Dow technology index. But what if there is no relevant benchmark index? Well, if you are an analyst you have to use algorithms to mimic an index for this purpose.

    Limitations of beta

    The beta is good only for frequently traded stocks. Beta shows the volatility of an asset compared to the market. But it doesn’t have to be a rule.  Some assets can be risky in nature without correlation with market returns. You see, beta can be zero. You should be cautious when using a beta.

    Also, beta cannot give you a full view of the company’s risk outlook. For short-term volatility it is helpful but when it comes to estimating long-term volatility it isn’t.

    Bottom line

    What is alpha? It began with the intro of weighted index funds. Primarily, investors started to demand portfolio managers to produce returns that beat returns by investing in a passive index fund. Alpha is designed as a metric to compare active investments with index investing. 

    What is the difference between alpha and beta?

    You can use both ratios to compare and predict returns. Alpha and beta both use benchmark indexes to compare toward distinct securities or portfolios.

    Alpha is risk-adjusted. It is a measure that shows how funds perform compared to the overall market average return. The loss or profit produced relative to the benchmark describes the alpha. 

    On the other hand, beta measures the relative volatility of assets compared to the average volatility of the entire market. Volatility is an important part of the risk. The baseline figure for beta is 1. A security with a beta of 1 means that it performs almost the same level of volatility as the related index. If the beta is under 1, the stock price is less volatile than the market average. And vice versa, if the beta is over 1, the stock price is more volatile. There is some tricky part with beta value. If it is negative, it doesn’t necessarily mean less volatility. 

    A negative beta means that the stock tends to move inversely to the direction of the overall market.

  • Spread Betting With Examples

    Spread Betting With Examples

    3 min read

    Spread Betting With Examples

    Let’s be frank.

    Spread betting is extremely risky. It’s highly dangerous. It’s not for beginners and people with lack of knowledge. 

    But to be totally honest, it is one of the simplest ways for an individual investor to support their ideas with hard cash. If you treat the market proper, you can get big gains, very fast.

    What is spread betting and how it works?

    Spread betting simply lets you guessing will the price of some stock climb or drop. You can speculate from stocks to house values.

    Moreover, you don’t need to purchase the stock you want to trade. You just take a look at the prices submitted by the spread betting provider and speculate if the price will increase or decrease.

    Spread betting brokerages give you a quote. The quote contains a bid price and an offer price which is a bit higher. Let’s see how it works on this example.

    Your brokerage quoted some stock price at $5,000 and a spread betting provider will give you a bid price of $4,990, for example, and an offer price of, let’s say $5,010.

    If you think the price will increase you can “buy” for $10 per point at $5,010. Every time the point is rising up you will earn $10. Say the price increased to $5,030. It is reasonable to close up the bet. 

    It is time to calculate your profit

    5030 – 5010 = 20

    20 x 10 = 200

    So, your profit is $200.

    This is in case you believe the market will grow, but if you think the market will drop, you can sell your stock at $4,990.

    But you have to know that the risk is involved here. You can indeed make a lot of money with betting on small amounts but you may lose a lot too.

    Let’s assume that you sell your stock for $10 per point at $4,990.

    How big your loss will be if the price increase to a spread at 4,990/5,020?

    Let’s calculate this.

    4990 – 5030 = 40

    20 x $10 = $400

    Your loss is $400.

    You see, you can make huge losses if your trade goes in the wrong direction. And this isn’t the only loss you may gain. Spread betting brokers will demand you to pay margin. Usually, it is about 10% but can be less or more. 

    The dangerous situation can arise if your losses on the trade approach near to the margin. In such a case, the broker may require more money from you and activate a margin call. What will happen if you can not come with that? The spread betting provider may close and will do, your position at a current price.

    You don’t want a margin call to control your losses or you’ll be broke. Instead, set stop-loss order to close your trade at a particular price.

    Let’s use our example again.

    For example, you sold stock at $4,990 but you placed a stop loss at an offer price of $5,010, how big your loss would be?

    4990 – 5010 = -20 

    -20 x $10 = loss $200

    Your loss would be $200 which is pretty much less than $400. 

    But there is a problem with markets moving. What if it is too fast? It is gapping. A normal stop-loss order will not prevent your trade since a lot of stop-loss orders are triggered together. That will cause the trades to be closed at the market price closest to the defined price and it usually isn’t the level you wanted or expected.

    The better choice is to set a guaranteed stop. This will cost you more since your broker will ask more money to get you out at a settled price. In this case, it isn’t in the question how many other stop-loss orders are activated beside yours. Actually, your broker will buy you out of the trade. This is very important when the market is highly volatile and you would like to pay a bit more to stay in a safe zone.

    But there must be advantages also

    One end is the tax break. In many countries (we are sure for the UK), you will not pay taxes on profits gained in spread betting or on capital gains from it. The other reason is that you don’t need to pay a fee to your broker when spread betting. Your broker will earn money from the difference between the bid and offer price.

    But spread betting isn’t all about money. It is all about the opportunity to speculate on a full spectrum of markets. Even if you don’t have regular access to them. As it is said in the beginning, you can bet on almost everything. Currency pairs, stocks, commodities, whatever.

  • Investing With Just $100 Per Month

    Investing With Just $100 Per Month

    How to start Investing with just $100 per month
    You don’t believe it’s possible? Well, you should read this post.

    By Guy Avtalyon

    Ok, you have an extra $100 each month and you are enthusiastic about investing but you don’t how it works? Also, you are worried if $100 is enough? Investing with just $100 per month is possible, of course. 

    You don’t need thousands of dollars or euros or whatever to become an investor and get into investment. Traders-Paradise found several possibilities for investing with just $100 per month. 

    Reasonably, you will not make a ton of profit off a $100 investment, but the crucial thing is really getting started. $100 may not appear important, but you can make it expand into more.

    This is where it gets a bit more difficult.

    One of the hugest problems with investing a small sum is that brokerage fees can be expensive. For example, if you want to buy some stock that can cost you up to $20 with some brokerage and your investment easilly may become $80 worth. Yes, there is a simpler way and cheaper brokerage. 

    There is one way that will cost you less. Just use some investment app. Most of them will charge you a $1 per month fee. The great thing about investment apps is that you can easily pick the simple portfolios related to your goals, interests, and ideas about investing. 

    The app will do the rest.

    Honestly,  when it comes to investing, time is more significant than the sum. Let’s say you are in your 18s. With an interest rate of 7%, you could end with almost $50,000 after 20 years by investing with just $100 per month.

    It’s never too start investing, but why should you waste your time and miss the opportunity to get the wealth.

    Savings account

    The best place for you to start with $100 per month is to set it in a savings account. That will be more an emergency fund than investing with current interest rates. But it will provide you to get into more serious investments because you will build a safety net. You will not capture great returns but you will be safe even if you lose your current job. At least by putting $100 every month on your savings account you will have several months of breath if such an incident appears. 

    Hold it as the source to something bigger. Wise investing can turn your $100 into a great future and you have to begin around.

    The time frame will make an immense variance in how you should invest. So, suppose you want to invest in stocks.

    Stock investing with just $100 per month


     If you have $100 that you’re able to load every month, you should think to invest in individual stocks. I already mentioned that will cost you 20% of your investment and you may think it is too expensive. But think again. The misconception is that you need a lot of money to be able to invest in a stock. Investing with just $100 per month is quite good for the start.

    Let’s debunk the theories.

    For beginners, if you’re ready to do your homework and buy around amid brokers, you will find a great potential. For instance, you can find a broker with bare-bones $5 commission and without minimum deposit terms. What you have to think about is that low-cost brokers may charge you some additional costs, for example, inactivity fees or additional costs connected with buying stocks trading below $2 per share. 

    But, if you buy individual stocks you are entering the long run. Yes, it is possible to find a good stock for investing with just $100 if you have a long investment horizon. You will hold your stock for years. If you trade them you will pay 10% commission for every buying or selling, that’s true. If you don’t like to pay commissions every month you can make savings of $300 or $400 and buy stocks every 3 or 4 months, you don’t need to buy stocks every month. In this way, you can lessen your cumulative commission charges.

    Certificates Of Deposit or CD

    Of course, there is an alternative to investing in stocks. You can invest in CDs. This simple way. All you have to do is to loan your money to the bank and collect the interest on it. CDs range in time from 3 months to 10 years. The point is, the longer you invest, the higher interest you will catch.

    Moreover, the CD is penalty-free. That gives you the possibility to withdraw your money if you want and without penalty. But read everything you have to sign, some CDs have penalties. Some banks can charge you if you withdraw your money before the maturity of the contract. 

    Another solution for your investing with just $100 per month is peer-to-peer (P2P) loans.

    The cool thing with this type of investment is that you can decide not only how much you want to invest but also, how your investment will be used. You may choose one particular investment from the different loans, also, you can determine an interest rate and loan period. As an investor, you will get your money back according to repayment plans.

    Index funds are a good choice for investing with just $100 per month

    Some companies don’t have a minimum balance requirement for index funds. So you can invest $100 in a class of stocks. The primary index fund tracks the S&P 500, but you can find numerous other. Index funds are good because they give the diversification of your investment portfolio. Some stocks will rise in value, some will drop, but the final result is that you will profit.

    What do you want wit that $100? Do you want to improve your current financial situation, or maybe you want your capital to grow? You have to figure out that.

    If your finances are in good health, then there is no excuse to delay investing.

    Start building your wealth. Don’t worry if you have just $100. It is enough to start, it will turn into more! But if you don’t begin investing, you will never have that chance to earn. The day when you will think how smart you were when invested $100 is so close. So, simply start investing with just $100 per month.

  • Tesla’s Claims Fall Short – Again

    Tesla’s Claims Fall Short – Again

    2 min read

    Tesla drops lawsuit against critic

    When ordered to produce evidence of alleged danger presented by a short-seller, Tesla withdraws its request for a court-ordered restraining order. Tesla’s claims fall short once again.

    Earlier this year Tesla has filed a request for a restraining order against a member of short-seller community TSLAQ known as “skabooshka”, real name Randeep Hothi, to the Alameda County Superior Court in Alameda County, California. In filing Tesla has claimed that Mr. Hothi has injured a security guard at Giga Factory in a hit-and-run incident, and also nearly caused a traffic accident while pursuing a test model of Model 3 during a test run on April 16. Upon being granted a temporary injunction by the court, Tesla was requested to provide audio and video recordings of those two incidents as evidence.

    Surprising turn-over

    But, in a surprise move the car producer has withdrawn request for the restraining order on July 19.

    In the letter to the court, Tesla’s lawyers have expressed the opinion that the request of the audio and video recordings of the incidents are an undue imposition on the privacy of their employees, stating that such materials contain personal and private conversations. They have expressed a belief that “restraining order against Mr. Hothi is necessary and appropriate to protect its employees at their workplace.” Further claiming that the company was forced to choose between employees’ safety and exposing their personal conversation to the public. Thus, the document states, the company has decided to pursue the safety of its employees “by other means”.

    And what those other means could be should make people worried, as the history of Tesla’s retaliation against its critics illustrates.

    Tesla’s claims fall short

    Shortly after the Reveal from The Center for Investigative Reporting has published a piece alleging that Tesla is under-reporting the work-related injuries, one of the CIR’s insiders have alleged retaliation. Said doctor alleged that a complaint to the relevant Medical Board was lodged against her, while also an anonymous call was placed to state’s Child Protection Service accusing her of negligence to her children and requesting that her kids be placed under the protective care of the state.

    But such false accusations look to be the modus operandi of Tesla when handling the critique.

    Tesla model 3

    Last year Ars Technica has published a story about the alleged attempt of a mass shooting at Giga Factory by a whistleblower Martin Tripp. At that time the Tesla representative has told Ars that they have received an anonymous call at Giga Factory by a male caller claiming that Mr. Tripp is “extremely volatile” and “heavily armed”. But according to the information provided to Mr. Tripp’s attorney and then to Ars the alleged call was made to Tesla’s call center in Las Vegas and then forwarded to Giga Factory’s head of security, Sean Gourthro. Gourthro then has texted to Story County Chief Deputy Tony Dosen that an anonymous female caller has alerted them that Mr. Tripp is en route to “shoot up Tesla”, per Story County Sheriff’s Office report. According to an in-depth investigation by Bloomberg, when police officers have tracked down Mr. Tripp they have discovered that he presents no danger for Tesla’s employees. 

    “He said he was terrified of Musk and suggested the billionaire might have called in the tip himself. A sheriff’s deputy attempted to cheer up Tripp and then called Tesla to tell the company that the threat, whoever had made it, was bogus.”

    Bottom line

    Since we wrote so many times that any news may have an influence on the stock price of some company, it will be interesting to make a comparison in stock price before and after incidents like this one. Do investors take care of how companies treat their employees? Is the company’s public outlook important for them? We will see. Today Tesla’s stock looks like this:

    Tesla stock target price: $890.00

    Current price: $255.68

    Stay tuned and follow the market

  • Stocks To Buy To The End Of The Year

    Stocks To Buy To The End Of The Year

    4 min read

    Stocks To Buy To The End Of The Year

    Would like to know where to invest in the second half of this year? What stocks to buy to the end of 2019? Yes, we know that the market circumstances are not so good. Uncertainty comes from trading war, this bull market has lasted almost eleven years and the matter of moment when the disturbing calculation will arise.

    What we, in Traders-Paradise, want is to offer you a closer insight into some stocks to buy to the end of this year.

    We have several suggestions about the stocks to buy to the end of 2019. We picked some that are paying a dividend, some utilities, but you will see. The main criteria were to find low-rates because these stocks are able to produce profits when rates climb.

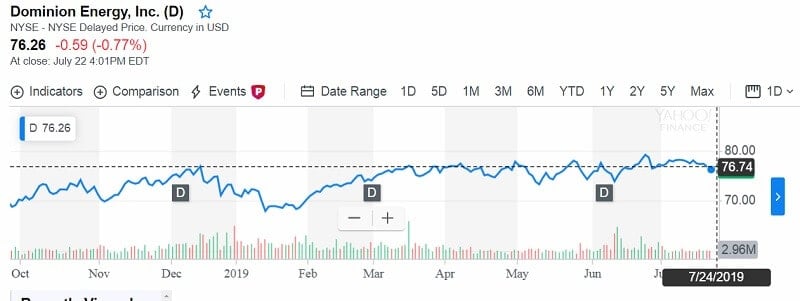
    Dominion Energy (D)

    Yield: 4.7% 

    Revenues: $13.8 billion

    Market Cap: $62.1 billion 

    12-Month Range: $67.41-$79.47

    Why this company from Virginia, US? They have about 7,5 million clients, users of its electricity and natural gas. This company is one of the major producers and suppliers of energy in the US. 

    It has approximately $100 billion of assets.

    Its stock grows at approx 6% from the beginning of this year. Last year Dominion had cash dividend growth of 10% and it is up 10% this year. Domino reported first-quarter net operating income of $873 million which is less for 17,8% in comparison with last year. But, as we said billion times, everything may influence the revenue or stock price, in one word the market. This time it was unusually warm and sunny weather. That decreased this utility’s earnings by approximately $0.06 per share. But its stock is qualified at the 15%-20% rate. Don’t pay more than $85 for them.

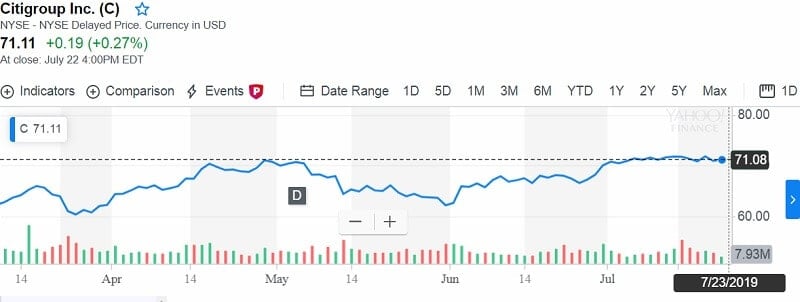
    Citigroup (C)

    Stocks To Buy To The End Of The Year

    Yield: 2.8% 

    Revenues : $72.6 billion

    Market Cap: $161.2 billion 

    12-Month Range: $48.42-$75.24

    Some investors believe that this is the best time for the main banks. Citigroup is one of them but it is the sole bank that continues 30%  under its pre-financial crisis top market value. Its stock is much lower than the other three of the four main banks. The global big four are JPMorgan Chase, Bank of America, Wells Fargo, and Citigroup.

    Citigroup improved and develop good relations with its clients, increase client support by digital developing, and has enough capital to invest in the franchise.  It is very possible the share buybacks can double Earnings Per Share which is a guarantee that share price can be doubled too. That sounds good. Buy up to $75.

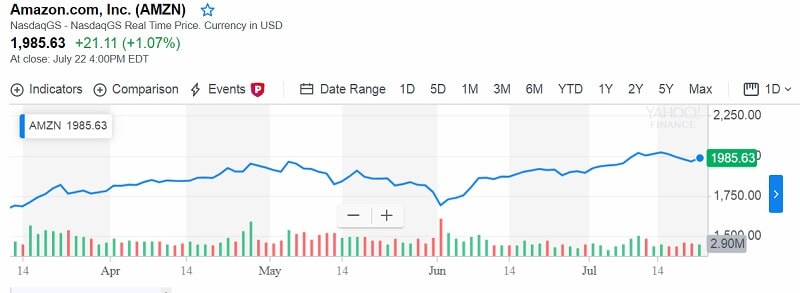
    Amazon (AMZN)

    Yield: 1,21% 

    Revenues : $59.7 billion 

    Market Cap: $977,589 billion 

    12-Month Range: $1812,97-$1985.63

    Amazon reported earnings for the first fiscal quarter of this year: the revenue $59.7 billion, net income $3.6 billion, and earnings per share  $7.09. Its international sales increased 9% to $16.2 billion. That was much over analysts expectations. Amazon revealed second-quarter revenue direction in the range of $59.5 billion and $63.5 billion. Its current price is $1985.63 in July this year.

    Amazon Web Services is growing 41% in sales to $7.7 billion. It is about 13% of its total revenue. There is a possibility to raise more. Pay up to $1990,00, after that price it will raise more, above $2,000,00, so you could make a good return.

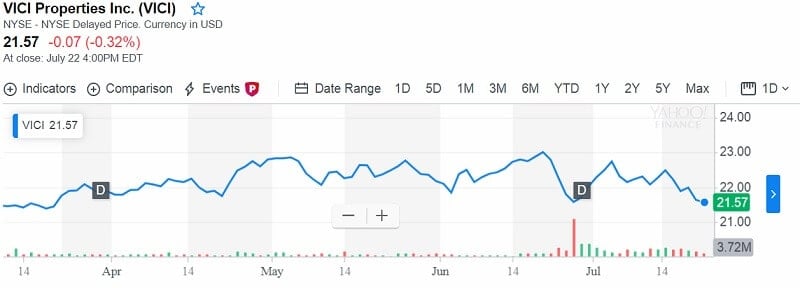
    Vici Properties (VICI)

    Stocks To Buy To The End Of The Year

    Yield: 5.2% Revenues: $893.7 million

    Market Cap: $10.0 billion

    12-Month Range: $17.64-$23.27

    Vici Properties is a spinoff from Caesars Entertainment Operating Co. Vici controls 22 gaming businesses over the U.S. Also, Vici holds almost 15,000 hotel rooms in Las Vegas, Lake Tahoe, and Atlantic City and 4 golf fields. There is also some land but undeveloped for now. The last ownership is great potential.

    Leasing revenue for the first quarter of this year, was $206.7 million, a 6.4% increment related to first-quarter 2018. Net income increased 34% to $150.8 million. Last year it was $112.1 million.

    Its adjusted funds from operations increased 21.6% to $151.5 million from 2018. Current price is $21.60. The yield is well-covered and Traders-Paradise expects future dividend hikes. Buy up to $22,00. The predictions are that the price could easily hit $ 23.804 to the end of the year.

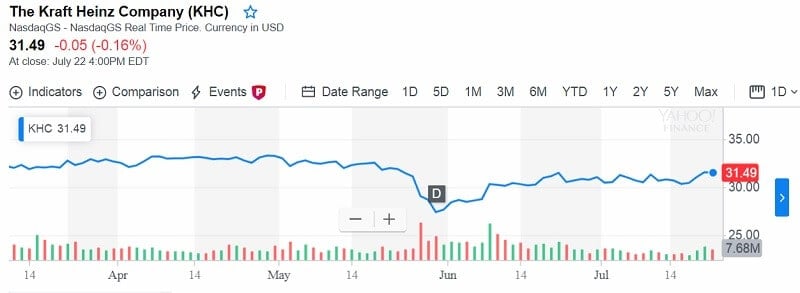
    Kraft Heinz Company (KHC)

    Yield: 5.2% 

    Revenues: $26.3 billion

    Market Cap: $38.5 billion 

    12-Month Range: $26.96-$64.99

    Kraft Heinz is one of the largest packaged food companies in the world.

    The cheese (Kraft) and ketchup (Heinz), bring this company to the portfolio of over 200 brands internationally sale. Revenues remain stable (if not growing), backed by still-popular brands and products. Its profit margins generate important cash flow. It had some problems in the US market, but foreign effects were better.

    The $0.40 per share quarterly dividend is covered and provides a 5,2% yield. In order to stimulate its debt paydown, Kraft Heinz Company could cut the yield.

    KHC’s stock price could provide significant gains. Current price is $31,63. The target price is $45. Buy up to $42.

    Bottom line

    The trade wars, real wars, elementary catastrophes, all around the globe.

    So, it isn’t so hard to recognize possible risks that could turn over the bullish trend. It is possible for the long-interest rates to go higher even they went down from the beginning of this year.  

    What you have to follow in order to choose stocks to buy to the end of this year?

    The indicator of industrial production.

    It is usually presented as an index in volume terms. The annual difference is shown in percentage and reveals the change in the volume of industrial output in comparison with the prior year.

    Why is this matter?

    Annual variation in industrial production presents the status of the economy in one country. If you notice the decreasing in production of consumer durables and capital goods you can be sure that the economic downturn is here.

    The indicator of industrial production is a principal symbol of GDP growth. It is incredibly sensitive to consumer demand and interest rates.

  • Passive Investing is a Good Choice

    Passive Investing is a Good Choice


    Why Passive Investing is a Good Choice?
    Passive investing is the way to force your money to work for you.

    By Guy Avtalyon

    Passive investing has become a significant part of the market. Finally! The low-cost index funds or exchange-traded funds are popular. However, there are still a lot of investors who are trying to achieve an excellent return through active investing. The question is why they are doing that when passive investing provides a better alternative.

    What is passive investing?

    It is investing your assets in funds that mimic a market. The main task of fund managers is to purchase the security in the precise proportion of a particular index to copy it. It is a passive investment. Sometimes you will hear the term  “indexed investing.” It is the same.

    Let’s consider a bit more the act of active and passive investing strategies. Three years ago, the S&P500 had a total return of 9.54%. What did every passive investor make? Precisely 9.54%.  On the other hand, an active investor gained 12,5%, but the other made just a 1,9%, or some made losses of -27%.

    How is that possible?

    The passive portion returned 9.54% and the total market returned 9.54%.  But returns before the cost is not what should be counted. You should count what you actually earn. And what is that? The returns after cost and after-tax.

    So, where is the catch?

    Passive management is cheaper than active. Active management is more costly. If you know that the cost of managing an index fund is between 0,15% and 0,50% rely on the market replicates, you will find that an active investing will have a minimum of 1% higher costs than passive investing.

    That 1% is 100 basis points and may not sound a lot.

    But let’s consider the following situation.

    Let’s say you put your money in the bank account instead of buying stocks because you don’t want to pay that 1% of costs. You are short immediately 5-6%. Your wealth is worthless. Actually, if you invest that amount in stocks there is a chance to gain more. With putting money in the bank account you will lose 15-16% of your net profit from potential investments in the stock market. In only one year. Over time this difference could considerably decrease your wealth. It will surely lower your standard when retirement. 

    The costs of active investing are not only fees. The activity by nature adds more costs. The active trades create capital gains more often than passive investing. So, why wouldn’t you avoid them entirely? It is simple math. If you want active investing you would pay more. Just take into account the taxes and costs. 

    So, we have to say, index funds and passive investing can be a better option than actively managed funds. 

    Passive investing in index funds has changed the investment world.

    In 1975, Jack Bogle, the father of passive investing, introduced the index fund. His radical idea showed the financial sector regularly cheated the individual investor with the unknown and opposed fees.

    This doesn’t mean that everyone should be indexed. Of course not. Active managers’ choices hold prices closer to values. That allows indexing to operate. Index investing means to leverage their trade without paying the costs. The majority of investors decide to index part of their money, some do it with all of them. But the others want to explore the less-priced securities.

    Let’s consult the statistic, in 2017, the percentage of securities owned by passive fund portfolios was about 5% of the total in the global market. The biggest part it took in the US where it was 15 %.

    When it comes to investing, you can choose between active and passive investing.

    Picking the right is crucial to your investing profit. If you make a mistake, you can end up with money loss. With the right one, you are the winner and you can make a big success in the stock market.

    How to find the right passive investing opportunity?

    Passive management requires buying investments that track an underlying index or making asset allocation and holding to it for the long term.

    One form of passive investing is the mutual fund investment because the mutual fund’s purpose is to return what the S&P 500 returns every year. The advantages of passive investing are numerous.

    Passive funds don’t require you to make trades and adjust holdings daily. The management fees are much cheaper, which is a benefit in the long run. You will always get the same percentage as the market returns. Good or bad, but the same.

    Passive investing is easy. You just have to pick some investments and that’s all. There is no need to monitor the market every second and make changes or to try to catch price swings. But passive investing is not for investors who want to beat the market. Yes, you can do it from time to time, but all the time. So, probably, if you are not a professional you will make big losses.

    Passive investing is more than set up your portfolio and don’t touch it anymore. You have to monitor your portfolio and make corrections as the market moves. You have to rebalance.

    Say the stocks increase in price, bonds are falling. If you have a 60% stock and 40% bond in your portfolio, this price movement requires an adjustment to 70% stock and30% bond in the portfolio. In case you never make these changes in your portfolio you will take on too much or too little risk. You will not achieve your targets. So, some monitoring has to be done. In the first place, you have to think about your money. The money is not just a piece of paper. Having money means that you are free and safe.

    You have to force your money to work for you. Passive investing is for sure a good way.


  • Christine Lagarde as an EBC head: Good or bad for cryptocurrencies future?

    Christine Lagarde as an EBC head: Good or bad for cryptocurrencies future?

    2 min read

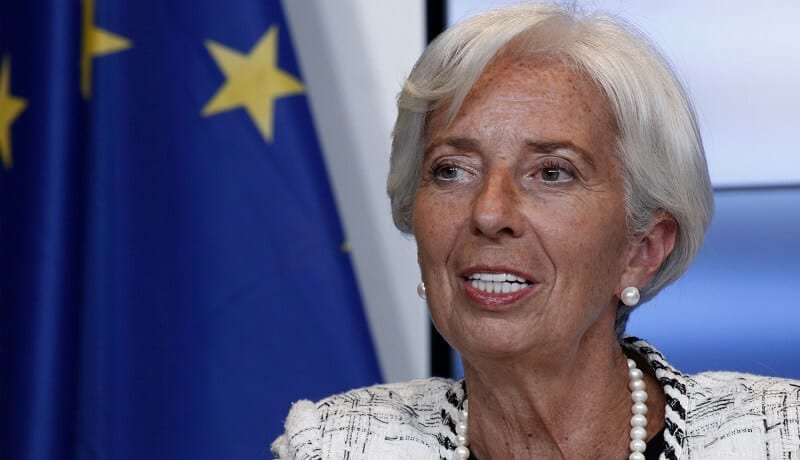
    Christine Lagarde

    Christine Lagarde, a new ECB head is remarkably pro-crypto. 

    Investors and advocates of Bitcoin and the crypto markets have long held that the zenith of adoption the crypto would come when authorities and central banks started becoming friendly towards the new technologies.

    The new head of the European Central Bank (ECB)  Christine Lagarde is pro-crypto. Can it be good or bad for cryptocurrencies?

    Previously, she has shown a huge interest in crypto and how the new tech can help develop tomorrow’s overall economy.

    Will this help to promote acceptance of cryptocurrencies?

    Christine Lagarde has promoted for state-backed digital currencies.

    She said it could improve the capability of such state’s economy.

    “I believe we should consider the possibility to issue digital currency. There may be a role for the state to supply money to the digital economy,” she told at the Singapore Fintech Festival Nov. 14.

    If done correctly, central bank-issued digital currencies could “could satisfy public policy goals,” she noticed, specifically “financial inclusion,” “security and consumer protection,” and “privacy in payments.”

    During the speech in Singapore, Lagarde meantime persisted on the “downsides” of CBDCs, too

    “I would also like to highlight the risks of stifling innovation — the last thing you want. My main point will be that we should face these risks creatively.”

    We must be honest, the new ECB boss is more open to centralized crypto selections than to decentralized ones, like Bitcoin. She has supported already for state-backed cryptocurrencies and tokens like XRP and JPM coin. Maybe, she just needs more encouragement. We will see. It isn’t possible for any traditional bank to support the crypto, but to embrace its existence and allow using in transactions would be very useful, both for the bankers and crypto-owners.

    Lagarde supports

    Last year, in February, Lagarde in an interview for CNNMoney said that “the trend showed a “herd mentality” of those looking for high yield products as well as an element of speculation.”

    Lagarde continued that this trend was also fired by “dark activity.” That was explained by the potential for cryptocurrencies to be “used for money laundering and other illegal online activities due to their anonymous nature.”

    We can’t argue with this opinion because it is true. But, also, the regulation would be helpful. The difficult part, someone can think, is how to provide for crypto to remain anonymous and regulated. Well, it isn’t too hard. The hard part is how to avoid dark activity. Fiat showed less capability.

    Lagarde has said that Bitcoin and other cryptocurrencies could develop financial markets. She especially pointed to the speed and security of transactions. 

    We are sure that Lagarde’s main interest will not be the adoption of cryptocurrencies. She will have some bigger difficulties in the EU monetary system and economy. But, also, we have to notice that Lagarde is opened toward new technologies such as blockchain and it is very good. It can be promising for the crypto in the future. Christine Lagarde on the head of the ECB can have a very positive influence on the crypto industry and market in whole. 

    For now, for those of us who truly believe that the future for cryptos is coming, it is good news that Christine Lagarde’s opinions about Bitcoin are positive. 

  • Huawei is banned from the US market

    Huawei is banned from the US market

    3 min read

    Huawei is banned from the US market

    Huawei is banned. Last week the global markets dropped as trade pressures promptly increased between the U.S. and China.

    There is an expectation that the trade communications between the US and China will be settled positively. But putting on the blacklist Huawei by the US could indicate even extra market volatility advance.

    Wall Street shares have closed lower.

    The Dow Jones Industrial Average fell 0.33% to 25,679.76, the S&P 500 lost 0.68% to 2,840.09 and the Nasdaq Composite dropped 1.46% to 7,702.38.

    Thanks to Huawei ban, the tech stocks dropping, beginning another week of losses.

    Broadcom and Qualcomm, which gets at least half their income from China, stocks dropped Monday. They are big Huawei’s suppliers.

    The same was with  Micron Technology and Xilinx.

    The U.S. choice to ban technology sales to Huawei caused the tech companies stock losses. Investors are disturbed the move against Huawei could decrease selling for companies, particularly chipmakers. Their income is extremely attached to China.

    Amazon, Nike, and Starbucks are hit too. Their stocks dropped yesterday.

    But T-Mobile and Sprint are between the few businesses to make profits. Those two companies are expecting the merger worth $26,5 billion.

    The investors moved to less-risky holdings.

    For example, utilities and energy are the sectors where you can see gains.

    It is so natural because the investors typically in circumstances like this, want to invest their money into the safer field.

    Chipmakers have sunk because of U.S. ban on technology sales to Huawei.

    The U.S. government states that Chinese suppliers, meaning Huawei and its rival, ZTE Corp., are an espionage peril.

    The reason behind is they are indebted to China’s ruling Communist Party.

    And Google bans Huawei phones, strengthening U.S. consumers’ dependence on Apple and Samsung.

    But what will happen with users?

    Google confirmed that it had canceled Huawei’s Android license, as Reuters reported. Huawei devices 002502, +2.20%  will only be able to use an open-source version of the Android platform.

    Access to Google services such as Gmail and YouTube and Google Play app store for third-party apps are restricting.

    Google did this to comply with a Trump administration policy.

    Trump’s administration policy requires federal-government approval for all purchases made by Huawei.
    Also for affiliated businesses of U.S.-made microchips, software, and other parts.

    Government officials became suspicious of Huawei. They worry that the Chinese government could use the phones to spy on US citizens.

    “For users of our services, Google Play and the security protections from Google Play Protect will continue to function on existing Huawei devices,” said a Google spokesperson.

    But the U.S.users could stay with fewer smartphone options.

    Apple and Samsung rule the smartphone market in the U.S. The two companies control approximately 80% of the mobile market, according to data from GlobalStats.

    Huawei tried to break the U.S. market. According to GlobalStats, the company’s market share in the US is less than 1%. And Huawei had retreated from the U.S. market in expectation of a confrontation with the US government.

    For example, Huawei doesn’t sell its leading Mate 20 models directly in the U.S., but the phones are accessible from third-party retailers.

    Market will recover

    Despite the new blast of market volatility,  Edward Yardeni marks a return to all-time highs this year.

    He believes U.S. multinational companies, which are endangered to the trade war, will eventually provide the market increase.

    “I think it moves higher partly because there’s a recognition that even companies that do business with China are going to find ways to deal with this escalating trade tension like moving some of their supply chains to other countries,” said the Yardeni Research president Friday for CNBC.

    The last UPDATE Huawei is Riding Again in the US market

    Risk Disclosure

  • Stock Market Corrections – All You Need to Know

    Stock Market Corrections – All You Need to Know

    Stock Market Corrections - All You Need to Know 2What is a stock market correction and how to deal with it?

    By Guy Avtalyon

    A stock market corrections are regularly interpreted as a drop in stock prices of 10% or higher from their most recent peak. If prices drop by 20% or more, we call it a bear market.

    Prices bounce, excitement hides logic, signals arrive and disappear. The reasons for treating equities as a poor barometer for the economy are many. Right now, that might be for the best. Stock market corrections occur, normal, about every 8 to 12 months, and last about 54 days.

    A 5% to 10% correction is vital for this stock market, warns Jefferies strategist.

    What happens when the market declines, why it does so, and how long a drop may last?

    For example, news that the S&P 500 has fallen more than 3% in one day can cause uncertainty even for the most experienced investor. Such falls can be scary because it’s impossible to predict how difficult or long-lasting losses will be. And even if you believe the market will finally rebound, it’s hard to follow the value of your investments shorten in front of your eyes.

    But, a stock market drop doesn’t mean it’s time to panic.

    Since 1926, there have been 20 stock market corrections during bull markets, meaning 20 times the market declined 10% but did not subsequently fall into the bear market territory.

    You have to know, the stock market’s condition is always rising and falling. Occasionally, the market will experience short-term gains, but after will come drops. And again, and again, the same scenario. The gains in value are usually due to mass psychology because investors are driven by the expectation of recognized gains. When more investors buy into the trend, the price increases. Once the price is high enough, buying slows, and some investors begin to sell to lock in their gains. This decrease in price, following a short-term increase, is a market correction.

    Stock market corrections are followed by…

    Market corrections are usually followed once an increase in market prices has come and gone. A correction in a stock’s price following an upswing is characteristic of a stock’s true market value. It may not indicate a loss in value because it shows a market’s return to balance.

    Market corrections are a significant part of technical analysis. Many investors will use indicators to try to determine when the correction will begin and end in order to buy when prices are lower.

    Why the stock market crashes?

    The market drives for many reasons. It can be because the economy is weakening or because of investors’ perceptions and emotions. The fear of loss, for example, is one of those reasons.

    The market dips because investors are more motivated to sell than to buy. That’s a simple law of supply and demand. However, it doesn’t explain why investors are selling.

    Investors are looking in the future. They try to determine if their investments will increase in value. Investors watch for signs, news, rumors, and all about how the market will move.

    While the reasons for a one-day drop may change, a longer-term decline is usually caused by one or several of the other reasons:

    A slowing or reducing economy

    This is a “fundamental” reason for the market to sink. If the economy is slowing or entering a recession, or investors are expecting it to slow, companies will earn less. Hence, investors bid down their stocks.

    Fear

    In the stock market, the opposite of greed is fear. If investors think the market is going to drop, they’ll stop buying stocks, and sellers will going lower with their prices to find buyers.

    The absence of “animal spirits”

    This an old maxim. It refers to the waves of investor emotion and risk-taking through a bull market. As they see the chance for profits, people enter the market, pushing stock prices up. When this animal spirit dries up? When the fear is on the scene.

    Outside and big events

    This mixed category includes everything that might frighten the market: wars, attacks, oil-supply shocks and other events that are not completely economic.

    And what happens today? Are we approaching a point where we will see how much gravy is left in this stock market?

    Are the stock market corrections really vital for today’s stock market?

    There are several signs of a stock market correction. Last year was the most volatile year in the stock market since the recession. The volatility can increase stock market crises. But, volatility is just one reason the biggest hedge fund managers and respected economists are predicting a 2019 crash.

    Another reason is the rising interest rates.

    Increasing interest rates is a strategy to control the rise of inflation. How does it work? Increasing the cost of credit and making saving more attractive hits a balance between spending and saving.

    Though, this approach can be dangerous. Lower buyer spending has a negative influence on the revenue of the businesses.

    Decreasing revenue causes slips spending across both the consumer and business aspects. At the same time, higher interest rates make it harder for financially weak companies to meet their debt obligations.


    A wild flow can lead to economic depreciation, dropping stock prices, and stock market crashes. It’s not surprising that interest rate hikes have preceded over 10 economic recessions in the past 40 years.

    Experts predictions

    Rising volatility and interest rates are affecting investors and economists to warn of an approaching stock market crash.

    According to hedge fund manager Paul Tudor Jones, “We have the strongest economy in 40 years, at full employment. The mood is euphoric. But it is unsustainable and comes with costs such as bubbles in stocks and credit.”

    Scott Minerd, Chairman of Investments and Global Chief Investment Officer of Guggenheim Partners has forecast a 40% retracement, while economist Ted Bauman believes the market could fall by 70%. Finally, the CIA’s Financial Threat and Asymmetric Warfare Advisor Jim Rickards has claimed that a 70% drop is the best-case scenario.

    How traders can take advantage of stock market corrections

    Honestly, along with great volatility can come great rewards. The right financial tools give traders the chance to profit no matter if markets are rising or falling.

    Advanced traders can switch any potential market crash into a profit. They know how to hedge their existing investments until the market turns. In such periods they implement short trades. Despite, the volatile markets can produce higher trading risks. So proper risk management and volatility protection are essential.

    How to deal with a stock market corrections

    Most traders lose money when trying to move their money around to join the ups and avoid the downs.

    Most people lack the discipline to stick to a winning investing playbook in correcting markets. Also, they tend to transact at the wrong times causing even bigger losses

    In the past 5 years, the Dow Jones Industrial Average has almost doubled without any important pullback. For each of those years, a notable number of analysts have called for a correction or even a recession. These forecasts pushed investors to pull out of the market too early and lose the important gains.

    If you are going to invest in the market, it is best to understand that stock market corrections are going to occur. Often, it is best to ride out your mix of investments that have more potential for less risk.

    Resist the urge to trade and profit from them. Remember, never catch a falling knife.

Traders-Paradise