Tag: investing

All investing related articles are found here. Educative, informative and written clearly.

  • When To Buy Sell or Hold On The Stock

    When To Buy Sell or Hold On The Stock

    When to buy, sell or hold on the stock
    The enter or exit the investment must be in line with your investment plan.

    by Guy Avtalyon

    Beginners in the stock market are usually enthusiastic, but do they know when to buy, sell, or hold on to stocks to gain maximum growth and limit loss? 

    There are no guarantees for stock’s price, they can go up or down driven by various circumstances. So how to know when to buy, sell, or hold on stock?

    No one can tell you about one specific, the best strategy, good for everyone. But advanced traders follow some “rules of thumb” when they examine their investment movements. They are establishing entry and exit points and evaluating fundamental factors. But they had to learn some universal systems at first and after that, they were able to choose the one or a few that suit them the best.

    Examine Entry and Exit Points

    An entry point is the price level where the trader buys an investment or “enters the position”. The exit point is a price where you sell or “exit”. 

    If you want to avoid the wrong decisions and if you want to know when to buy, sell, or hold on the stock you have to define your entry and exit points. That means you must have a clear strategy to lower the risk and enhance your return. In other words, you have to set the right entry point to maximize winnings. 

    Also, it is extremely important to define where to set a stop loss. This point is worth in case the stock price starts to drop. Yes, some traders will wait for the dropping price to grow, but that may be dangerous in case the stock value continues to decline. This is especially important for short-term traders with the idea to buy and sell in a short time. 

    Traders usually practice stop and limit orders to maintain the balance between gains and losses. 

    The point is to have more winning trades, right? 


    To avoid permanent watching the charts and price changes you can set stop or limit order. That will provide you to enter or exit the investment according to your investment plan. 

    A limit or stop order means that you decide how much stock you want to buy at a specific price or when it peaks a specific price. So, you can place a limit or stop order for a higher or lower price than the current market price. The market price is the prevailing price of the stock.

    Stop and limit orders act separately but associate to the trader’s action in the same way. They enable traders to not have to continually watch price movements, but traders have various goals with these orders. 

    For example, when setting a limit order, the intent is to buy or sell a stock at a defined price. To be more clear, if a stock’s value is $85, and you want to buy it, you may set a buy limit order at $80 if you think it is your best entry point. 

    Thus, if you want to sell the stock, you may place a sell limit order of $90 if it is your projected or planned exit point.

    Stop order is a defensive strategy to lower losses. 

    To secure your investment, in case the stock continues increasing in value, you may set a stop order at a point a lot bellow the current price. But if you expect that stock to be trading below, you may try to minimize your losses with a higher-stop order that will be close to the current price or just a bit under the current price. 

    Stop and limit orders are created to trigger when the pre-arranged price is reached. If you set a limit order at $90, the stock will be sold immediately when the stock increases, and $90 is touched. Or vice versa, if you set a stop order below the current price, the stock will be sold when the price drops and it reaches that price. 

    I hope the point is clear, the trader with the limit order wants to sell when the price rises, and the trader who placed the stop order wants to sell when the price drops. 

    Why is important to know when to buy, sell, or hold on the stock?

    There is some risk involved in limit orders. A limit order “guarantees the limit price or better” but on the other side,  what if it never gets filled?

    A stop order means an exit from the stock position if the price drops, after your stock scores the stop you’ve set. In that case, your stop order becomes a market order and there are many competitors waiting to be filled. Hence, you don’t have a guarantee that your order will be filled at the specific price you placed. In some cases, you may end up selling the stock significantly below that level. 

    Moreover, if you have a sell stop at $90 and the price falls to $40, your order will be triggered at $60, which is a good thing. But things could go in the wrong way too. For example, if you purchased a stock at $80 and placed a stop at $75, the stock might go down to $70 and be sold, of course, but it can jump back to $90. 

    When to buy stock?

    In investing, it is important to determine what a stock is worth. Will it rise up to the estimated value? Set a range at which you would like to buy a stock. That might be helpful. Will you pay that amount for a particular stock? Be honest while giving the answer.

    If you don’t know the price target range, you will be in trouble with determining when to buy a stock.

    Also, you have to know about the financial health of a company. It is possible through the company’s financial statements that have a treasure of information. 

    You have to pay attention to the company’s revenue, for example, or how it relates to its past reviews. Are the company’s sales growing or shrinking? Read the company’s guidance for revenue or sales, which reveals how it expects to perform in the future.

    Cash flow is important too because it will provide you information about a company’s liquidity. A very good sign is when more money is coming into the company than it spends. It is a positive cash flow.

    Further, a stock might be undervalued. So, you must estimate a company’s upcoming prospects. Compare it with current reports. In this way, you will find a possible price target. If the current stock price is lower, buy it.

    When to sell the stock?

    Whenever the expected price is bigger than the current stock price, you have a chance to earn.

    The size of the return depends on how much of a discount a stock trades related to its expected value. Also, it is related to how much time the market needs to update its expectations. The higher the stock price discount and the sooner the market corrects its expectations, the higher the return.

    You can sell your stock when it hits its expected value,  or a more winning stock arises, or you change your expectations.

    When to hold the stock

    You have to know that it can take time for a stock to reach its real value. Any stock price forecasting is actually simple guessing.

    Your stock may need several years for a stock to reach close to a price targeted. If you are sure your stock will grow, hold it 3 to 5 years. Very often, you will profit more. It is essential to know when to buy, sell, or hold on the stock if you want a profit.

  • Should you buy a stock because of its dividend?

    Should you buy a stock because of its dividend?

    3 min read

    Should you buy a stock because of its dividend?

    Never buy a stock because of its dividend. A dividend shouldn’t be a reason to invest in a poor business. Most important is the performance of the business. That will drive a stock’s return and the company will be able to pay a dividend. So, you must pay attention to the business as a whole, the company’s plans, its goals, even to management and how they treat their employees. 

    Dividend stocks are recognized as safe investments, that is true. They are the highest valued companies. They have grown their dividends during the past 20 years and these are usually held as safe businesses. 

    But, just because a firm is providing dividends doesn’t mean it is a trustworthy investment. You have to learn how to avoid pitfalls that may arise, at first glance, with good dividends.

    Executives can use the dividends to pacify nervous and fidgety investors when the stock price isn’t running as they are expecting. You must know how the management is handling the dividends in a company’s strategy, for example. If you notice a lack of growth, stay away. Such a business isn’t good to invest in, even if it provides good dividends.

    Do you know what has happened in 2008?

    A great stock’s dividend yields were forced to unnaturally high levels due to stock price drops. The dividend yields seemed fascinating, but as the economic crisis developed, the profits fell. That caused the numerous dividend plans to be canceled entirely. The best example is the banks’ stocks in 2008. 

    They were paying great dividends but whenever dividend is paid the stock value instantly falls by an equal amount. That’s the point. And you may ask if the bankers knew that? Of course, they did. 

    Let me explain you something.

     buy a stock because of its dividend

    Very often, the chief purpose why some company pays dividends is because the executives can’t discover some solid growth possibilities within their own company to invest its earned profits in. 

    Hence, the company allows extra earnings to stockholders by paying dividends. But this is good, you may say. Yes, but…

    When a company gives a dividend equivalent to its profits, that is a sign that they are not able to find investment opportunity within their own business that would give greater return. If such a company stays for a long time in a similar situation, the growth will be slow. And at some point in time, they will stop paying dividends and the stock price will decrease to worthless.

    That’s the secret. So when you ask yourself should you buy a stock because of its dividend, be careful and have a bigger picture in mind.

    You should buy a stock because the company is paying attention to the development, research, infrastructure… Things that will increase your profit as the stock price is going up. 

    Now, can you answer me, should you buy a stock just because of its dividend?

    Of course not.

    Moreover, dividend-yielding stocks are taxable income.

    A dividend is a delivery of a part of a company’s earnings to stockholders. It can be done in cash, stocks, or other assets. It is a bonus to investors.

    Yes, many investors see dividends as the main point of stock holding. They want to hold the stock long-term and the dividends are an addon to income. Nothing is problematic in that. But buying a stock just because of dividend is very wrong.

    Dividends are an indication that the company is doing well, dividends are not bad. It has profits to share, more cash than it demands and it can give it to its stockholders. And a stock’s price may rise quickly after a dividend is paid.

    And there is a catch, on the ex-dividend day, the stock’s value will surely drop. The value of the stock will drop by a sum almost the same to the amount paid in dividends. 

    When you want to buy some stock do it because you believe in business or you think the value will rise. Don’t do it only because of a dividend.

    You would like to know THIS

  • October Effect – Investing When The Stock Market Go Lower

    October Effect – Investing When The Stock Market Go Lower

    October Effect - Investing When The Stock Market Go Lower
    Is October effect just a myth or there is something?

    By Guy Avtalyon

    The October effect is a recognized market oddity when stocks tend to fail during October. The October effect is an irrational suspicion of some investors related to previous market crashes that happened during October. Investors become superstitious, you might think. Well, the fact is that some great historical market crashes happened this month.

    We will point some of them. In 1907, the Panic, later, in 1929, were three large crashes – Black Tuesday, Black Thursday and  Black Monday, after almost 60 years 1987, Black Monday happened October 19, when the Dow fell 22.6% in one day. Also, on Oct. 9, 2002, the market caught a five-year low. And the market plummeted 16% in October of 2008 when the Great Recession began.


    When the stock market crashed in 1929, the investors were surprised. It was quite unusual because only a few weeks before the stock market was on the highest level ever, the stock prices were 25% higher than in the year before. In October 1929 stocks dropped nearly 25% for only two days. It cost investors billions of dollars. This market crash led to the Great Depression. October has accepted as a permanent warning to investors of how suddenly wealth can turn over.

    What is October Effect?

    There’s no proof that this great market crashes occurred in October for any other cause. Coincidence is truly a master of the game. Since there were not too many market crashes in October, we are free to say that investors will make money during October more often than they will lose.

    According to research conducted by Yardeni Research, the medium monthly return in October 2015, was 0.4%. 

    It wasn’t a great return but still, it was. But can we say the chain of unfortunate market events over October is broken?

    The truth is that if markets go down over October, they do it very hard and painful. But just for a sec try to be reasonable. Compare the drop of 4.7% in one month with 11 good months when the average gain was about 4.1%. Everything is math.


    So, we can say, at least, that October could turn high in any direction.

    For investors, September is statistically the worst month since they lose approx 1% during this month. History shows that September can be difficult for stocks. Since 1950, it has been the most critical month for the S&P 500, with declined at an average of 0.5%. But, for the last 10 years, the S&P 500 has a 0.9% profit in September.

    Is it possible to predict the stock market?

    It is hard to predict the stock market. Markets are going up and down. You can be sure of one thing: when it is down, it will climb up. The markets go up over time and you are a long-term investor you shouldn’t be worried about the market’s condition over one month. But if you are a short-term investor your portfolio should be built mostly on cash and bonds, less on stocks. That means it is better to be a conservative investor. So, the October effect will have no or less influence on your investments.

    Investors’ sentiments can become negative when October is near. That may influence the stock market play. As investors’ feelings incline to the depressed, negative market growth can produce overreactions. They will start to sell stocks in panic and the negative influence will increase more. 

    Keep in your mind, statistically October isn’t the worst month, it is September. But due to the great market crashes that occurred over October, we have that scary phrase – October Effect.

    By the way, do you know which month is the best for the stock market? July! Remember this.
    It would be amazing if the market crashes chose to happen just in one particular month of the year. Honestly, it is impossible, like the impossible is to have just one incredible good market month.

    October is just one of the 12 months of the year. The difference from others is that leaves start to fall. That is the October effect.

  • How to Calculate the Loss and Profit

    How to Calculate the Loss and Profit

    2 min read

    (Updated October 2021)

    How to Calculate the Loss and Profit

    It is always useful to discover the percentage rise or drop. That is called profit and loss.
    To calculate profit and loss we have to make clear some terms involved in the calculation.

    We will use the stock as an example. 

    * Cost Price ( CP): The price at which you buy a stock is the cost price. That is the amount paid for purchasing stock.

    * Selling price (SP): The Price at which you sell a stock is the sales price. That is the amount received when a stock is sold.

    * Profit (also the gain): You get a profit when you sell a stock at a price higher than its cost price. You will like to sell your stock at a higher price. CP < SP 

    * Loss: If you sell a stock at a price lower than buying price, then you caught a loss. CP > SP 

    The percentage of profit or loss is always calculated on the cost price.

    The formula for profit is

    Profit  = SP – CP  

    The formula for loss is

    Loss =  CP – SP

    Let’s calculate the percentage of loss and the percentage profit.  Percentage Loss and Percentage Profit are calculated based on CP 

    Profit% = (Profit/CP) × 100

    Loss% = (Loss/CP) × 100

    For example, one trader purchased a share of stocks for $1.000 and then sold it or $1.250. 

    What is the profit and profit in percentages? Is it 3%, 15%, 18%, 20%, 25%? 

    OK, this is basic. 

    The words “purchasing” or “buying” are indicated as CP, cost price.

    In our case, CP is $1,000.

    The trader sold the stock at $1.250.

    The word “sell” is indicated as SP, selling price. 

    In our case, SP is $1.250.

    We can easily find the profit. It is SP – CP, so

    profit = $1.250 – $1.000 = $250

    Don’t miss this What Is APY and How to Calculate it

    Now, we have to find the profit percentage.

    The formula is

    [(profit)/CPx100]

    so

    [(250/1000)x100] = 25%

    Our trader made a 25% profit in this transaction.

    But what would happen if our trader sold the stock at $800?

    CP is $1.000

    SP is $800

    loss = CP – SP

    loss = $1000 – $800 = $200

    or

    [(200/1000)x100] = 20%

    The trader’s loss is 20%.

    Calculate the Loss and Profit in Percentages

    • Divide the amount that you have profited on the investment by the amount invested. To calculate the profit, subtract from the price for which you sold the price that you initially paid for it.
    • Now that you have your profit, divide the profit by the initial amount of the investment.
    • The last step, multiply the number you got by 100 to see the percentage difference in the investment.

    If the percentage is negative,  you have lost on your trading. If the percentage is positive, you made a profit on your trade.

    By calculating the profit or loss you are actually estimating the change. Our calculation is based on the relationship between the selling price, and cost price. The difference shows if we are making a profit from the transaction or will we have a loss.

    You would like to READ: Gordon Growth Model – Mathematics of Trading


  • Is it Possible to Predict Stock Market Movements?

    Is it Possible to Predict Stock Market Movements?

    Predict Stock Market Movements
    How is possible to predict stock market movements. Read to the end.

    By Guy Avtalyon

    Different gurus and many experts try to predict the stock market movements. Actually, they try to explain the stock markets by using many different theories. Sometimes, stock market predictions are more interesting than the last season of GoT which isn’t so hard, right?

    Even if you are not a trader and you never traded stocks, the possibility to predict stock market movements is exciting. Imagine that you can do so. How much it can be beneficial to your financial status?

    Real estate can be failed at its lows, money can be removed from mutual funds, anything can happen.

    What we have to do when the markets start to turn around? 

    Maybe to invest in gold, oil, some other tangible assets? To leave crypto? To sell stocks?

    Yes, when things rise to go bad, relocating money into tangible assets is a benefit. But is it possible to know the danger is ahead before it happens? How to successfully predict the stock market movements consistently over time?

    Do you know the maxim that “past performance cannot predict future success”? The paradox of that saying is that it will come up to you just after your broker tells you how great that investment was acting in the past. 

    Wink-wink, bro! At some point, the future can be similar to the past. Even the same.

    Stock markets go upward, stock markets go down

    Why do stock markets do that? Well, it is easy to explain. When more buyers than sellers are in the market, the prices will go up and vice versa. When more sellers than buyers are in the market the prices will go down.

    What provokes people to buy and sell? More often it is connected to the emotions than to logic. And here we come. The emotions are unpredictable. The stock markets are under the emotional influence, so they are unpredictable too.

    And you may think it’s useless to try to predict stock market movements. Or they are created to be unpredictable. It is a partial truth.

    We found this on investmentwarrior.com:

    “If today’s market is up…there is a 73% probability of tomorrow’s market is being as well, and a 27% probability that tomorrow’s market will close down. 

    If today’s market is down…there is a 62% probability that tomorrow’s market will also be down, and only a 38% probability that the market will close higher. 

    Historically the market has advanced on 58% of all market days, demonstrating its overall historic upward bias.”

    The future of the stocks in the market is a complex problem. Too many variables have to be calculated. Quantitative models, historical patterns, all failed. 

    The best prediction tools are our brains. It is a damn good forecast tool. But a human intellect cannot solve a mathematical equation so fast as a computer can. The human brain isn’t even close to the simple calculator. But the human brain developed powerful tools, machines, and algorithms. They can calculate very fast. Some of them will solve the most complicated formula in a sec. 

    Why predict stock market movements

    Predicting stock market movements is possible. It isn’t a waste of time.

    Experienced traders being a witness of a lot of market’s ups and downs, believe that the market will be equal, one day.  

    Let’s go back to the predicting tools.

    There is something called “algo trading”. With AI you practically can have the possibility to make a profit almost for sure. How successful will you be, depends on the inputs you add to algo. 

    Can you predict how the bulk of traders would respond to some events? It can indeed be completely unpredictable.

    Who want to predict stock market movements 


    They need to be sure they are investing in safe assets. Also, they have to know they will have fast and huge returns.

    Here we come to algorithms. How? The historical data are extremely important for trading and investing, for predicting the stock market movements. Are you ready to spend days, weeks, or months to gather valuable results? Why would you torture yourselves? Instead, you can use some good stock predicting tool, very fast and reliable to calculate the final result, to show you where to invest, when to enter, and when to exit the trade. 

    Traders-Paradise is preparing – Find the Best Exit Strategy Algorithm

    Traders-Paradise chooses to develop this tool because the exit strategy is maybe more important than anything in your trade. How is that? While you have many strategies and choices to enter the trade, the exit of trade can be done in only two ways: with lost or with profit.

    To know when to exit your trade you will need a lot of data. The tool like mentioned one is the easiest way to obtain them. Also, at the same time, similar tools are going to help you to predict the stock market movements. This tool will estimate how far the price will move and ensure that your profit potential exceeds your risk.  Without that data, it is impossible to predict when to exit the trade.

    Traders-Paradise is preparing something for you from that field. You will see it soon and you’ll be able to use it. It is very useful and impressive. But, the best news comes last. You have to wait for a while but stay tuned

  • Bitcoin dominance rate – Why some are concerned?

    Bitcoin dominance rate – Why some are concerned?

    Bitcoin dominance rate - Why some are concerned?
    Why this question about the Bitcoin dominance rate now?

    By Guy Avtalyon

    The bitcoin dominance rate is a very important indicator of crypto market preferences. It is the measure of how Bitcoin is important in the crypto world. To know the Bitcoin dominance rate observe its market cap as a percentage of the entire market cap for all cryptos. The traders and investors pay a lot of attention to it.

    Okay, it isn’t shocking news that Bitcoin is dominant. Everyone knows that. It is here for a long time, it was the first, it has attention like a rock-star.

    So, why this question about the Bitcoin dominance rate now? The alarms are a turned-on because of Bitcoin’s current climbing.

    In the crypto markets, it covers about 70% of the market cap as a whole. The same level was seen in April 2017.
    So, there we have a concern on the scene!

    Some are afraid that this is a sign that the bull run is close. That will accelerate bitcoin’s dominance to over 90%. The existence of any other crypto would be doubtful. That high dominance rate would destroy the others.

    The altcoins are on the edge of return, think others. Or no-return, the opponents are kidding. As always, when it comes to data interpretation you can see and hear literally everything and anything. But to be serious, the bitcoin dominance rate may show us many things. Even the increase isn’t always good news.

    Why increasing dominance rate isn’t good news? 

    Well, Bitcoin’s dominance rate is not an independent measure. It is related to momentum, inclination, confidence. In one word – popularity. Bitcoin is the most popular cryptocurrency without a doubt.


    The price of Bitcoin is the measure of its reputation. On the other hand, dominance is related to bitcoin’s relationship to other cryptos. There is one trick: the dominance may increase when the price is going down and vice versa. To repeat, it isn’t an absolute measure.

    Bitcoin’s high dominance

    It could be a double sword.

    Bitcoin is an extremely volatile asset and risky this attribute often led investors to less risky assets and, can we say, safer. But, on the other hand, thanks to its popularity the whole sector of crypto assets may benefit if there are more investors in Bitcoin.

    This new increasing Bitcoin dominance is proof that investors’ sentiment that this crypto is relatively safe to invest in.  The sentiment indicator is just a current opinion, be careful with that.

    How can you be sure the trend will continue? With what energy? What sentiments do is give power, to push things to go further, to build a chain of very convinced investors and traders who are buying bitcoin. 

    The added importance is market trust, particularly at the initial steps of institutional engagement.

    Big traditional funds are not worried about the relative value of one token related to another. Their consideration is their portfolio. They will decide what is better to invest in, crypto, or some other asset. Having that in mind, it is more likely they will invest in Bitcoin if they want to have crypto in their portfolios. 

    Why is that?

    Bitcoin has the liquidity, active derivatives market and is registered in most jurisdictions. With the rising dominance rate, Bitcoin has the opportunity to boost investors’ trust in the overall crypto market. 

    But nothing would last forever.

    Prior run-ups in the dominance rate were followed with a change altogether with investors’ attention to new choices. That is a calculation. When market leaders grow extremely, wise investors take profits and re-invest in other winning assets. The last bull market noticed bitcoin’s dominance decline from above 85% to under 40%. This time it is something else.

    How? During the previous bull market, we had plenty of new tokens. Where are they now? They are not exciting anymore? No, they are not existing anymore.

    Moreover, the interest of institutional investors with a focus on bitcoin will launch bitcoin’s dominance to jump even more.

    Stay tuned and keep your eye on what is happening behind the stage. Traders-Paradise has a fantastic example of how to MONETIZE BITCOIN

  • Cannabis earnings – the countdown started

    Cannabis earnings – the countdown started

    The cannabis earnings potential is huge
    The cannabis industry is more than ever in investors focus

    by Gorica Gligorijevic

    Cannabis earnings is promising. This week can be very important for the cannabis industry. The time to post financial results is near. So, we will see their records for the last quarter. Aurora Cannabis is a top producer, but maybe some other marijuana stocks can generate more next year.

    First in line to show the last quarter result are:

    Greenlane Holdings Inc (NASDAQ: GNLN), Medipharm Labs Corp (OTC: MEDIF), and Village Farms International Inc (NASDAQ: VFF) they did it on Monday after the closing bell.

    Today, the results from Tilray Inc (NASDAQ: TLRY) will be shown. It is expected Tilray to record a net loss of 25 cents per share and its revenue to be of $41.11 million. Today also, earnings result from Green Organic Dutchman Holdings Ltd (OTC: TGODF), Acreage Holdings Inc (OTC: ACRGF), and Flower One Holdings Inc (OTC: FLOOF) are coming after the market close.

    On Wednesday, Aug. 14, Aleafia Health Inc (OTC: ALEAF), Jushi Holdings Inc (OTC: JUSHF), and Helix TCS Inc (OTC: HLIX) have to post their earnings reports. They are followed by Canopy Growth Corp (NYSE: CGC) and Trulieve Cannabis Corp (OTC: TCNNF) after the closing bell.

    This is a busy week for cannabis companies. Investors seem ready to reward good companies. The main criterion among investors is the company can gain a profit. But, they are more than ready to punish the ones that don’t.

    Cannabis earnings will rise

    The cannabis industry is a big-money market. With legalization in more countries than it is now the case, it can be one of the most valued markets. I know there will still be the black market and a lot of money will go there, frankly more than in the legal markets. But still, this market could produce more than $250 billion in the next 10 or 12 years, counting the annual average sales, of course.

    That sounds pretty good for long-term investors. So, I feel free to suggest to you some companies to watch in the future.

    As the first Aurora Cannabis as a top producer. 

    It is the most trustworthy cannabis company among millennial investors. This data comes from Robinhood, an online app for investing with over 6 million users. The majority of millennial investors are Robinhood users. That put Aurora to the most-held stock online investment. It is reasonable to expect that millennials will take a bigger part in the world of investment in the future and support legal cannabis growth. It is easy to evaluate the reasons behind investors’ decision to invest in this company.


    Aurora is leading the world production of cannabis with an annual production of 150,000 kilos. It plans to reach 625,000 kilos of annual output in 2020. And it isn’t unreasonable. By engaging the full production capacity, Aurora can produce 700,000 kilos of marijuana on the annual range.

    Wall Street anticipates Aurora can be one of the best revenue generators in 2020 and capable to deliver about $518 million in sales per year. 

    The potential of cannabis earnings

    There are not too many pot stocks in the arena that could hit this expectation. But, Wall Street predicted three cannabis stocks able to surpass Aurora Cannabis in 2020.

    Curaleaf Holdings is expected cannabis earnings at $900 million in 2020 sales but with a cash-and-stock deal for Grassroots, which will bring to it about $350 million, let’s say Curaleaf Holdings may generate about $1,250 million.
    Also, pay attention to Cresco Labs, the potential of $715 million sounds good as Canopy Growth with $521 million.

  • Procter & Gamble shares jump over analysts estimates

    Procter & Gamble shares jump over analysts estimates

    3 min read

    Procter & Gamble shares jump over analysts estimates


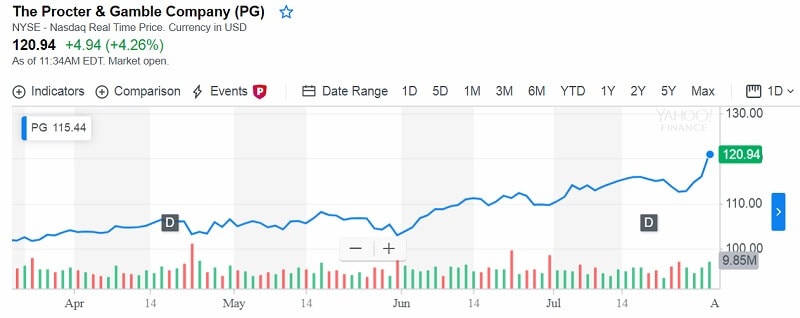
    Procter & Gamble shares recovered Tuesday. Its earnings exceeded expectations after removing out the influence of the charge. So, this company is looking for fiscal 2020 with more optimism. Procter & Gamble shares have risen nearly 44% over the past year.

    The company reported earnings per share $1.10 and expected revenue at $17.09 billion.

    Wall Street expectations were different, analysts predicted P&G earnings per share at $1.05 and expected revenue at $16.86 billion.

    P&G reported a fiscal net loss in the fourth quarter of $5.24 billion. It is $2.12 per share. Also, they reported the net income of $1.89 billion, or 72 cents per share, for the previous year. 

    Procter & Gamble problems

    The main cause of the loss for the quarter ended June 30 was the one-time cost to write down the value of Gillette. The company $8 billion write-downs of its Gillette brand.

    Keep out details, P&G gained $1.10 per share, defeating the $1.05 per share which was the experts’ expectations. 

    Net sales grew 4% to $17.09 billion, beating predictions of $16.86 billion.

    The sales volume of the Gillette brand dropped during the quarter. The same had happened to Braun and the Art of Shaving brands. 

    Organic sales increased

    Procter & Gamble shares jump over analysts estimates

    But its organic sales had a positive result because of the price rises, it increased by 7% over the quarter. Expanded sales in developed countries helped too, Tide and Ariel are very popular in those days. 

    G&B health-care and beauty products, line SK-II and Olay, also performed well.

    The organic sales of Pepto-Bismol and Crest toothpaste jumped up to 10%. Also, the other health care products like Vicks and ZzzQuil increased in the sale.

    And, what is interesting, its laundry and dishwasher brands reported sales increase of 10% in the quarter.

    The forecasts

    The company stated it awaits fiscal 2020 revenue growth by range 3% to 4%. This adds a small negative influence from foreign currency. Wall Street was predicting fiscal 2020 revenue of $69.76 billion, up 3.5% from this year.

    Also, Wall Street prediction is earnings per share to rise by 4% to 9%. 

    “Our guidance range brackets current market growth with a bias toward continued share growth, while still expecting a strong competitive response,” CFO Jon Moeller told analysts on the call, reported CNBC.

    The company stated that its current forecast for commodities, foreign currency, transportation, etc. is supposed to end in a “modest net benefit” to earnings growth in fiscal 2020.

    Experts were predicting that the company’s adjusted earnings next fiscal year would rise by 5.1% to $4.75 per share.

    The beginning and the future

    Procter & Gamble was founded as a family business in 1837. It was kind of the family uniting after they married two sisters  Olivia and Elizabeth Norris. Both William Procter and James Gamble were immigrants. 

    Candlemaker Procter, born in England, and soapmaker Gamble, born in Ireland. Of course, the company with their last names was selling candles and soaps at the beginning. 

    Fun fact: They were sponsors of radio shows all around the US. That’s how the phrase “soap operas” was born. From Ohio all over the world.

    Today it is one of the biggest companies on the globe. 


    Procter & Gamble shares jump over analysts estimates


    How did they come to this?

    They operated very smartly, they bought various brands all over the world. Gillette, Old Spice, Max Factor, Crest, Pampers, Ariel, Tide. That is a smart diversification.

    This company is employing more than 120,000 people all over the world and own more than 80 brands. 

    Should you buy their stock? OMG, for sure!

  • Passive Investing is a Good Choice

    Passive Investing is a Good Choice


    Why Passive Investing is a Good Choice?
    Passive investing is the way to force your money to work for you.

    By Guy Avtalyon

    Passive investing has become a significant part of the market. Finally! The low-cost index funds or exchange-traded funds are popular. However, there are still a lot of investors who are trying to achieve an excellent return through active investing. The question is why they are doing that when passive investing provides a better alternative.

    What is passive investing?

    It is investing your assets in funds that mimic a market. The main task of fund managers is to purchase the security in the precise proportion of a particular index to copy it. It is a passive investment. Sometimes you will hear the term  “indexed investing.” It is the same.

    Let’s consider a bit more the act of active and passive investing strategies. Three years ago, the S&P500 had a total return of 9.54%. What did every passive investor make? Precisely 9.54%.  On the other hand, an active investor gained 12,5%, but the other made just a 1,9%, or some made losses of -27%.

    How is that possible?

    The passive portion returned 9.54% and the total market returned 9.54%.  But returns before the cost is not what should be counted. You should count what you actually earn. And what is that? The returns after cost and after-tax.

    So, where is the catch?

    Passive management is cheaper than active. Active management is more costly. If you know that the cost of managing an index fund is between 0,15% and 0,50% rely on the market replicates, you will find that an active investing will have a minimum of 1% higher costs than passive investing.

    That 1% is 100 basis points and may not sound a lot.

    But let’s consider the following situation.

    Let’s say you put your money in the bank account instead of buying stocks because you don’t want to pay that 1% of costs. You are short immediately 5-6%. Your wealth is worthless. Actually, if you invest that amount in stocks there is a chance to gain more. With putting money in the bank account you will lose 15-16% of your net profit from potential investments in the stock market. In only one year. Over time this difference could considerably decrease your wealth. It will surely lower your standard when retirement. 

    The costs of active investing are not only fees. The activity by nature adds more costs. The active trades create capital gains more often than passive investing. So, why wouldn’t you avoid them entirely? It is simple math. If you want active investing you would pay more. Just take into account the taxes and costs. 

    So, we have to say, index funds and passive investing can be a better option than actively managed funds. 

    Passive investing in index funds has changed the investment world.

    In 1975, Jack Bogle, the father of passive investing, introduced the index fund. His radical idea showed the financial sector regularly cheated the individual investor with the unknown and opposed fees.

    This doesn’t mean that everyone should be indexed. Of course not. Active managers’ choices hold prices closer to values. That allows indexing to operate. Index investing means to leverage their trade without paying the costs. The majority of investors decide to index part of their money, some do it with all of them. But the others want to explore the less-priced securities.

    Let’s consult the statistic, in 2017, the percentage of securities owned by passive fund portfolios was about 5% of the total in the global market. The biggest part it took in the US where it was 15 %.

    When it comes to investing, you can choose between active and passive investing.

    Picking the right is crucial to your investing profit. If you make a mistake, you can end up with money loss. With the right one, you are the winner and you can make a big success in the stock market.

    How to find the right passive investing opportunity?

    Passive management requires buying investments that track an underlying index or making asset allocation and holding to it for the long term.

    One form of passive investing is the mutual fund investment because the mutual fund’s purpose is to return what the S&P 500 returns every year. The advantages of passive investing are numerous.

    Passive funds don’t require you to make trades and adjust holdings daily. The management fees are much cheaper, which is a benefit in the long run. You will always get the same percentage as the market returns. Good or bad, but the same.

    Passive investing is easy. You just have to pick some investments and that’s all. There is no need to monitor the market every second and make changes or to try to catch price swings. But passive investing is not for investors who want to beat the market. Yes, you can do it from time to time, but all the time. So, probably, if you are not a professional you will make big losses.

    Passive investing is more than set up your portfolio and don’t touch it anymore. You have to monitor your portfolio and make corrections as the market moves. You have to rebalance.

    Say the stocks increase in price, bonds are falling. If you have a 60% stock and 40% bond in your portfolio, this price movement requires an adjustment to 70% stock and30% bond in the portfolio. In case you never make these changes in your portfolio you will take on too much or too little risk. You will not achieve your targets. So, some monitoring has to be done. In the first place, you have to think about your money. The money is not just a piece of paper. Having money means that you are free and safe.

    You have to force your money to work for you. Passive investing is for sure a good way.


  • How Long It Takes to Have Enough to Buy a Home

    How Long It Takes to Have Enough to Buy a Home

    4 min read

    How Long It Takes to Have Enough to Buy a Home

    To have enough to buy a home is everyone’s dream. This is a tricky time for millennials who want to buy a home. Some research, for example in Canada, shows that young people need between 13 to 29 years to purchase their first home. That’s too much. 

    While millennials over the world are striving to get on the property, about 70% of Chinese millennials reached the milestone. 

    Mexico is the next with 46% of millennials homeowners, the following is France with 41%.

    For the majority of millennials, owning house persist too expensive and they can’t save enough for a deposit. Property prices have increased in the last several years and the rise in salary did not follow this

    Almost 2/3 of millennials declared they would need higher incomes to buy a home. 

    According to Forbes, China has seven of the world’s 10 most expensive cities for buying such a property.

    So how have so many millennials in China have enough to buy a home?

    There are no secrets. For most of them, a parent’s help was crucial. Also, they have some benefits for married couples. For sons in China, parents will do almost everything to help them get married.

    Thanks to the One-Child Policy, next year will be 30 million men more than women who are looking for marriage partners. Parents in China want to improve the chances for their sons and support them financially to have enough to buy a home. Speaking about, gender equality. But it isn’t the subject of this article.

    We want to show you how to ensure your deposit in order to buy a house, to have enough to buy a home.

    There are some other ways to get on the property on your own.

    Let us ask you something.

    1) Are you able to save each year?

    2) When you save, where you put your money?

    The message of the following story is: start saving early and try to save often. We want to show you the influence of compounding.

    Let’s estimate how long it will take you to become a millionaire. Yes, why not?

    We will start with the Rule of 1.5, likewise recognized as Felix’s Corollary. 

    This rule says that for a flow of investments where the number of years times the interest equals 72, the final value will equal approximately 1.5 times the amount invested. 

    Say, investing $10,000 per year for 8 years at 9% interest.

    8 x 9 = 72 

    The value of the investments at the end of year 8 will be about $120,000.

    Or make it simpler

    $10,000 x 8 x 1.5 = $120,000

    It’s so far from being a millionaire but…

    We will use Felix’s Corollary again. All we need to do is decide how long it will take you to save $720,000 at a contracted interest rate. 

    To explain why $720,000. Because $720,000 times 1.5 equals $1,080,000. This describes why we didn’t use $1,000,000. 

    This is easier than it looks, you will see.

    Say, with a saving of $90,000 per year you will need 8 years to acquire $720,000. 

    And at 9% annual interest, you would save $1,080,000 over 8 years. Of course, most of you don’t have $90,000 per year to put on savings. 

    That’s why most of us are not able to collect a million dollars in 8 years. 

    So let’s expand it to 16 years. 

    Now, what do we lack to be a millionaire? Again implementing a 9% rate of return? Yes! Here is where the rule 72 again in the scene. Using the Rule of 72, we know that whatever we have saved over the first 8 years will double over the next 8 years because 72 divided by our interest rate of 9% equals 8.

    So we can break the 16 year savings period into 3 equal portions: 

    1) the amount we save over the first 8 years; 

    2) the doubling of this amount over the next 8 years; 

    3) the amount we save the second 8 years. 

    And here it is: $720,000 divided by 3 equals $240,000. That is the amount we need to save each of the two 8 year periods. That is $30,000 per year if my math is good. And it is, so you just follow the rest of this. That means $2,500 per month, which is a reasonable saving for some people.

    But you want to determine what it will take to be a millionaire in 24 years. All you have to do is just divide $720,000 by 7 and then again by 8. 

    So, $720,000 divided by 8 equals 90,000 divided by 7 equals about $12,800. Right? Hence, investing just a bit over $1,000 per month at 9% interest during 24 years period will make you a millionaire.

    Invest in stocks with little money to have enough to buy a home

    But, how to know when to get in a position in investing?

    Investing takes time to grow. It requires a relatively moderate risk and moderate returns in the short run. But investing may produce bigger returns by placing both, interests and dividends to hold for a longer period of time. So, you are taking a long position while investing. 

    You would like to hold your stock for several years and have a decent return. In most circumstances, you should take the profit when a stock grows 20% to 25% of the buy price.

    When to get out in the investment

    The general rule of investing is never getting out of your investment just because the stock price is dropping. The rule “buy high/sell low” isn’t valuable while investing. Otherwise, you will never earn money in the stock market.

    A selling an investment too quickly can hurt your portfolio.

    Have Enough to Buy a Home

    Can you “ensure” some positions?

    All beginners, no matter how smart they are, have illusions, so they have losses. You have to keep your losses small, don’t let them scare you and survive.

    The rules for managing the risk that we’ll show you may feel disturbing for beginners because they have small accounts. Well, the proper risk control may limits trade size. I know that. But it is important for you to know that it is a protection in the first place.

    The crucial rule of risk control is the 2% rule: never risk more than 2% of your account investment on any opened trade.

    Start by writing down three numbers for every trade: your entry, target and stop. Without them, a trade may become a gamble.

    I want to share with you one of the best advice I got when I become an investor.

    If you see your stock rises by 40% you should sell 20% of your position. When the stock later increases 49% more, sell the other 20%. That will provide you to have 125% of your primary position.

    You have 100% of the initial position. And it grows 40%:

    100%*1.4=140%

    You sell 20% of it, which means that now in your hands you have 80% left:

    140%*0.8=112%

    Stocks rise for another 40% progressively:

    112%*1.4=156.8%

    Now you sell 20% of the stock you have in your hands:

    156.8%*0.8=125.44%

    You end up with 125.44% value of the initial position.


    The bottom line

    To know how to structure your portfolio just implement this rule:100 minus your age.

    This rule is used for asset allocation. Subtract your age from 100 to find how much of your portfolio should be allocated to equities

    If you are at your 30s you should have 70% in equities and 30% in debt. 

    Investing doesn’t have to be difficult if you start early, understand investment opportunities, and invest in different assets to minimize risk. And provides you to have enough to buy a home.