Tag: trading

All trading related articles are found here. Educative, informative and written clearly.

  • How Long to Hold Penny Stocks?

    How Long to Hold Penny Stocks?

    How long to hold penny stocks

    by G. Gligorijevic

    Trading penny stocks is one of the most hazardous investments in the market. They are extremely cheap, and this makes them volatile.

    Do you want to make money with these cheap stocks? Well, you have to know the basics. And one of the basics is to know how long to hold penny stocks. Like with many other assets in the market, you have to know when is the right time to buy penny stocks and when it is to sell. 

    But why the penny stocks are so special?

    As a difference from most blue-chip stocks, penny stocks ordinarily don’t match cyclical trends in the market. It may be more challenging to recognize how long to hold penny stocks. In reality, penny stocks will follow the general market trends in the sector they belong to.

    If a positive event happens, most stocks in the given sector will follow the trend. 

    When we are talking about penny stocks, as you can guess, a minimum change in price will cause a great gain in percentages. To understand this, take a look at this company’s stock chart.


    BroadVision, Inc. is an international software vendor of self-service web apps for business social software, automated commerce, business portals, etc.

    The stock price of BVSN was yesterday $2.84 which is $0.16 up or +5.97% from the previous trading day.

    But here is the tricky part. Penny stocks, no matter which company you are looking at, will always hit the peak. But what is following after the peak is what matters. Apps are booming nowadays. And typically for the penny stocks is that when the whole sector is rising most sector stocks will jump. When it comes to high-tech penny stocks, the volatility joined with positive feelings has produced some serious breakouts. What happens after those breakouts is more important. The stocks may collapse or to consolidate. 

    The consolidation can be difficult

    The stock will surely pull back but to a level lower than the peak and almost every time, that new level will be above previous highs.
    What you as an investor or trader has to do is watch the indicators. Pay attention to indicators that display overbought or oversold. Use the RSI indicator. Yes, it is a simple tool but can help you to determine what to do with your penny stocks.
    Never expect from penny stocks to give you a huge gain by holding them for a long time. Holding them too long is an extremely risky strategy. It is always better to set small goals. For example, 20-25% profit.  Also, you can use some other stock-trading indicators or combine them. But you have to know that indicators will not show you everything.

    Some traders don’t even use them, they believe they have a good hunch.
    When it gets to buying penny stocks or selling them it is all up to you. Of course, there are plenty of tools you can use to be surer if it is time to buy or sell. But even they are not sure-fire. This is particularly true when it comes to how long to hold penny stocks. The problem with the period of holding penny stocks is that despite all indicators and your confidence some bad news like the company’s annual report may ruin everything. So, watch your penny stocks carefully, and when you see they are rising, and indicators show they could rise more, don’t wait too long. Take profit. That is what matters at the end of the day. 

    You can hold penny stocks 5 minutes or 5 months but never more than 6 months. That’s the answer.

  • Getting Started Investing is the Hardest Part

    Getting Started Investing is the Hardest Part

    Getting Started Investing is the Hardest Part
    Getting started investing can be very easy and smooth since you need a little money to start. Investing is better than savings accounts because it can shorten the period of earning.

    By Gorica Gligorijevic

    Getting started investing isn’t a big deal, it shouldn’t fright you. Honestly, it’s so easy.

    You know what, when I was just a little girl (my grandma used to sing this) my parents gave a lot of effort to teach me how to save money. Grandparents would like to give me money for some holidays with advice to keep it for rainy days. I had my savings account. From time to time, they would put some money there but most of the time they insisted I have to put. And I did it. Not frequently, I have to admit, but still. With time that habit got strong roots. Every month I’d put 10% of my earnings on my savings account. I am still doing the same. That first savings account is my 10%-account. 

    No matter how big or small portion is. 10% would every time end there. 

    I can only speak from personal experience but I am sure that other people could easily find themselves in the same situation. 

    I am not going to give you advice because I know that is almost impossible to put anything on your savings when you are living paycheck to paycheck. Yes, the amount of money that the majority have available to spend every month is insufficient to put something aside. Despite the old saying about money: If you save me today, I’ll save you tomorrow.

    But we all know how important is to have something aside. And it is possible. Let me show you how.

    How getting started investing

    Okay, do you know the rule “pay yourself first”? Yes, starting this is hard. But do you understand the meaning of this rule? Of course, you do but why not tell it again. This means you have to put on your savings every month some amount of money. It doesn’t matter how much it is. A few dollars, or other currency you have. Just when you get your salary, put aside several coins. Every month. And you will see, that amount will grow with time. Try this. I am not going to tell you how should you spend this money. You may have enough for exotic travel, or to buy a car, or after some time you may have enough for house buying deposit. Just start.

    No, I will never tell you to live below your means. 

    Sacrificing isn’t a good way to save anything except life. If you try this method, living below your means, you will be unhappy and you will always have the feeling that something was taken from you. It can be a trigger for something more serious. But, anyway, try not to purchase the famous brands, too expensive things. Do it occasionally if it makes you happy. But don’t let it be your goal. Life is a lot more than brands.

    Create a budget

    What you can do is to make a budget frame. It is a smart idea to write down the amount of money you have every month. You can do that in some excel spreadsheet, or just in some memo. Also, there is a lot of money management apps you can use. OK, that’s the first step. The next is to subtract all the costs you have, for example, taxes, debts, loans if you have (don’t worry, we all have), etc. What you have in your hands after these deductions is your net income. This is the amount you have to use as a base for creating your budget. So, track your spending to be able to make some adjustments if it is necessary and possible, of course. You should review your budget from time to time to be sure you are on a good track.

    Getting started investing 

    Do you know that your money can work for you? Yes. Let’s assume that after one year of saving you have enough for exotic travel. Why do you need to make it right now? Go somewhere else and save e.g. $1.000 on your trip. That amount is more than enough for getting started off investing. You can do that with less money, here you will find how. You can choose to invest in some mutual funds (it is probably the best for starting), or stocks, or real estate. By investing you will generate a greater return than your money sleeping in your savings account. If you invest in something you will let your money work for you. The whole process may be done with your banker’s help. Your bank has financial advisors, investment advisors, they will tell you where to invest. Or you can engage some brokers.  

    What are the advantages of investing

    One of the main advantages of investment is that you can have your money work for you to earn more. Let’s say this way. You don’t need to work more to earn more. Your investment will that for you. Investing could bring you a higher living standard, for example.

    Further, you can apply investment plans for saving and growing money. The best part of investing is that you can be a long-term investor and money earned from investments can be spent to cover future expenses, for example, for your retirement, or buying a house, new car, your children’s higher education costs, or just you want to have more.

    It is important for you to understand that investing isn’t gambling.

    You can make a profit on investment due to research and careful choice of a suitable investment vehicle. It isn’t betting. The truth is that you can make losses in the market. That’s the reason to make less risky investments. Never mind if they have lower returns. Stay on them until you find yourselves capable to play riskier. That time may never come. You can stay in safe investments for your whole life. It is OK. 

    In that way, you will protect your property in the long run. 

    So, you can see that getting started investing isn’t always the hardest part. It can be very easy and smooth. You just need a little money to start. At least if you have some targeted amount you have to save in some period, investing will short that period. You’ll be able to gain it sooner. Sounds good, don’t you think?

  • Bull Market – What Everyone Should Know?

    Bull Market – What Everyone Should Know?


    stock bull market
    A stock bull market means that investment’s price rises over a long period. Investors’ faith in stock prices lead the prices themselves in a self-fulfilling prediction.  A bull market means profits for investors who own stocks.

    What exactly is a bull market? If you are like me several years ago, you are confused with all these terms, conditions, maths, evaluations, or estimations of the stock market.

    May I be honest with you?

    The truth is that I know nothing about the stock market when I entered. I was foolish, I know. But my desire to earn, to be investor was something I never have had before. It was like this…

    A personal story

    A friend of mine had a grandfather. Extremely interesting figure. He came from Italy to the US as a kid. OMG, he was just 12 when he bought a ticket and came with nothing except dreams about fortune. To shorten this story, after several years of struggling he made his first success. He became a clerk in the office of some broker. Step by step, that wonderful man became very rich. People, listen. Very rich! 

    I wanted the same. ASAP! I asked him for the recipe. Oh, how I would like I never did such a thing! The first lesson was: You know nothing, have to learn a lot. C’mon, man! Give me something else to start. I thought I know everything. I have just finished university. With a diploma in the hands, I thought I know everything possible about anything. Of course, I was wrong.

    That blessed man told me I had to learn. How to, where to go? I spoke with some friends. No help. So, I decided to start. I found a broker, put some money (not a lot) on my trading account, and started to find a stock. That was a nightmare! My first trade was totally a disaster! I placed another trade. The result was the same. In two trades I lost everything. 

    Ok, at least I tried. Then I went back to my friend’s grandfather and asked him to teach me. 

    “You get your first lesson, my son.” 

    OK, I understand. I have to go for basic. And I started to learn. You must learn to have a chance to earn.

    The bull market was the point where I started. I can’t explain why, but I felt I needed to know what it is.

    The term “bull market” indicates a stock market is rising. Of course, every single investor supposes the market to rise. Better say, has a hope it will rise. But having only hope means to stand in the mud. You can slide in a moment and fall. Having my previous experience in the mind, I needed more facts. 

    Nice from this zoological term

    So, I learned that the bull market occurs when the prices rise for 20% or more.  

    Further, I learned that a bull market systematically produces higher highs and higher lows. A stock bull market happens in a strong economy. Nice again, thanks bulls. But what can drive a stock bull market, that I wanted to know?

    And I found (with a little help from my friend) that great revenue, profit, and P/E ratio are the most important.

    The revenue should be in line with the economy, meaning revenue should grow by the speed of economic growth. Here is some interesting part. As consumers spend more on goods and services rise the economy will rise. Super!

    And I came to the companies profit.

    The revenue must generate profit. 

    But some knowledge defeated me. I thought that great profit is a wonderful thing and it is good when the company can generate more profit from the same revenue money. But it is not so simple. 

    And the P/E ratio! The stock price is just the amount of money it will cost to buy a share of a company. But stock prices can vary. If the demand for the stock rise, its price will rise too. The P/E ratio estimates the relationship between a stock price and its earnings per share. 

    I was confused just as you are now, I believe.

    In a bull market

    In a bull market, you’ll notice powerful demand and limited supply for securities. This means that more investors want to buy securities and less want to sell. What will happen? The stock price will rise, right. Let’s go further! Let’s observe investors’ psychology.

    In the stock bull market condition, investors have the hope of earning a profit. They are positive and optimistic. Oh, how I wanted to have that experience. Instead, I was scared to death. I needed more knowledge to sure what I am doing. My first trade was so stressful and, by the way, I wanted to show my older friend that I can learn.

    In the periods of the bull market, people have more money.

    And they are spending. In turn, it stimulates the economy to grow. My old friend told me something important and let me share that with you.

    When it is the bull market, you should buy stocks in the early stage, while they are not too expensive. As the price goes up, just wait for its peaks and sell your stocks. And don’t worry if there are some losses in price. It is temporary. Just invest in more stocks with a higher chance of getting a bigger return.
    I am grateful to him for this lesson. But there was one piece of advice that sounded the most important to me: “Play the market like toreador plays his wonderful performance in the arena. Peaceful, with confidence, elegant. Tickling the bull. You have to know where the limits are, don’t get surprised.” 

    I’ll not. Thank you, my dear mentor. 


  • How to Calculate the Fair Value of Your Stock

    How to Calculate the Fair Value of Your Stock

    Fair value points to the genuine value of a stock or other security that is agreed between the two parties, the seller and the buyer. It can be calculated for the assets that are traded, but not for the products that are being liquidated. It can be a challenge to calculate the fair value if there are no obviously visible market prices. The point of this is to define the price or value that is fair for both sides, the seller will not be on the losing side, and the buyer will end with a satisfying price.

    For example, a trader Anna sells its stocks to the trader John at $50 per share. The trader John believes he could sell it at $70 per share once he gets them. So, John buys 1,000 shares at the price Anna is setting. It is a fair value because both sides agreed the price and the trade is beneficial for each of them.

    Intelligent investors

    How to calculate fair value?

    You can do it with comparable information, for example.

    Use respectable financial news and find the last closing price for the stock you want to buy. Say, you want to buy 100 shares of some company and the last closing price of their stocks was $30. The fair value of 100 shares would be 100 x 30 = $3,000.

    Also, you can calculate the fair value using the discounted cash flows.

    For example, you want to examine investment that offers a range of cash flows. And you can’t find anything comparable. So, how to calculate the fair value of the investment?

    Let’s say it is an investment of $10,000 and it generates $2,500 cash flow per year. What you have to do is to write down the cash flows for, let’s say, 5 years.

    $10,000

    1 – $2,500
    2 – $2,500
    3 – $2,500
    4 – $2,500
    5 – $2,500

    Assume that the rate of return is 6%, and first calculate the discount factor so that you could calculate the discounted cash flows for each year.

    For calculation purposes, the percentages need to be transformed into whole numbers. It is done by adding 100 to the number of percents and then dividing that sum by 100, i.e. (100+6)/100=1.06. Now you can calculate the discount factor for each year by rising to power of that year this number, i.e. to the power of 1 for 1st, to power of 2 for 2nd, and so on.

    That should look like this:

    1.06^1 = 1.06
    1.06^2 = 1.12
    1.06^3 = 1.19
    1.06^4 = 1.26
    1.06^5 = 1.34

    The next step is to divide every $2,500 cash flow by the discount factor for each of these five years.

    $2,500 / 1,06 = $2,359
    $2,500 / 1,12 = $2,232
    $2,500 / 1.18 = $2,100
    $2,500 / 1.26 = $1,984
    $2,500 / 1.34 = $1,866

    This produces five discounted cash flows of:  $2,359, $2,232, $2,119, $1,984, and $1,866.
    Add these five numbers to -10,000. That was the initial investment, do you remember? Let’s see the result.  The result is 541. This means that using a 6% rate of interest, the fair value of this particular stocks is $541.

    Also, you can calculate the fair value for a stock is by using the P/E (price to earnings) ratio.

    The formula to calculate the P/E ratio is 

    the current stock price per share / current earnings per share

    What you have to do is to compare P/E ratios among companies from the same industry. For example, if you want to find the fair value for a utility, you have to compare the P/E ratio to other P/E ratios in that industry.

    If the company has a high P/E ratio it usually means the company is overvalued. On the other hand, a low P/E ratio shows the company is undervalued. For example, if you hold a stake of shares in a company with a P/E ratio of 4 and the average P/E ratio for other companies in the same industry is 2, you can be sure that your stock is expensive or, in other words, overvalued.

    The next thing to do is to modify the stock price to the average P/E ratio. Let’s say the average P/E ratio is 2, and the P/E ratio on your stock is 4. This means the current price is $8 and earnings per share is $2. We know that by following the P/E ratio formula.

    Use the P/E calculation to find what the stock price needs to have a P/E ratio of 2. 

    The equation is 

    New P/E ratio x Earnings per share

    And the answer is 2 x $2 or $4. The fair value for this stock is $4, not $8.

    Bottom line

    The puzzle of what security is really worth is one of the basic questions in investing. By calculating fair value, you will find the answer, maybe not exactly but you will be very close to it. Although, fair value calculations are essential to any investor’s stock.

    Ways to fair value can classify value investors and growth investors. 

    The growth investors will estimate earnings that can be unstable. On the other hand, value investors will buy stocks at a discount to their fair value. They will wait for the fair value of their investments to rise.  But both kinds of investors have to know that their companies can stumble. Also, the company may get significantly bigger which will cause keeping historical growth rates difficult.

    The point is to buy stocks that will rise to meet the fair value of the company.


    You might find these interesting too:

    >>> The Average Daily Trading Volume How to Calculate

    >>> Calculate Portfolio Performance

    >>> Short Selling For Profit

    >>> Lot size in forex – What is it and How to calculate it?

  • Stock Investing – The Pros and Drawbacks

    Stock Investing – The Pros and Drawbacks

    5 min read

    Stock Investing - The Pros and Drawbacks

    by G. Gligorijevic

    Stock investing isn’t just buy and sell stocks. It is the whole philosophy and math. Well, you have to learn more about the logic behind the stock market.

    When you want to buy a stock, that means someone else has to sell it. Be aware, that someone has worked on the numbers and concluded that the wise move is to get out of the position right now. Do you know why that one decided like that? How to be sure you are doing a good job if you pick that stock?

    Stock picking is a struggle against other investors.

    Maybe they know just like you, maybe more, maybe less. 

    The basic formula is easy: Pay a value that’s smaller than the long-term, per-share price of the underlying business. The philosophy of investing is in understanding how to determine that value.

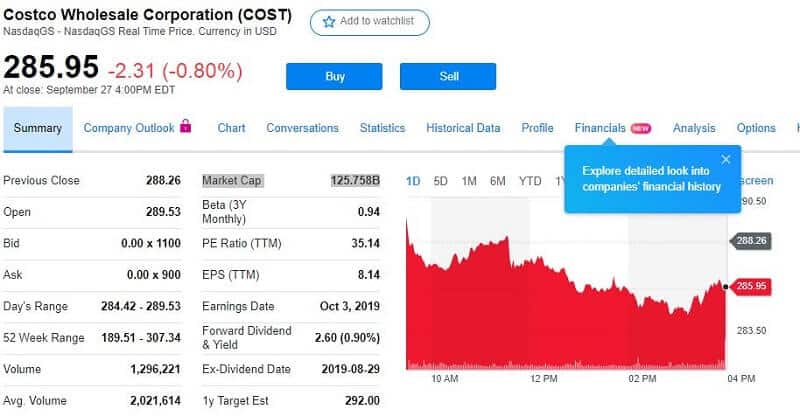
    Maybe you prefer to be a “growth” investor. So, your focus should be on the analysis of a company’s potential for future profits. You should choose the one growing fastest. As a growth investor,  you are interested in great earnings. The P/E or price-to-earnings ratio is a popular metric for valuing stocks. Growth investors often are willing to pay P/Es of 20 or more.

    Value investors usually buy stocks with lower P/E ratios. This appears more traditionally. But buying cheap has some risks. Very often when some stock is cheap it is a sign that the company has some problems. Is this true? No! Simply NOT! There is no easy way or formula that helps you to pick a fabulous stock to deal with.  You have to research and make a decision.

    But maybe you should invest in funds than individual stocks.

    Stock investing demands time and intense analysis. It also needs notable cash to create a fully diversified portfolio. A choice is a mutual fund. That will spread your bets between hundreds of stocks.

    Stock investing is attractive and enjoyable for a lot of people. If you want to enter the market on your own, you can use funds as the essence of your portfolio. Later, just set aside a small account for your selection of the individual stocks.

    One of the main benefits of investing in the stock market is the chance to grow your money. Over time, the stock market performs a rise in value. Yes, the prices of individual stocks rise and fall daily. But, investments in solid companies that are able to grow, tend to make profits for investors. Moreover, investing in many different stocks will boost your wealth by leveraging growth in different areas of the economy. It will bring you a profit even if some of your individual stocks lose value.

    Stock investing gives a lot of benefits to investors.

    Owning stocks means to take advantage of a growing economy.
    How does it come?
    That is a kind of chain of good fortune. Everything is connected and logical.
    Assume you want to buy a stock you’ve been examining for some time. And finally, they announce a surprise bit of good news and the price rallies sharply higher and so you jump in.
    Let’s say, you have a sudden profit on your hands but, the stock reverses.  It has retracted back to your entry price. Actually, it has gone beyond your entry price and you are a loser!  You may think that it’s just market games and “shaking out weak hands”. So, you decided to hold on, knowing that patience is a trading power.  Finally, you’re down further than you expected to be in the stock.
    If you were ultra convinced of the upside potential, you may see this as an opportunity to buy more shares at a better price. On the other hand, you may panic and sell as you continue to watch the price trend further against you.  

    What happened?

    Experts developed the “Efficient Market Hypothesis” which states that stock prices instantly diminish all news. So, there’s no possible way for a trader to profit from news releases. That experts feel that strongly.

    Here is one example.

    Maybe two years ago,  Samsung announced it is expecting profits to hit record levels in the third quarter. And almost three times as much as the same period the year before.
    Following the announcement, their share price dropped.
    That might seem counter-intuitive. But there are other factors at play. At the same time as announcing this expected profit win, Samsung’s CEO quit. He told that the company was going through an “unprecedented crisis” and that “a new spirit and young leadership” was needed to respond to the challenges. In this case, the decline in stock price can be understood. You know, if the CEO is worried, perhaps investors should be too.

    But sometimes share prices drop on good news and it is really hard to understand why.

    Market expectations are always priced into the market price. Say, for example, a company has a forecasted earning per share of $1. They’ve never missed an earnings target. So investors expect the firm will actually earn $1.10 per share. They think it’s currently undervalued. The firm then announces an earnings report of $1.05 per share.

    Good news, right? They beat their forecast.

    But, crucially, because investors thought the firm should earn more than this $1.05 per share, the stock’s price was bid upwards to a price that reflected earnings expectations. Because the real earnings are less than the current market price, the stock price drops as investors sell off their shares.
    This effect can be intensified by investors who completely copy what everyone else is doing. In this case, selling off their shares. Every investor must have the bigger picture. That’s the point.

    What you have to do?

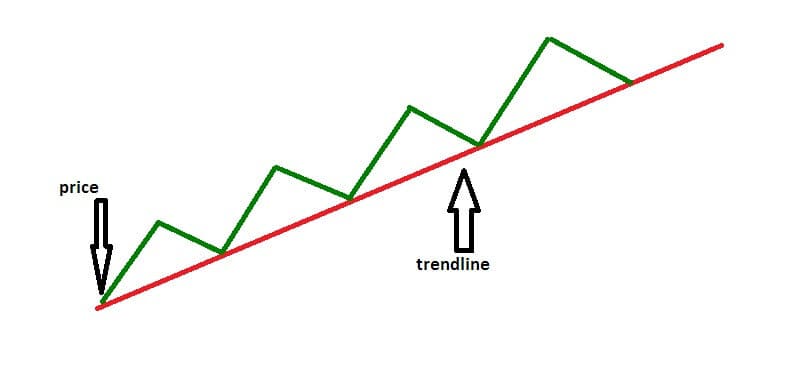
    If the stock is basically strong, hold the stock despite the stock price going down. It won’t matter much in the long term if the company. Most of the great companies focus on their long-term goals. This means that a few times, they might miss the short-term expectations.
    But, short-term interests shouldn’t be ignored completely by the company or investors. Nevertheless, if the company is overall performing good in the long run, then there’s no point of worry. In any business, there will be few difficulties in the short run.
    Additionally, do not get connected to short-term expectations. Analysts will keep on making expectations every quarter. It’s their job and this is what they are paid for. If a company keeps on working for the short-term goals, it might never be able to focus on long-term growth.
    Overall, if the temporary setbacks are not going to affect the long-term profitability of the company, then ignore the short-term fluctuations and hold your stock. 

  • Dow Jones Dropped More Than 300 Points, But Two Stocks Hold Gains

    Dow Jones Dropped More Than 300 Points, But Two Stocks Hold Gains

    3 min read

    Dow Jones Dropped More Than 300 Points

    The Dow Jones dropped more than 300 points after frustrating economic data stopped an early rally in the stock market on Tuesday. The stock market rally experienced a strong reversal. The rally appeared under more pressure as worsening U.S. manufacturing index activity renewed recession fears. JPMorgan Chase (JPM) dropped below a buy point, as Treasury yields declined. 

    The Institute for Supply Management’s manufacturing index declined to its lowest level previously seen in June 2009.

    The Dow Jones Industrial Average (DJINDICES:^DJI) and the S&P 500 (SNPINDEX:^GSPC) both lost more than 1%. All sectors declined, but industrial stocks were damaged the most.
    But some of the Dow Jones Index stocks made the largest gains, Apple (AAPL) and Visa (V). Apple stocks rose for 0,5% and Visa increased by 1,4%. Visa has been consolidating below the 50-day line the past three weeks after pulling back from a 184.17 buy point of a flat base.

    Apple scored a new high early and gained as the market reversed. It regained a 221.47 buy point of a flat base and continues in buy range from the entry. The market uptrend is under pressure, so you must be aware that all trading is riskier now.

    According to investors.com “investment banks, machinery, and telecom stocks led the downside among IBD’s 197 industry groups.” On the other side, long-term medical care, gold miners and food, and beverages were between the several groups resisting the decline.
    Hexcel (HXL) fell 6% to a two-month low, retailer Boot Barn Holdings (BOOT) sank 5% in below-average volume.
    Israeli medical technology company InMode (INMD) and Visa were some of the few IBD 50 stock winners with increases of 1% or more.

    The point is that just one strong market session could upgrade the whole picture, but if another large sell-off occurs could freeze the stock market rally. 

    China trade discussions will continue next week, but there are possible risks for the weak stock market rally.  Investors have been hoping for a China trade suspension of hostilities. That was the reason why the market wasn’t down on Monday. 

    The added uncertainty to the markets is the Trump impeachment inquiry. For now, it doesn’t make to much damage to the US stock market but investors may become more nervous because of all of that. 

    Is this a scary start to October?

    Markets are already in bubble territory. Dow, S&P experienced the worst day in more than 5 weeks after gloomy US manufacturing report. Manufacturers quoted the US-China trade war as pressing on demand and making materials more expensive, according to the ISM.

    “The disappointing data is only fanning long-standing fears of slowing global growth,” said Alec Young, managing director of global markets research at FTSE Russell.

    Stocks didn’t like this data pretty much.

    Investors came into Tuesday’s session, with increased emotion around the U.S.- China trade relationships hoping that it will come to an end soon. 

    But stocks dropped after the Institute for Supply Management (ISM) stated U.S. manufacturing activity dropped last month to its lowest level in a decade. The U.S.-China trade concerns caused that. The weak manufacturing data come from Europe too. All of that forced investors to sell equities and bought bonds.
    The market recognized the ISM report as a warning the trade war is taking increasing damage to the economy.

    What is next?

    Yes, Dow Jones dropped but investors are waiting for data from ADP and Moody’s Analytics. They are planned for release on Friday. For investors, it is a kind of preview to the government’s monthly job report. So, we will see.

  • How to Buy Preferred Stock – The Tricky Road Is Now Simpler

    How to Buy Preferred Stock – The Tricky Road Is Now Simpler

    3 min read

    How to Buy Preferred Stock

    by Guy Avtalyon

    KEY POINTS
    • Preferred stocks are hybrid security. Let’s say,  something between bonds and common stocks.
    • The preferred stocks are riskier than bonds but less than common stocks
    • Pay attention to THIS! Don’t buy a preferred stock issue at or near par value.

    I know you’re probably thinking now to buy preferred stock and where to find them? Truth is it isn’t so easy to find them, so let me help you a bit. 

    I’ll give you the additional data that you can’t find ANYWHERE else.

    First of all, preferred stocks are hybrid security. Let’s say,  something between bonds and common stocks. You have to know that they are riskier than bonds but provide higher payments. And that is exactly what we want – higher returns, right?

    By holding preferred stocks, you will receive regular fixed dividends. The procedure of buying them is the same as it is with common stocks. Firstly, you have to choose your broker. The thing you have to check is that your broker has a good and reliable list of preferred stocks. So, check the range of it before any commitment. Well, you will need some personal research on preferred stocks to pick the right one or several from the list of shares your accessible through your broker. Take your time, they are worth your effort.

    Now, you have to recognize preferred stocks that match your interest. Evaluate the companies you have info that will work well in the future. Keep in mind that preferred stocks are long-term investments. 

    You can trade them on the stock market in the same way you would do it with common stocks. 

    Just like bonds, preferred stocks have credit rating and that is also needed to be checked. 

    Where can you get this info?

    From a corporate credit rating bureau. Based on the data you receive from the bureau you will know if investing in preferred stocks is a good choice for you. 

    But there is one tricky part that shouldn’t terrify you. 

    You will see that credit rating for this kind of stocks is lower than it is for bonds. That comes due to their risky nature. As you can see at the beginning of this article, the preferred stocks are riskier than bonds but less than common stocks.

    Let’s go straight to the point. How to buy preferred stocks, where you can find them?

    You have to read balance sheets. In the stockholders’ equity section, you will notice the amount obtained from issuing preferred stock.

    In the income statement, you will find the annual preferred dividends report.

    Analyze issuing companies completely. Put your feelings about some company away. You are not investing based on your feelings. You have to do that based on your investing goals and risk tolerance. You will need a strong understanding of how a company’s stock works before you make a decision.

    Read the stock’s prospectus. It is easy to find them online.

    Preferred stocks offer a bit more than common stocks or bonds.

    Actually, preferred stocks bring great deals. For example, yields average is 6.1%. It is much above the high-yielding sectors of the market, for example utility stocks and real estate investment trusts.

    Where to find preferred stocks?

    Try to find them among banks, and different financial companies, since they issue more than 80% of preferred stocks. Also, you can find them in telecommunications, health care, energy or similar companies.

    Companies usually issue these stocks at $25 per share. That is par value. When investors start trading them, the price will go up or down. It is due to the interest rates. Just like bonds. When the interest rates climb the price of preferred stocks will fall. And vice versa.

    In regular market conditions, preferred stocks should be better than high-quality bonds. They have to provide you steady income. And taxes below those for bonds interest.

    How to buy a preferred stock simply?

    Look here! A necessary starting point is an online broker that provides screening tools. Companies ordinarily give a grace period before they can redeem shares. It is usually 5 years after they issue preferred stocks. Besides that, a company may recall its shares at any time. So, keep a close eye on the call date.
    Check all dates carefully to be sure you have at least 18 months before a company can repurchase shares. 

    I don’t know if you’ll buy it today or in a month or year. But I want you to know this!

    Experience tells that preferred stocks under $23 are riskier, but if they are over $28 the yield could be too low. Moreover, if it is over $28 the potential loss could be bigger if the stock is called at $25 per share. A perfect yield should be between 5% and 7%, say experts. If the yield is higher, the potential risk is bigger.

    Pay attention to THIS! 

    Don’t buy a preferred stock issue at or near par value.

  • Trade War Spillover In The Stock Markets

    Trade War Spillover In The Stock Markets

    3 min read

    Trade War Spillover In The Stock Markets

    The U.S. Treasury announced in a Saturday statement that the administration “is not contemplating blocking Chinese companies from listing shares on U.S. stock exchanges at this time.”  Following this news, Dow Jones futures grew a bit on Sunday evening, the same happened with S&P 500 futures and Nasdaq futures.

    Only one day before, Bloomberg reported the Trump administration is thinking about limiting the exposure of US investment to China. Such a decision would have an impact on public pension funds’ exposure to China’s market and limitation for Chinese companies in main stock indexes.

    The information about delisting Chinese stocks from U.S. exchanges frightened investors. The consequences of the trade war spillover were that Alibaba stock dropped 5.1%, slipping through its 50-day and 200-day moving averages. JD.com stock dropped 6% to a bit over its 200-day.  Two Chinese IPOs, Pinduoduo slipped 4.2% and Huya stock 9.4% due to trade war spillover. New Oriental Education stock, dropped 6.55%, which is under its 50-day line.

    Beijing described possible limitations on U.S. investments in China “the latest attempt at a decoupling,” published in Global Times on Sunday. All reports of Chinese state-owned media stated that the delisting Chinese companies from US stock exchanges would have deep impact on both, Chinese and US economies.

    Don’t miss this: Trading With Success – A FULL guide for beginners

    Monica Crowley’s, U.S. Treasury assistant secretary for public affairs, stated this weekend that US administration is not thinking to block Chinese companies: “We welcome investment in the United States.”

    The trade war between the US and China lasts almost one year. The next round of discussions will be held one week after China’s National Holiday, 70th anniversary of the founding of the People’s Republic of China on October 1.

    The Chinese economy is the second-largest in the world. Its progress in the field of artificial intelligence and chips is notable. Also, robotics, 5G, energy storage could lead China to be the most powerful in advanced technologies.

    What to watch in the stock market in the week ahead?

    The next few days will produce some earnings releases, which could give some individual stocks moving. 

    Costco

    Market Cap $125.758B


    Its earnings report appear this week. It looks that Costco had benefit throughout the quarter. The analysts estimated they have earnings of around $2.54 per share. Last year it was $2.36. So, the expectations are a 7.6% increase.

    Costco will reveal its results on Thursday. The investors are expecting to see good news. This warehouse retailing giant has enjoyed a nice increase in customer traffic lately. In the fiscal fourth quarter, it grew 6% in the U.S. market and over its global sales.

    Stitch Fix 

    Market Cap $1.85B


    This company’s earnings release will be revealed on October 1.

    Its stock has dropped more than half of its value during the past 12 months. But this online service that gives clothing services has built solid annual income growth in the past 3 years. 

    Client numbers rose 16.6%  in the fiscal third quarter. This is, of course, assuming Stitch Fix keeps its pricing in check. The analysts estimate is calling for $0.04 per share this week. Good news for shareholders.

    Constellation Brands 

    Market Cap $39.511B


    The company’s earnings release will be public on October 3.

    The company has succeeded to keep a very constant sales trend within an alcohol industry. In the last 5 years, Constellation Brands has grown its earnings from sales. Its investment in Canopy Growth was a weak move since the Canopy didn’t show some good results this year. But the company’s beer segment may show better condition. For now, that is the best part of Constellation Brands’ business.


  • How to Identify Market Trends

    How to Identify Market Trends

    6 min read

    By Guy Avtalyon

    Being able to identify stock market trends is a crucial part of your investments and trading. How many times have you heard that the market is trending? Numerous. But did you have the ability to recognize the signs before the market move in some direction?

    So, when we say the market is trending we are talking about market moving in one of two directions. When the market is moving up it is Bullish, but when it moves down it is a Bearish trend. There is some misunderstanding toward trends. Let’s say this way, never fight against market trends. That will take you to losses. Rather catch the flow to manage your risk-reward.

    It is so important to have ways to identify market trends. Markets can also move within a ‘range’, and they don’t need to be recognized as Bullish or Bearish, rather they are falling sideways. So, you can see we have three possible market directions. Ability to recognize when a market is probably moving out of a trend will also help you. 

    Assume you are trading while the market is in a Bullish trend. So your focus would be on buying the position. But suddenly the market starts to change and your edge disappears. 

    It is absolutely scary when you are looking at those changes at your charts. But there are several things that will provide you to know how to identify market trends.

    First, let’s make clear what the trends are you looking at.

    This is very important. You have to determine the time frame you are looking at. Why is this so important? Assume you are looking at a daily time frame and the market is in a bullish trend. Suddenly, the market moves up. Where is the problem? Your 10 minutes chart shows the bearish trend! Yes, but you must have a bigger picture. The market may be in bullish trend the whole day but in those 10 minutes, it is bearish because it is falling. 

    That is the nature of markets. They will never go only up or only down.

    That’s why the timeframe you are looking at is very important. Just like in sport. Your favorite basketball team is in permanent progress to the top of the table. In the market, it is a bullish trend. But suddenly, your team has a match against some outsider and they lost the game (which usually happen to my favorite team). That is a bearish trend in the market. 
    <

    How to Identify Market Trends

    Identifying the trend is essential. But you have to be able to associate that trend with your trading. For example, you recognize a market as bullish on the daily timeframe. What is the possible move? Just wait until it comes back within support levels that you expected to be the span where the buyers will continue the trend. Than start to look at the 1-hour timeframe to buy positions. That is how you may adjust your trades with the market trend.

    You can identify market trends by applying different kinds of technical analysis. You can use trendlines and technical indicators. But trendlines are the most effective method of verifying that a trend breathes. 

    Identifying the trends will help you to avoid wrong buy/sell signals. One thing is important to know, the trending indicator will operate better in trending markets, while oscillators are better in sideways trends. Which one to use may define your success rate.

    Recognizing Trends

    The trends are an overall direction that a particular financial market is moving. To analyze trend you have to use technical analysis to determine direction. Just connect by using trendline all the highs and lows in your charts.

    So, let’s see what kind of trends we have:

    Uptrend

    The uptrend is when you can inline low points sloping upward. The main characteristic of uptrend is higher highs and higher lows.

    Downtrend

    Connect a series of chart high points sloping downward, and you will have a downtrend. A downtrend is always defined by lower highs and lower lows.

    These graphs are simple images in order to have a clear picture. Trendline should be drawn on the candlestick chart. But in any case, to be able to start a trend line you will need at least two points in the market. You may draw the trendline only when the second swing high or low is identified.

    Speaking about the candlestick chart, you will see that the majority of trend lines overlap the high or low of a candle. The point is to get the maximum touches without cutting the body of a candle. If the trend line cut the body of a candle you may be sure it is a violation. 

    Identifying Market Trends

    Draw triangles on market swings. 

    We already mentioned the market swing points. I am free to say that probably the most obvious way to identify a market trend is to follow them. You can do it by drawing triangles.

    We already know that higher highs and higher lows relate to a Bullish trend and lower highs and lower to a Bearish trend. By drawing triangles over important market swings you will spot when this is occurring. This helps also to inform you when the market

    It will also keep you alert to when the market finish trending and moves into a range, or the trend goes reverses.

    Also, you may use the Bill Williams fractals indicator.

     It is an excellent tool to identify market trends. This indicator is helpful to spot the market swings. When the arrows are upward that is the high of the swing, when the arrows pointing downwards it is low of swing.

    Upward pointing arrows indicate the high of a swing, downward pointing arrows indicate the low of a swing. This is a simple tool that will show you if the market is in a trend. Moreover in what direction, or if it is in a range.

    Moving average as help on how to identify market trends

    The moving average is one of the most popular methods to identify market trends. When the market is beyond the level of the moving average, it is Bullish. If under, it is Bearish. But this method has some disadvantages. It depends on the period you are looking at. 

    One moving average can miss out on great parts of trends so you will end up struggling against the trend. It is always smart to apply two moving averages. One has to be slower the other faster. And, when the faster one is above slower the market is bullish when it is below the market is bearish.

    Use trend lines

    That’s why we had to explain the trend lines. Trend lines are a great tool to identify a market trend. Also, they will highlight potential trading zones inside the trend. The market is in trend when it respects the trend line.

    When the market breaks the trend line it is moving out of the trend into a range, or into a trend reversal.

    Bottom line

    Markets consist of many different varieties of trends. How to identify market trends will principally define the success or downfall of your investing. No matter if you are a long or short-term investor.

  • BTC Price Will Surge Again

    BTC Price Will Surge Again

    2 min read

    BTC Price Will Surge Again

    Yes, the Bitcoin prices displaying a massive drop on Tuesday. Well, there is good news too. Crypto investors continue bullish! So the BTC price will surge again.

    As BTC recorded a huge fall and fell about 13%, investors and traders persist optimistically. They expect the bull market to recover quickly.

    Bitcoin price made a sharp drop yesterday (September 25) falling almost 16%. The daily open was at $9,691 but recorded a new low at $8,164. The price support was broken at $9,090 leaving the area that it has been trading in since June.

    In doing so, price broke strong support at $9,090 and exited the area that it has been trading in since June. Bitcoin’s price action continues bearish under this scope.

    But nothing is finished. Today’s chart (at the time of writing) shows some uptrend. A small one but still.

    The larger picture reveals regular price action with prior corrections. 

    You wouldn’t like to miss this: MONETIZING BITCOIN

    Traders-Paradise wrote about the second-largest German exchange in Stuttgart which started Bitcoin trading. Also, Bakkt starts and SoFi, a finance management firm is launching a crypto trading platform. 

    Are people still micro wise? Well, not all thankfully. BTC price will surge again.

    The BTC/USD pair is trading at the $8,407 after hitting a low at $8,125. In the past two days, the price has passed below the SMA200. Dangerous? Yes, but the typical race for Bitcoin. For unexperienced in Bitcoin, the bullish momentum will continue as long as the daily close is above the long term average. The indicator stays on the bullish side of the indicator. You can check it.

    BTC/USD needs strong support levels, instead, it may fall even more since BTC/USD had another heavily bearish day on Wednesday. The disturbing element is that the daily confluence indicator doesn’t show any support levels until $8,100.

    But even if it goes lower its still a good entry for longs. It is expected the volume further fails on a macro scale. But the price may consolidate if the trading starts again.

    Bitcoin’s price is a distraction from the value.  Everyone was yelling about Bitcoin’s drop past two days. What is about today? It has recovered.

    Don’t judge based on hash rate data. It is an estimation. It isn’t exactness. Until traders start to trade it again the price of Bitcoin may stay on the low level. The point is, Bitcoin may drop slightly more in the next few weeks, with frequent ups and downs but to the end of the year, it may surge again, and more than anyone can expect. That’s the nature of Bitcoin and the beauty of the game