Some simple ways to identify the market trends
6 min read
By Guy Avtalyon
Being able to identify stock market trends is a crucial part of your investments and trading. How many times have you heard that the market is trending? Numerous. But did you have the ability to recognize the signs before the market move in some direction?
So, when we say the market is trending we are talking about market moving in one of two directions. When the market is moving up it is Bullish, but when it moves down it is a Bearish trend. There is some misunderstanding toward trends. Let’s say this way, never fight against market trends. That will take you to losses. Rather catch the flow to manage your risk-reward.
It is so important to have ways to identify market trends. Markets can also move within a ‘range’, and they don’t need to be recognized as Bullish or Bearish, rather they are falling sideways. So, you can see we have three possible market directions. Ability to recognize when a market is probably moving out of a trend will also help you.
Assume you are trading while the market is in a Bullish trend. So your focus would be on buying the position. But suddenly the market starts to change and your edge disappears.
It is absolutely scary when you are looking at those changes at your charts. But there are several things that will provide you to know how to identify market trends.
First, let’s make clear what the trends are you looking at.
This is very important. You have to determine the time frame you are looking at. Why is this so important? Assume you are looking at a daily time frame and the market is in a bullish trend. Suddenly, the market moves up. Where is the problem? Your 10 minutes chart shows the bearish trend! Yes, but you must have a bigger picture. The market may be in bullish trend the whole day but in those 10 minutes, it is bearish because it is falling.
That is the nature of markets. They will never go only up or only down.
That’s why the timeframe you are looking at is very important. Just like in sport. Your favorite basketball team is in permanent progress to the top of the table. In the market, it is a bullish trend. But suddenly, your team has a match against some outsider and they lost the game (which usually happen to my favorite team). That is a bearish trend in the market.
<
How to Identify Market Trends
Identifying the trend is essential. But you have to be able to associate that trend with your trading. For example, you recognize a market as bullish on the daily timeframe. What is the possible move? Just wait until it comes back within support levels that you expected to be the span where the buyers will continue the trend. Than start to look at the 1-hour timeframe to buy positions. That is how you may adjust your trades with the market trend.
You can identify market trends by applying different kinds of technical analysis. You can use trendlines and technical indicators. But trendlines are the most effective method of verifying that a trend breathes.
Identifying the trends will help you to avoid wrong buy/sell signals. One thing is important to know, the trending indicator will operate better in trending markets, while oscillators are better in sideways trends. Which one to use may define your success rate.
Recognizing Trends
The trends are an overall direction that a particular financial market is moving. To analyze trend you have to use technical analysis to determine direction. Just connect by using trendline all the highs and lows in your charts.
So, let’s see what kind of trends we have:
Uptrend
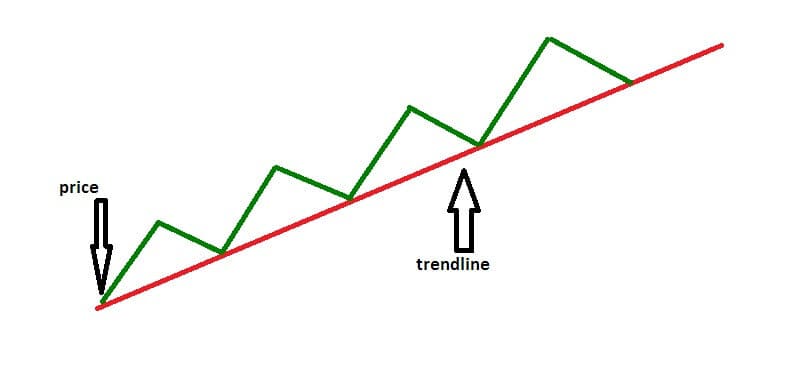
The uptrend is when you can inline low points sloping upward. The main characteristic of uptrend is higher highs and higher lows.

Downtrend
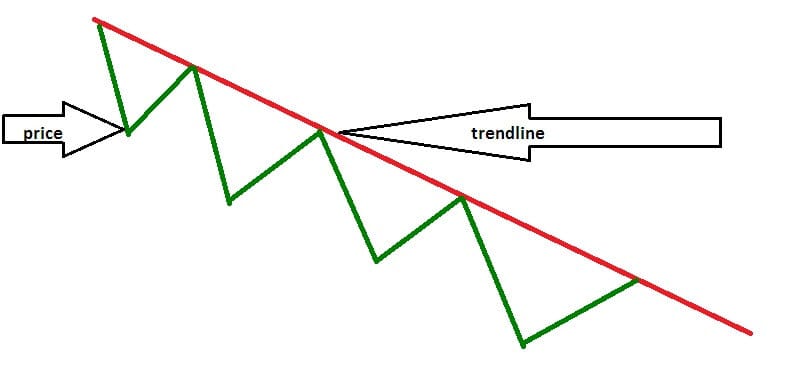
Connect a series of chart high points sloping downward, and you will have a downtrend. A downtrend is always defined by lower highs and lower lows.

These graphs are simple images in order to have a clear picture. Trendline should be drawn on the candlestick chart. But in any case, to be able to start a trend line you will need at least two points in the market. You may draw the trendline only when the second swing high or low is identified.
Speaking about the candlestick chart, you will see that the majority of trend lines overlap the high or low of a candle. The point is to get the maximum touches without cutting the body of a candle. If the trend line cut the body of a candle you may be sure it is a violation.
Identifying Market Trends
Draw triangles on market swings.
We already mentioned the market swing points. I am free to say that probably the most obvious way to identify a market trend is to follow them. You can do it by drawing triangles.
We already know that higher highs and higher lows relate to a Bullish trend and lower highs and lower to a Bearish trend. By drawing triangles over important market swings you will spot when this is occurring. This helps also to inform you when the market
It will also keep you alert to when the market finish trending and moves into a range, or the trend goes reverses.
Also, you may use the Bill Williams fractals indicator.
It is an excellent tool to identify market trends. This indicator is helpful to spot the market swings. When the arrows are upward that is the high of the swing, when the arrows pointing downwards it is low of swing.
Upward pointing arrows indicate the high of a swing, downward pointing arrows indicate the low of a swing. This is a simple tool that will show you if the market is in a trend. Moreover in what direction, or if it is in a range.
Moving average as help on how to identify market trends
The moving average is one of the most popular methods to identify market trends. When the market is beyond the level of the moving average, it is Bullish. If under, it is Bearish. But this method has some disadvantages. It depends on the period you are looking at.
One moving average can miss out on great parts of trends so you will end up struggling against the trend. It is always smart to apply two moving averages. One has to be slower the other faster. And, when the faster one is above slower the market is bullish when it is below the market is bearish.
Use trend lines
That’s why we had to explain the trend lines. Trend lines are a great tool to identify a market trend. Also, they will highlight potential trading zones inside the trend. The market is in trend when it respects the trend line.
When the market breaks the trend line it is moving out of the trend into a range, or into a trend reversal.
Bottom line
Markets consist of many different varieties of trends. How to identify market trends will principally define the success or downfall of your investing. No matter if you are a long or short-term investor.


