Category: Traders’ Secrets


Traders’ Secrets is something that everyone would like to know, right?
How is it possible that some traders are successful all the time while others fail to make a profit all the time?
That is exactly what Traders’ Secrets will show you.
Traders-Paradise’s team reveal all trading and investing secrets to you, our visitors.

What will you find here?

How to find, buy, trade stocks, currencies, cryptos. You’ll find here what are the best strategies you can use, all with full explanation and examples.
Traders-Paradise gives you, our readers, this unique chance to uncover and fully understand everything and anything about trading and investing. The material presented here is originated from the experience of many executed trades, many mistakes made by traders and investors but written on the way that teaches you how to avoid these mistakes.

Moreover, here you’ll find some rare techniques and strategies that are successful forever, for any market condition. Also, how to trade with a little money and gain consistent returns. By following these posts you’ll e able to trade with greater success. You’ll increase your profits and your wealth, of course.

The main secret of Traders’ Secrets is that there shouldn’t be any secret for traders and investors. Rise up your trade by reading these posts, articles, and analyses!

You’ll enjoy every word written here. Moreover, after all, your trading and investing knowledge will be more extensive and effective.

Traders’ Secrets will arm you with those skills, so you’ll never have a losing trade again.

  • Is it Possible to Predict Stock Market Movements?

    Is it Possible to Predict Stock Market Movements?

    Predict Stock Market Movements
    How is possible to predict stock market movements. Read to the end.

    By Guy Avtalyon

    Different gurus and many experts try to predict the stock market movements. Actually, they try to explain the stock markets by using many different theories. Sometimes, stock market predictions are more interesting than the last season of GoT which isn’t so hard, right?

    Even if you are not a trader and you never traded stocks, the possibility to predict stock market movements is exciting. Imagine that you can do so. How much it can be beneficial to your financial status?

    Real estate can be failed at its lows, money can be removed from mutual funds, anything can happen.

    What we have to do when the markets start to turn around? 

    Maybe to invest in gold, oil, some other tangible assets? To leave crypto? To sell stocks?

    Yes, when things rise to go bad, relocating money into tangible assets is a benefit. But is it possible to know the danger is ahead before it happens? How to successfully predict the stock market movements consistently over time?

    Do you know the maxim that “past performance cannot predict future success”? The paradox of that saying is that it will come up to you just after your broker tells you how great that investment was acting in the past. 

    Wink-wink, bro! At some point, the future can be similar to the past. Even the same.

    Stock markets go upward, stock markets go down

    Why do stock markets do that? Well, it is easy to explain. When more buyers than sellers are in the market, the prices will go up and vice versa. When more sellers than buyers are in the market the prices will go down.

    What provokes people to buy and sell? More often it is connected to the emotions than to logic. And here we come. The emotions are unpredictable. The stock markets are under the emotional influence, so they are unpredictable too.

    And you may think it’s useless to try to predict stock market movements. Or they are created to be unpredictable. It is a partial truth.

    We found this on investmentwarrior.com:

    “If today’s market is up…there is a 73% probability of tomorrow’s market is being as well, and a 27% probability that tomorrow’s market will close down. 

    If today’s market is down…there is a 62% probability that tomorrow’s market will also be down, and only a 38% probability that the market will close higher. 

    Historically the market has advanced on 58% of all market days, demonstrating its overall historic upward bias.”

    The future of the stocks in the market is a complex problem. Too many variables have to be calculated. Quantitative models, historical patterns, all failed. 

    The best prediction tools are our brains. It is a damn good forecast tool. But a human intellect cannot solve a mathematical equation so fast as a computer can. The human brain isn’t even close to the simple calculator. But the human brain developed powerful tools, machines, and algorithms. They can calculate very fast. Some of them will solve the most complicated formula in a sec. 

    Why predict stock market movements

    Predicting stock market movements is possible. It isn’t a waste of time.

    Experienced traders being a witness of a lot of market’s ups and downs, believe that the market will be equal, one day.  

    Let’s go back to the predicting tools.

    There is something called “algo trading”. With AI you practically can have the possibility to make a profit almost for sure. How successful will you be, depends on the inputs you add to algo. 

    Can you predict how the bulk of traders would respond to some events? It can indeed be completely unpredictable.

    Who want to predict stock market movements 


    They need to be sure they are investing in safe assets. Also, they have to know they will have fast and huge returns.

    Here we come to algorithms. How? The historical data are extremely important for trading and investing, for predicting the stock market movements. Are you ready to spend days, weeks, or months to gather valuable results? Why would you torture yourselves? Instead, you can use some good stock predicting tool, very fast and reliable to calculate the final result, to show you where to invest, when to enter, and when to exit the trade. 

    Traders-Paradise is preparing – Find the Best Exit Strategy Algorithm

    Traders-Paradise chooses to develop this tool because the exit strategy is maybe more important than anything in your trade. How is that? While you have many strategies and choices to enter the trade, the exit of trade can be done in only two ways: with lost or with profit.

    To know when to exit your trade you will need a lot of data. The tool like mentioned one is the easiest way to obtain them. Also, at the same time, similar tools are going to help you to predict the stock market movements. This tool will estimate how far the price will move and ensure that your profit potential exceeds your risk.  Without that data, it is impossible to predict when to exit the trade.

    Traders-Paradise is preparing something for you from that field. You will see it soon and you’ll be able to use it. It is very useful and impressive. But, the best news comes last. You have to wait for a while but stay tuned

  • Ashton Kutcher Investor – Celebrity Investors

    Ashton Kutcher Investor – Celebrity Investors

    3 min read

    Ashton Kutcher Investor

    Ashton Kutcher is one of the most popular actors of the 21st century.

    Everyone knows his role as Michael Kelso on the well-known sitcom That 70s Show. But in real life, Kutcher isn’t even like Kelso. This actor and model is at the same time, a very successful investor.

    Ashton Kutcher is an investor too.

    He builds a financial portfolio worth more than his acting career has yielded to him.

    Ashton Kutcher’s current net worth is approximately $200 million. According to contracts available, about $25 – $30 million he was able to earn from his acting. The rest of his wealth comes from tech investments. 

    Ashton Kutcher’s earnings from movies & TV

    Ashton Kutcher has surely earned a lot of money from his acting.  But the majority of his income doesn’t come from that. Unfortunately, we have some information available, but most of it is private.  Okay, we know, for instance, Kutcher had a role in the movie Valentine’s Day that earned $110.4 million.

    The movie Dozen earned $136.6 million, No Strings Attached and Killers earned $70.6 million and $47.0 million earned at the box office.

    There is a lot of chance that Kutcher took a big part of the earning. Also, he was paid $800.000 per episode in the sitcom Two and a Half Men. And so that and so long. The information about how much an actor earned for a film or television role is private for many reasons. Even the information is made public, it is still difficult to tell precisely how much was paid. Let’s say that from the total net worth of Ashton Kutcher, around $30 million comes from television and movie roles.

    Ashton Kutcher as an investor

    "<yoastmark

    This guy is fairly unusual in the acting society. He has made clever investments and brought the attention of the investment community. Ashton Kutcher investor is very interested in science and technology. In the first place, the high-tech industry is very interesting to him

    One of his investments had a great influence on rideshare. Yes, you are right. Kutcher with his parents invested $500.000 in Uber on its beginning. Today, that $500,000 investment is worth $50 million.

    Kutcher, with Guy Oseary and Ron Burkle, founded a company named A-Grade investments. They invested $30 million and turn it into more than $250 million. According to Kutcher, he and his two other buddies like to invest in tech companies that show promise. 

    Just to mention a few, they already have invested in companies like Uber, Spotify, Airbnb, Muse, Soundcloud. 

    The interesting thing about Ashton Kutcher is that he is using Uber’s service. Practical? Marketing? Well, everything is possible but the truth is that he made a smart investment.

    A-Grade investments own some other companies too. We will point several: Nest, Gyft, Katango, GroupMe, Bufferbox, Summly, Socialcam,  Interaxon, SmartThings. The fact is that A-Grade, owned by Ashton Kutcher, Guy Oseary and Ron Burkle, has approximately 100 various important investments.

    Kutcher is still a young investor but he has a lot of years ahead to continue his investing. 

    He has also co-founded the investing tool Acorns that is connected to PayPal. The main benefit is that connection enables people to transfer their money once a month into the Acorns portfolio. Acorns portfolio further provides the software which buys investments shared with other investors. Why this is a benefit? Using this tool people can build a portfolio with very little money.

    The  Net Worth of Ashton Kutcher

    Ashton Kutcher’s net worth is about $200 million today.  His portfolio is something that even more experienced and an older investor could boast. Also, with his wife, Kutcher is dedicated to charity.

    We can admire him for his acting, but the true admiration comes for his sense of business. Respect!

    HERE you can find his advice about investing.

  • Who is Satoshi Nakamoto?

    Who is Satoshi Nakamoto?

    Who is Satoshi Nakamoto?


    Who is Satoshi Nakamoto? This is the beginning of the fairytale.

    Who is Satoshi Nakamoto?


    What Nakamoto revealed about himself in Part 1 of “My Reveal” is disappointing. 

    This revelation announced with fanfares and bongos but looks like another marketing campaign. First of all, it is structured as billion call-to-trust-me campaigns or buy-this-shit-because-I-know-you-are-stupid.

    This self-declared Satoshi Nakamoto overpromised. And the most interesting part of all this, no one in the crypto ecosystem isn’t surprised. 

    We still don’t know his/her real name nor we can see the photo. Will it come with Part 3? Or maybe never? 

    This “big reveal” is more a “big lie” because we are still far away from knowing who is hidden under the name of Satoshi Nakamoto.

    All we know is that his nickname is Shaikho and that is Pakistani name. He kidded that he’ll reveal his real-life identity on August 20.

    That should be Part 3? Right?

    Who is Satoshi Nakamoto?

    Let’s see what this Satoshi Nakamoto revealed about himself.

    Under the title “My Reveal”,  this “Satoshi” gave his alleged origin story, some fairytale about the Bitcoin’s name background. Now, we know his ideology (a very important matter for Bitcoin’s existence, indeed). Oh, yes! This person, or whoever created that blogpost, pointed the relationship to Bitcoin pioneer Hal Finney (already known fact, so nothing new).

    “Satoshi” now allegedly lives in the U.K. and he is the son of a banker who had worked at a Pakistani multinational bank. And his name is unknown too.

    Some of his/her claims are so similar to the declarations of Craig Wright, the other self-proclaimed Nakamoto.

    For example this part from “My Reveal”:

    “Today, when Bitcoin is understood by the advances of technology, but at the same time is being hijacked by greed, I feel I have a duty to work hard and make my creation better and take its vision to the next level.”

    And this so romantic tale about how Bitcoin got its name. That has to touch our souls, right?

    Take a look at the logic behind this reveal. Cryptocurrency analyst Ledger Status noted that as Satoshi was a master of logic, and the only way he would truly reveal himself is by signing the Bitcoin genesis block.


    Also, the @BTC Twitter handle stated that “Anyone that tells you they are Satoshi Nakamoto is a scammer”.

    Do you remember how a very alike “reveal” happened but was nothing more than a stupid marketing campaign?

    On Friday, a lot of paid press releases were issued arising from a company named Satoshi Nakamoto Renaissance Holdings. A company’s big “reveal” happened on Sunday, August 18. 

    And we got it. Part 1 of “My Reveal” by still self-proclaimed Satoshi Nakamoto. We yet don’t have any reliable evidence that it is he or she, the creator of Bitcoin. 

    We are suspecting that part 2 will be something better and provide us a closer insight at who Satoshi Nakamoto is. First of all, we have one simple question: How he/she has lost access to the coins and cannot move them?

    What if all this is another marketing campaign with the foggy goal? Maybe some money-need can be behind this. What do you think?

    Okay, we will wait for the end of this fairytale. Maybe, they’ll be happily married.


  • The Truth About Forex Trading

    The Truth About Forex Trading

    4 min read

    (Updated November 2021)

    Traders-Paradise got (and still get) a lot of emails with the questions: What is the truth about Forex trading? or Can you tell me the truth about Forex? or Tell me, please, is Forex profitable or it is a myth?

    Okay, people, it’s time to tell you things that nobody will ever tell in one place. 

    First of all, the vast websites you visited searching for the answer to the question above, are sites with some Forex offers. Doesn’t matter if it is a brokerage, exchanges, system, signal providers, strategies, platforms. They all have one common interest: to present you only THE BEST. Their goal is to sell you their products. There is nothing bad in their goals and intentions, but you must be aware that some things will always stay covered and hidden from you. Until you build your own experiences. 

    We are giving you the shortcuts because all of us were struggling while we were novices in Forex trading. Actually, our struggle begins before we enter the Forex trading. Just thinking, measuring, asking, searching is struggle itself. And, still, you will find several sites or people ready to tell you the truth about Forex trading. Just because there are some characteristics to trading that the majority will never like to talk about.

    And yes, those features of Forex trading are ugly. Some are evil and scary. But Traders-Paradise’s opinion is that we have to talk about everything, doesn’t matter if it is nice and affirmative or ugly and not-so-nice subjects.  

    We will share what we know to answer you what is the truth about Forex trading. 

    Just to give you a clear path to decide if Forex trading is for you or not. The benefits you already know, you can make a fortune trading Forex but we want to show you the other side of the same medal. One thing you must keep in your mind: none of us is going to tell you to give up. 

    Based on our personal experiences, the most common misconception is that you have to be some math geek if you want to trade Forex. Yes, it is beneficial if you can understand the math behind your trades but you don’t need to be genius for that. This has to be said, a lot of very successful traders never even started high education. Have you ever heard about some Forex trading college or university? Of course not. Because if you want to be a successful Forex trader you must have particular skills. You don’t need a diploma. Speaking about those skills, for the profitable Forex trader is more useful to be a strong personality, not to get panicked when trades go in an unexpected direction. If you are nervous and without self-confidence, then Forex trading isn’t for you.  

    Yes, numerous and complex trading strategies are out there. 

    The Truth About Forex Trading

    And indicators, charts. OMG, Forex is for Nikola Tesla, not for me! 

    Just stay calm! The ability of self-control is more important. Forex markets are endless tension. Your nerves are what is really in a count, not your math knowledge. 

    Traders-Paradise will reveal you a secret. The winning traders very often practice one trading system. They learned that system, tested it on some demo account for several months, started the real Forex trades and VOILA! Their result is verified, the system is working, they have profit, so why change anything?

    The other thing we would like to share with you is the fact that in Forex trading your entry and exit points are irrelevant. Sound like a blasphemy, right? Imagine us, we are laughing! Because it is the truth about Forex trading. How the mentioned points are important if you can place your trade while sitting in a restaurant with your friends or walking. All you have to do is to take your phone in your hand and start to trade, whenever you want. Sound crazy? 

    Wait, there are more!

    We have heard so many times that humans generally are not good at trading. 

    The truth is that some are better. 

    Being a successful trader doesn’t mean that someone is naturally predisposed for that. That isn’t something the mother will give you with a birth. 

    What you have to do is to start thinking that you have to fight with the market. Just like in flight or fight situation. Imagine that the market wants to still all the money you placed there. 

    What does your brain tell you? Flight! 

    No, never if the Forex trading is for you. Your brain should command you – FIGHT! While you are sitting in front of your computer, you have to be the fighter. Or you will gain the loss. Whoever loses a profit, gets a loss. (That is wise, we should spread this sentence all over the world.)

    When we are pushing the buttons to place our trades, actually we are pulling the triggers. On our brain’s command. And here is the trick. Our brains will send us variously commands. That’s why you must have a plan. It is a battlefield, you cannot just run around and shoot. That’s when you are afraid or you are disoriented. 

    To have winning trades you must have a logical plan while trading Forex. If you don’t, you are 100% losers.

    One of the biggest lies about Forex trading is that some traders keep 100% successful trades. 

    No one can ever guarantee 100% success rate, no person and no algorithmic application

    This truth about Forex trading you will find nowhere else: 

    Do you know how some brokers or signal providers, or strategy sellers want you to believe that they have a magic weapon for the markets? That’s a lie. They are lying to you. Trading isn’t so easy.

    It may take years until you be able to gain a permanent profit from trading. Our aim is not to frighten you, but this is the truth. You will need months and years of analysis, testing and error corrections to be professional traders.

    The biggest truth about Forex trading is that you don’t need superior software or multiple trading screen setups to be a prosperous trader. This is something that no one will tell you. Especially trading websites. All you need is a device with full access to some free charting app. 

    Remember, the most powerful tool in your trading armory is your brain, not trading software. Some very simple and cheap but user-friendly software can provide you more benefits than a robust one. Remember this. 

    Traders-Paradise revealed you the most hidden secrets about Forex trading and told you the whole truth and nothing but the truth.

    Happy trading from Traders-Paradise Team!

    Find us on Facebook
    Follow us on Twitter


  • Tom next what is it – explanation with examples

    Tom next what is it – explanation with examples

    3 min read

    by Gorica Gligorijevic

    Tom next is a short-term transaction in foreign exchange when you buy and sell currency together over two separate days. Actually, it is a business day we are talking about. One day is tomorrow in the sense of one business day. The following day in sense of two business days from today is known as the spot date.

    The main aim of this transaction is the traders and investors keep their position and are not forced to exercise real delivery. 

    So, suppose you already know that in the Forex market, each transaction carries an attached value date. That is the date when buying or selling activities will hit their value. The value date happens 2 business days after the transaction is executed. The profit or loss generated by the buying and selling is settled into a particular account.

    To be more clear, when you take a position in a currency it is expected that you will deliver the currency in two days. But, a lot of Forex traders are gambling and don’t even think of taking delivery on the currency. 

    That is the point where tom next comes to the scene.

    If you open and close a position in the same business day, the value dates will be identical for every transaction. Your positions will not be carried over into the next day. Your payment has already been accomplished and will complete on the same value date.

    In currency trade, delivery happens two days after the date of the transaction. Tom next trade occurs because the majority of currency traders want their positions to be rolled-over daily. Their goal is not taking delivery.

    The purpose of tom next is to restrict traders from having to take delivery of currency and keep their forex positions open to the next day.

    Like stocks, forex trades end when the trader takes delivery of the asset. In forex, the delivery day is two days after any transaction. That is the spot date, but tom-next can be applied to prolong the trade after this date. So, the position will be extended by using tom next and you’ll be able to swap any overnight positions for an equal contract that begins the next day. The difference between these two arrangements is the tom next adjustment rate.

    So, this simultaneous transaction is a Forex swap. 

    Depending on what currency you hold, you’ll be charged or earn a premium. If you are holding high yielding currencies you will roll it over at a more pleasant rate (minimum is the best) because of the interest rate differential. This differential is the cost of “carry”. 

    For example, if two currencies have the same interest rates, they will be swapped at an identical rate. 

    If you choose not to roll over your position you will be forced to take delivery of that currency. Well, this is unusual, so the tom next transaction is basically the prolongation of your position.

    The policy of rolling a position over is more valuable in commodities trading. If it is not finished, you will be left with the delivery of the underlying assets. 

    Tom next what is it - explanation with examplesHow does it work?

    Your broker will swap or rollover your position for a new deal that starts the next day. The final result is an adjustment, higher or under, to the opening price for your position on the next day. You will see a tiny difference in the opening price from one day to another day.

    Your broker will debit or credit your trading account depending on the change in interest rate. Let’s say you are long with a currency with a higher interest rate.

    What your broker will do?

    Your broker may credit your account with interest payments. However, if you are long with a currency with a lower interest rate,  your broker will pay interest payments from your account.

    A tom next will not be applied if you close the position the same day before 17:00 EST. How? There is no overnight delivery involved.

    How do you calculate tom next?

    The calculation is based on the closing level of the former position, and the change in interest. Swap points plus any interest on your unrealized profit or loss will produce the change on your account.

    Rollovers that appear on Wednesday will have an added two days worth of interest. You know, for the weekends the banks are not working, so the broker will automatically credit or debit your account. 

    Tom next example

    For example, you are long USD/EUR at rollover and the average entry price is 120.00. In this case, you select to hold your position. Let’s say, just for the purpose of this example, the quote for the tom next swap points received from the bank is 0.025 – 0.012.

    What will happen? Do you remember, this is a simultaneous transaction?  

    A rollover, your broker will sell and buy USD, and at the same time buy and sell EUR. The final result is that you get a bid rate of 0.012 in your favor. The average price of your position will diminish by the number of Tom-next swap points.

    The  adjusted price of your position will be 

    120.00-0.012 =119.988

    Tom next adjustment is used to calculating the overnight funding charge on your trading position. You have to pay it if you want to keep your trade open for more than one business day.

    The rates can be changed on a daily basis because they are based on the underlying market price.

    If you want to buy a currency with a higher interest rate, you will get an interest payment. Hence, if you choose to buy a currency with a lower interest rate, you will pay interest. This payment is known as the cost of carry.


    You might also like:

    >>> Best Trading Strategy Without Indicators In Forex

    >>> How to Use Technical Indicators to Analyze Stocks?

    >>> MACD Indicator – Moving Average Convergence Divergence

    >>> Indicator Trading And How To Use It

    >>> P/E Ratio An Quick Method to Value a Stock


  • Short Selling For Profit

    Short Selling For Profit

    Short Selling For The Profit
    What to do with stocks when the price starts to decline? Bet that a stock will fall more.

    By Guy Avtalyon

    Short selling for profit is a trading strategy that attempts to profit from an expected decrease in the price of a security. Basically, a short-seller wants to sell at a higher price and buy at lower.

    How does short selling for profit work? 

    Let’s you are a trader and you have some information that some stock will decrease in value by the expiration date. Ofc, you don’t hold that stock but you can borrow it from a broker. For example, you borrow 100 stocks at $10 market price. And you open the position, meaning you want to sell them at market price by their expiration date. And you succeed. Then you close your short position and sell your borrowed stocks for $1,000. But before you give back that 100 stocks to your broker you are betting that their price will decrease in value before the expiration day. That happens. Now, you are buying these stocks at a lower price, it is called covering the short position. 

    Let’s say, the price of your borrowed stocks declines at $6 each. 

    You sold them at $1,000, bought them at $600. Return 100 stocks to the broker and you pocket $400.

    (100x$10) – (100x$6) = $400

    The risk in this kind of trading is literally unlimited because the price may rise and rise to infinity. 

    But, the profit can be huge, also. The previous example showed a short-selling for profit. Well, by using short selling you may gain loss too.

    Example of making loss while using short selling.

    The vice versa case is when stock price increase in value during the time while you are holding them.

    Let’s say their market price rose at $14 each and you are holding 1oo stocks. The equitation will be

    $1,000 – $1,400 = – $400

    You borrowed those stocks at a $10 market price. But despite your expectations, the price increased which means you made a wrong bet. But you have an obligation to return those to the broker, hence you have to buy them back at that higher price. In this transaction, your loss is $400.

    Short selling for profit is a method for traders to benefit from a drop in a stock’s price.

    Short selling is only possible by borrowing stocks. The problem is they are not always available because when they are you may be faced with a crowd of other traders that already massively trade them. 

    Is short selling for profit risky?

    The short-selling for profit can be risky and questionable. When a huge number of traders choose to short some stocks, their actions will make a great influence on the stock price. With such big traders’ interest, the price will decline sharply. That is not a good situation for companies. Their market value decreases. Sometimes the markets forbid short-selling, especially during the economic crisis.

    As I said, short selling is risky for plenty of reasons. You can make a great loss if the stock price increases instead to decrease.

    The other reason is that the sharp increase in selected stock may cause traders to cover the position all at once. Moreover, short-covering usually force the price to go up. Then you have a situation that more and more short-sellers are covering their positions and such stock is grasped in a so-called short squeeze. So, like a chain of unfortunate events, right?

    The main purpose of short selling for profit is when you borrow the stocks from the broker to sell them instantly and buy them back at a lower price. And return them to the broker. When the whole process is finished you should profit from the difference in stock price.

    Risks of short selling

    Short selling involves a magnified risk. When you buy a stock you can lose only the money that you have invested. For example, if you bought one share at $300, the maximum you could lose is $300. Stocks can fall to $0 and that is the maximum, there is no stock that may fall below zero. The maximum in your potential loss will stop at your initial capital invested.
    In short selling, you can potentially lose an infinite amount of money. Stock can increase its value for an infinite time to an inconstant price. So, you’ll have an infinite loss.
    For example, let’s say you enter a short-selling at $200, and suddenly the stock price increases by 300% to $800. You’re obliged to buy the stock back and return them at $800, essentially losing 400% of your capital. actually, you are in incredible debt.

    Just be careful when you bet against stock price.

  • Bitcoin dominance rate – Why some are concerned?

    Bitcoin dominance rate – Why some are concerned?

    Bitcoin dominance rate - Why some are concerned?
    Why this question about the Bitcoin dominance rate now?

    By Guy Avtalyon

    The bitcoin dominance rate is a very important indicator of crypto market preferences. It is the measure of how Bitcoin is important in the crypto world. To know the Bitcoin dominance rate observe its market cap as a percentage of the entire market cap for all cryptos. The traders and investors pay a lot of attention to it.

    Okay, it isn’t shocking news that Bitcoin is dominant. Everyone knows that. It is here for a long time, it was the first, it has attention like a rock-star.

    So, why this question about the Bitcoin dominance rate now? The alarms are a turned-on because of Bitcoin’s current climbing.

    In the crypto markets, it covers about 70% of the market cap as a whole. The same level was seen in April 2017.
    So, there we have a concern on the scene!

    Some are afraid that this is a sign that the bull run is close. That will accelerate bitcoin’s dominance to over 90%. The existence of any other crypto would be doubtful. That high dominance rate would destroy the others.

    The altcoins are on the edge of return, think others. Or no-return, the opponents are kidding. As always, when it comes to data interpretation you can see and hear literally everything and anything. But to be serious, the bitcoin dominance rate may show us many things. Even the increase isn’t always good news.

    Why increasing dominance rate isn’t good news? 

    Well, Bitcoin’s dominance rate is not an independent measure. It is related to momentum, inclination, confidence. In one word – popularity. Bitcoin is the most popular cryptocurrency without a doubt.


    The price of Bitcoin is the measure of its reputation. On the other hand, dominance is related to bitcoin’s relationship to other cryptos. There is one trick: the dominance may increase when the price is going down and vice versa. To repeat, it isn’t an absolute measure.

    Bitcoin’s high dominance

    It could be a double sword.

    Bitcoin is an extremely volatile asset and risky this attribute often led investors to less risky assets and, can we say, safer. But, on the other hand, thanks to its popularity the whole sector of crypto assets may benefit if there are more investors in Bitcoin.

    This new increasing Bitcoin dominance is proof that investors’ sentiment that this crypto is relatively safe to invest in.  The sentiment indicator is just a current opinion, be careful with that.

    How can you be sure the trend will continue? With what energy? What sentiments do is give power, to push things to go further, to build a chain of very convinced investors and traders who are buying bitcoin. 

    The added importance is market trust, particularly at the initial steps of institutional engagement.

    Big traditional funds are not worried about the relative value of one token related to another. Their consideration is their portfolio. They will decide what is better to invest in, crypto, or some other asset. Having that in mind, it is more likely they will invest in Bitcoin if they want to have crypto in their portfolios. 

    Why is that?

    Bitcoin has the liquidity, active derivatives market and is registered in most jurisdictions. With the rising dominance rate, Bitcoin has the opportunity to boost investors’ trust in the overall crypto market. 

    But nothing would last forever.

    Prior run-ups in the dominance rate were followed with a change altogether with investors’ attention to new choices. That is a calculation. When market leaders grow extremely, wise investors take profits and re-invest in other winning assets. The last bull market noticed bitcoin’s dominance decline from above 85% to under 40%. This time it is something else.

    How? During the previous bull market, we had plenty of new tokens. Where are they now? They are not exciting anymore? No, they are not existing anymore.

    Moreover, the interest of institutional investors with a focus on bitcoin will launch bitcoin’s dominance to jump even more.

    Stay tuned and keep your eye on what is happening behind the stage. Traders-Paradise has a fantastic example of how to MONETIZE BITCOIN

  • Don’t buy stocks on a dip

    Don’t buy stocks on a dip

    Don’t buy stocks on a dip
    Many say the strategy is to “buy a dip”, but can it really lead to success? There are so many opposing opinions.

    By Guy Avtalyon

    Don’t buy stocks on the dip says UBS Group AG. It is a Swiss multinational investment bank. While analysts at Goldman Sachs Securities Division advised: “Buy bitcoin on the dip” for stocks it is a straight way to a loss.

    “Buy the dip” was a good plan for the bull market, but analysts at UBS addressed to stock investors:

    “A world where leading indicators are accelerating is generally one where a correction in equities is an opportunity for investors and ‘buying the dip’ gets rewarded. In contrast, today’s backdrop with PMIs (purchasing managers indexes) in the low 50s and rates arguing for further declines often results in buying the dip being a losing proposition,” addressed strategists Francois Trahan and Samuel Blackman, in a Tuesday.

    This announcement is quite strange because dip buyers are still making a profit.


    The Dow Jones Industrial Average DJIA, +1.44%  increased more above 370 points Tuesday. This increment came after the U.S. said it would pause imposing tariffs on some imports from China.

    The S&P 500 SPX, +1.48%  climbed 1.5%. The Dow is depressed 2.2% for the month, and the S&P 500 is 1.8% below in comparison to the previous month.

    Trahan and Blackman have a different interpretation of the current market conditions.

    What is buying on a dip

    It is a losing proposition.

    They said the historical records covering the last nine economic cycles, reveals that buy-the-dip works the best when leading economic indicators, like PMIs (private mortgage insurance), are accelerating.

    The analysts said that buying-the-dip had a virtually excellent history. They call it the “risk-on” period. However, it is followed by the “risk-off” period. When PMIs fell under 50, labeled the “risk-aversion” period, dip-buying has poor benefits, they said. 

    Don’t buy stocks on a dip the analysts said

    They said that defining the period of the cycle is just one piece of a three-item checklist. They also explained the perfect risk-reward scenario. It happens when the “risk-on” period is followed by interest rates,  that carries an increase in the price/earnings ratio, so the earnings opportunity is promising.

    Today, the potential dip buyers are 0-for-3, they explained. In other words, we are witnesses of the “risk-off” period, but the companies earnings opportunity has declined.

    They also estimated interest rates.

    They were looking at yields with an 18-month lag.

    Their conclusion is: “the path laid by interest rates 18 months prior to today shows that there is now tightening in the pipeline, and it’s more likely we experience multiple contractions than expansion in the months ahead.” 

    Multiple expansion points the readiness of investors to pay more for a dollar of earnings. And they pointed out that the risk/reward for buying the dip “extremely poor”.

    As you can see, analysts from Investment bank Goldman Sachs has advised investors to capitalize on the new dip and buy bitcoin.

    The bank stated that its short-term target for bitcoin is $13,971. It also suggested to investors to buy Bitcoin on any dips in the current situation. But, don’t buy stocks on the dip, says UBS Group AG.

    There is a difference.

  • Buy bitcoin on a dip, it is an excellent opportunity

    Buy bitcoin on a dip, it is an excellent opportunity

    Buy bitcoin on a dip, advice Goldman Sachs.
    Why buy bitcoin on a dip, experts suggest that and my analysis shows that. Here you’ll find why it is a good long-term opportunity.

    By Guy Avtalyon

    Analysts from Investment bank Goldman Sachs has advised investors to capitalize on the new dip and buy bitcoin. The bank stated that its short-term target for bitcoin is $13,971. It also suggested to investors to buy Bitcoin on any dips in the current situation.

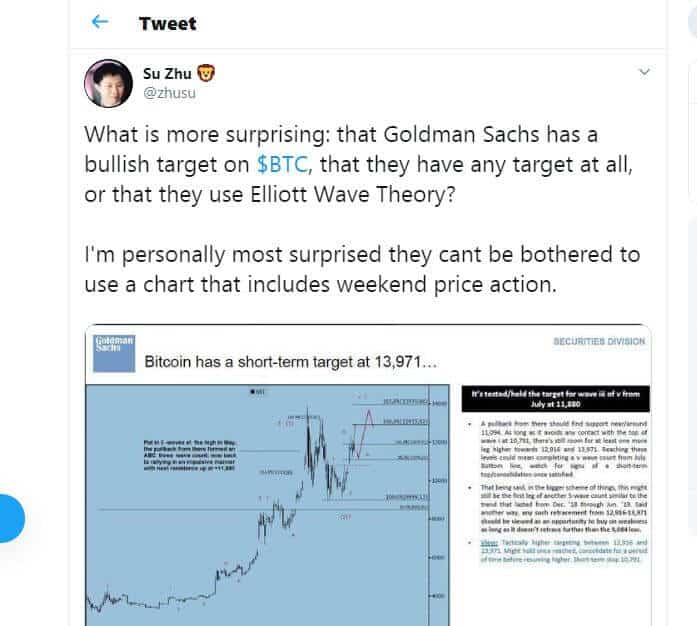
    This statement was provocative for Su Zhu, co-founder, and CEO at Three Arrows Capital. He tweeted: 

    Buy bitcoin on a dip, advice Goldman Sachs.

    The bank concludes based on its Elliott Wave analysis, bitcoin will have support around $11,094. Also, they founded a nice scope for a move higher to $12,916, then $13,971.

    “Any such retracement from $12,916-$13,971 should be viewed as an opportunity to buy on weakness as long as it doesn’t retrace further than the $9,084 low,” the statement declared.


    If Goldman Sachs’ analytics are correct, and their advice to buy bitcoin on a dip, we will see bitcoin recovered to 2019 highest level.

    Goldman Sachs’ analysis is based on the CloudMiningIndex (CMI) bitcoin futures market, meaning analysis didn’t cover weekend prices. Therefore, that were the gaps in the chart over the weekend at the time when futures markets are closed. If you are an individual investor you are free to neglect this advice. It is only for institutional investors.

    Applying Elliott Wave theory, Goldman predicts a short-term rise that could pop the previous highs in 2019.

    Buy bitcoin on a dip for long-term investment

    If you are or you plan to be a long-term investor, bitcoin shows a great buying opportunity at current prices. Goldman Sachs stated that any pullback under $13,000 is a sign to accumulate. The statement implies that if the price explodes once again it will be more valuable.

    “In the bigger scheme of things, this might still be the first leg of another 5-wave count similar to the trend that lasted from Dec ‘18 through June ’19.”

    We saw that in the first half of this year.

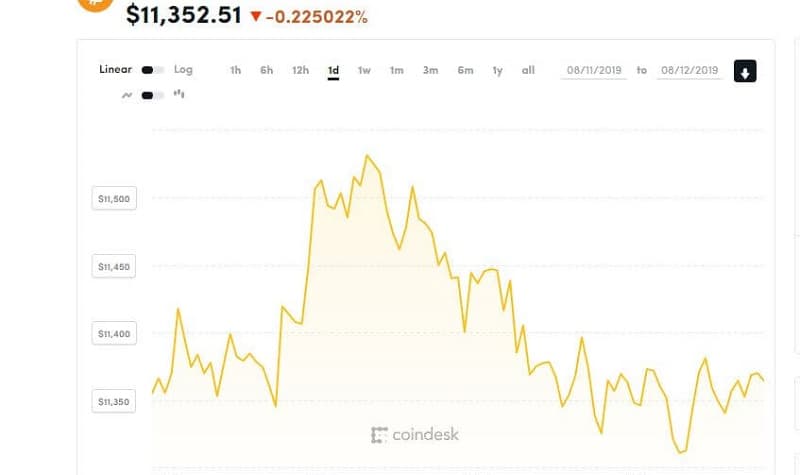
    Bitcoin already had such 30% pullbacks. To be honest, you will not profit at all if you buy a bitcoin during the bull market periods. Buying dips is not profitable for a long time ago. But Goldman’s suggestion pushed other analysts who claim that buying bitcoin in dip from fast runups is a good idea. Goldman stated that the price will hopefully strengthen again after  $13,971price and after that point, it will be pushed even higher. Bitcoin has confusing price action for several days until now. A break is above Wednesday’s high of $12,145 and that is needed to refresh the bullishness. On Tuesday Bitcoin hit a bid at $9,100 and grew to $12,325. 

    In the Asian market, the bitcoin price was $12,040 during the trading hours but felt below the $12,000 mark. On Friday it hit the fourth day in a row of bull failure over $12,000.

    The intraday highs of $12,325, $12,145, and $12,061 were on Tuesday, Wednesday and Thursday.

    Actually, bitcoin charts show lower highs above $12,000 and higher lows since Tuesday. That restricting price range is a sign of hesitation in the market.


    The consolidation is also a sign of bullish tiredness because it comes after a 35% price growth during the past eight days.

    Bitcoin could possibly proceed to consolidate to the end of August but also it can fall back to $10K. The price prediction isn’t quite possible because the market is still struggling at the resistance level. If bitcoin makes a break above the trend line that will be the sign of bigger movement, maybe higher than $15K to the end of this month.

  • Gordon Growth Model – Mathematics of Trading

    Gordon Growth Model – Mathematics of Trading

    5 min read

    Gordon Growth Model

    by Gorica Gligorijevic

    The Gordon Growth Model is useful to determine the intrinsic value of a stock and you will see how. It is all math.
    Anyone who wants to be a profitable trader has to know math. Profitable trading is not about feelings, or prophecy and stock advice or picks. It is all about math. Yes, the main goal is to earn money more than lose.

    But trading guessing is not a good idea. The math generates success and luck in your trading. Do you want to know how the math works in your attempts to profit and be a successful trader?

    If you want to act like a pro you have to be able to explain and make the math behind your trading. Anyway, you might benefit from understanding the math behind the stock market.

    At least, you have to know the basic calculations. 

    Traders-paradise wants to show you some simple to understand. It will help you to pick the right stock and keep your hopes of future returns more realistic.

    Let’s first determine the intrinsic value of stocks. How to do that? Just use of the Gordon Growth Model. Oh, yes. You will need more explanation.

    The Gordon Growth Model is known as the dividend discount model or DDM but without the current market stipulations, meaning the factors that influence the market, such as competitors, business challenges, etc.

    The point of this Gordon Growth model is to relate the current intrinsic value of stocks to the value of a stock’s future dividends. This is a very old model but still actual and popular. The equation shows that the long-term real return from the market should be almost equal to the inflation, modified by the compound yearly growth rate in dividends and increased by the current dividend yield. 

    Let’s view this complex definition in a simple example.

    The S&P 500 real growth rate in dividends has been around 1.3% per year over almost a hundred years. At the same period, the dividend yield was 5% annual. What you have to do is to sum these both. The sum you get is a bit less than actual 6,5% compound annual return from stocks for that period.

    This is defined by an almost doubling of the PE ratio, called a speculative return. That was exactly what did add the stock returns.

    Let’s see Gordon Growth Model and how to calculate it.

    As we said the value of a stock is shown as 

    Stock’s value = D1 / (k – g)

    where D1 represents the expected annual dividend per share for the next year k is the investor’s discount rate of return. You can estimate this using the Capital Asset Pricing Model, for example.

    and g is the anticipated dividend growth rate. We take this as a constant.

    When you have all these parameters, it is so easy to calculate the intrinsic value of the stock. For example, the S&P 500 dividend yield is about 2 %, 4.5% is how much you can expect dividends to grow due to the historical performances. So you can expect a long-run return at 6.5%.

    To show you how this model is true whether or not a company pays a dividend or reinvests it let’s show you this real example.

    Suppose your preferred company plans to pay a $2 dividend per share next year (D1). Also, you expect an increase of 10% per year following (g). Also, suppose you are expecting a rate of return on the stock to be 20% (k). Let’s say, the stock is trading at $20 per share now. Using the Gordon Growth formula, you can determine that the intrinsic value of one share of the stock is:

    $2.00/(0.20-0.10) = $20

    When you have all these parameters, it is so easy to calculate the intrinsic value of the stock. 

    You will very often find the Gordon Growth Model formula calculated:

    P = D1/(r-g)

    The stock price (P) is equal to the anticipated value of the dividend (D1) divided by the difference in the investor’s rate of return (r) minus the constant growth rate of the dividend (g).

    In essence, the Dividend Growth Model utilizes the investor’s required RoR and the dividend growth rate to calculate the value of the stock. 

    But dividends will increase at different percentages. For example, dividends will grow quickly and then reach a steady rate. The dividend is still supposed to be $2 per share next year, but dividends will progress yearly by 14%, then 20%, then 24%, and then stable rise by 10%.

    By using components of this formula, but examining every year the recent dividend growth individually, we can determine the current value of the stock.

    Following the inputs for our example Gordon Growth Model formula shows:

    D1 = $2.00
    k = 10%
    g1 (dividend growth rate, first year ) = 14%
    g2 (dividend growth rate, second year) = 20%
    g3 (dividend growth rate, third year) = 24%
    gn (dividend growth rate every year after) = 10%

    Let’s calculate the fair dividends for those years (we already find the dividend growth rate):

    D1 = $2.00
    D2 = $2.00 * 1,14= $2,28
    D3 = $2,28 * 1,20 = $2,74
    D4 = $2,74 * 1,24 = $3,40 

    The next step is to calculate the current value of every single dividend during the extraordinary growth period:

    $2,00 / (1,20) = $1.67
    $2,28 / (1,20)^2 = $1.58
    $2,74 / (1,20)^3 = $1.59
    $3,40 / (1,20)^4 = $1.64

    Now we can calculate the dividend in the year of stable growth of 10%:

    D5 = $3.40 * 1.10 = $3.74 

    Further, we can use the Gordon Growth Model’s formula to calculate the value of dividends in the 5th year:

    $3.74/(0.2-0.1) = $37.40

    This allows us to calculate the present value of the dividend’s growth in this 5th year, or how much that future growth is worth to us today:

    $37.40/(1.10)^5 = $23.22

    The final step is to calculate the current intrinsic value of stocks by summing up the present value of dividends in the first four years and the value of dividends in the fifth year.

    1.67+1.58+1.59+1.64+23.22=$29.7

    The main benefit of this formula is that it may cool down your emotions when trading. Calculating this can bring you down to the ground in growth periods, and also can support you when the market is falling.

    So, can the Gordon Growth Model’s formula predict the future market returns? In short, yes. 

    But the weakness of the Gordon growth model is its hypothesis that there will be a constant growth in dividends which is rare. So, you can use this formula for companies with stable growth rates.