Category: Traders’ Secrets


Traders’ Secrets is something that everyone would like to know, right?
How is it possible that some traders are successful all the time while others fail to make a profit all the time?
That is exactly what Traders’ Secrets will show you.
Traders-Paradise’s team reveal all trading and investing secrets to you, our visitors.

What will you find here?

How to find, buy, trade stocks, currencies, cryptos. You’ll find here what are the best strategies you can use, all with full explanation and examples.
Traders-Paradise gives you, our readers, this unique chance to uncover and fully understand everything and anything about trading and investing. The material presented here is originated from the experience of many executed trades, many mistakes made by traders and investors but written on the way that teaches you how to avoid these mistakes.

Moreover, here you’ll find some rare techniques and strategies that are successful forever, for any market condition. Also, how to trade with a little money and gain consistent returns. By following these posts you’ll e able to trade with greater success. You’ll increase your profits and your wealth, of course.

The main secret of Traders’ Secrets is that there shouldn’t be any secret for traders and investors. Rise up your trade by reading these posts, articles, and analyses!

You’ll enjoy every word written here. Moreover, after all, your trading and investing knowledge will be more extensive and effective.

Traders’ Secrets will arm you with those skills, so you’ll never have a losing trade again.

  • How to Calculate the Loss and Profit

    How to Calculate the Loss and Profit

    2 min read

    (Updated October 2021)

    How to Calculate the Loss and Profit

    It is always useful to discover the percentage rise or drop. That is called profit and loss.
    To calculate profit and loss we have to make clear some terms involved in the calculation.

    We will use the stock as an example. 

    * Cost Price ( CP): The price at which you buy a stock is the cost price. That is the amount paid for purchasing stock.

    * Selling price (SP): The Price at which you sell a stock is the sales price. That is the amount received when a stock is sold.

    * Profit (also the gain): You get a profit when you sell a stock at a price higher than its cost price. You will like to sell your stock at a higher price. CP < SP 

    * Loss: If you sell a stock at a price lower than buying price, then you caught a loss. CP > SP 

    The percentage of profit or loss is always calculated on the cost price.

    The formula for profit is

    Profit  = SP – CP  

    The formula for loss is

    Loss =  CP – SP

    Let’s calculate the percentage of loss and the percentage profit.  Percentage Loss and Percentage Profit are calculated based on CP 

    Profit% = (Profit/CP) × 100

    Loss% = (Loss/CP) × 100

    For example, one trader purchased a share of stocks for $1.000 and then sold it or $1.250. 

    What is the profit and profit in percentages? Is it 3%, 15%, 18%, 20%, 25%? 

    OK, this is basic. 

    The words “purchasing” or “buying” are indicated as CP, cost price.

    In our case, CP is $1,000.

    The trader sold the stock at $1.250.

    The word “sell” is indicated as SP, selling price. 

    In our case, SP is $1.250.

    We can easily find the profit. It is SP – CP, so

    profit = $1.250 – $1.000 = $250

    Don’t miss this What Is APY and How to Calculate it

    Now, we have to find the profit percentage.

    The formula is

    [(profit)/CPx100]

    so

    [(250/1000)x100] = 25%

    Our trader made a 25% profit in this transaction.

    But what would happen if our trader sold the stock at $800?

    CP is $1.000

    SP is $800

    loss = CP – SP

    loss = $1000 – $800 = $200

    or

    [(200/1000)x100] = 20%

    The trader’s loss is 20%.

    Calculate the Loss and Profit in Percentages

    • Divide the amount that you have profited on the investment by the amount invested. To calculate the profit, subtract from the price for which you sold the price that you initially paid for it.
    • Now that you have your profit, divide the profit by the initial amount of the investment.
    • The last step, multiply the number you got by 100 to see the percentage difference in the investment.

    If the percentage is negative,  you have lost on your trading. If the percentage is positive, you made a profit on your trade.

    By calculating the profit or loss you are actually estimating the change. Our calculation is based on the relationship between the selling price, and cost price. The difference shows if we are making a profit from the transaction or will we have a loss.

    You would like to READ: Gordon Growth Model – Mathematics of Trading


  • Limit Orders –  Use Them to Buy or Sell Stocks

    Limit Orders – Use Them to Buy or Sell Stocks

    3 min read

    Limit Orders - Use Them to Buy or Sell Stocks

    The limit orders are a type of orders in the stock market that lets traders to sets the wanted price at which they want to buy or sell the stock. In this way, the traders have more control for the execution of price, especially during the volatility. Possibility to specify their own price by using a limit order is a better choice than a market order. By using the market order traders can only choose the price but not to define it.

    A limit order can be modified until it is completed.

    It is intentionally practiced to get a guaranteed better price. So, it has to be put on the exact side of the market.

    Buy and Sell Limit Orders

    Buy limit order must be set at a price lower than the current market price. Hence, the sell limit order has to be set at a price higher than the current market price.

    For example, you want to buy 100 stocks, but you have a limit of $30 or below. If you want to sell that stocks at $35 that will not happen until the price of $35 is reached or it is more than $35.

    A limit order means that you want to sell or buy some stocks only at the price which you put in your limit order. 

    It differs from a market order because the market order fulfills your buy or sell transaction instantly despite the price. Honestly, sometimes brokers don’t like limit orders. Your limit order will have good treatment only if the price is the best ask or bid price and your stocks will be sold very fast. But, if it is not, well, you will wait to come to the top of your broker’s list.

    Some traders believe that limit orders have some defects but the others are convinced they are their best weapon. The most important feature of limit orders is that your order will be executed only at the price you placed, or better.

    How to place a trade

    How to Buy or Sell Stocks by using Limit Order

    Chart Image Source: StreetSmart EdgeÂź

    A limit order has five elements buy or sell as the first, number of shares, security, type of order and price.

    For instance, if you want to buy 100 shares of stock and you want to pay $35 each. Your limit buy order would be expressed as –  Buy 100 shares (ticker symbol should be added) limit $35.

    This order indicates the market that you want to buy 100 shares, but without a doubt, you will not pay more than $35 per share.

    The benefit of the limit orders is that your order will not be filled above the price you set but the price may drop and you can pay your shares at a cheaper price, lower than $35 as you placed. So, you see, the limit orders are not fixed orders.

    The same thing comes for a limit sell order. When you open a limit sell order for $35, your stock will not be traded for less than the amount you set per share. When the stock grows over the set price before your order is fulfilled, you may earn more because the stocks you want to sell reached a higher price before the transaction was executed.

    You will need the experience to recognize where to set limit orders. First, never set limit buy order too low. Why is that, you don’t have money? If you do that who will sell you the stock at that too low price? In that case, your order will never be filled. 

    The point of using limit orders is to protect yourself from buying a stock at too high or selling at a too low price. Keep in your mind, if the stock’s price never meets your limit price, your trade will not be executed.

    The limit order could be a problem if you don’t pay attention to the market. 

    Here is a strategy, not very creative, but works.

    Let’s say you placed a sell limit order at $3 over the market price. At the same time, you set a buy limit order at $3 under the market price. You will make a profit in any scenario.

    But what if the price jumps for $10 per share?

    Sadly, you missed the additional $7. Can you assume the opposite of this situation? The stock fell and your buy limit order was fulfilled as the stock was in a drop.

    Limit orders are wonderful tools, but they are not absolutely sure-fire. In a volatile market, limit orders may be painful due to the possibility to be executed too soon.

    The best way is to set a limit order that is not connected to daily price changes. The point is to have even minimum control over the price.

  • Stop-loss Order Means How Much Are You Willing to Lose On a Trade

    Stop-loss Order Means How Much Are You Willing to Lose On a Trade

    Stop-Loss orders To Limit A Risk
    Stop-loss order is an easy and powerful tool when used properly. Find how to do that.

    By Guy Avtalyon

    Stop-Loss orders are suitable when conditions in the market get a bit out of control. If you never place the stop-loss order the risk potential is huge. You may lose everything. 

    The main characteristic of a stop-loss order is that it becomes a market order. It can happen when the price of your security is selling at or under the stop price. So, a stop-loss order is a great protection against falls in the value of your stock. Stock investing is risky, but you can control it and protect it with a stop-loss order. Wise investors always use stops. The others stay with losses. The stop-loss is an easy but powerful tool that will protect you when an unexpected turn in the market occurs.

    How does Stop-loss Order work?

    For example, you hold a stock of some company and it is currently trading at $30. But your stock is volatile and you place a stop-loss order at $20. If the price of your stock drop at or below $20, your order will become a market order and you’ll be able to sell your stock instantly at the best possible price.

    If you want to be a day trader, for example, you have to place a stop-loss order on your every trade. The stop-loss order will tell you how much you can lose on a trade. So, you have to know how to calculate your stop loss. You have to determine precisely where your stop-loss order will go.

    Basically, a stop-loss order is a method of investment risk management.

    A stop-loss order is when you define a particular step to be taken at a particular price. For example, you bought a stock at $50 and you placed a stop-loss order at $40. This means your stock will be sold when the price drop to $40. Of course, you may place the stop-loss order at any price. 

    But not all is ideal with this order.

    Stop-loss orders are static. They don’t move. Imagine the following situation. You set a stop-loss order at $40 but the stock price goes up at $80, which is much more than you bought it. In this case, when your stop-loss order is at $40 your protection is worthless. 

    How to calculate stop-loss?

    A stop-loss order is created to reduce your loss. For example, if you place a stop-loss order for 15% below the original purchase price, your potential loss will be limited to15%. For instance, you bought a stock at $100. What you have to do is to set a stop-loss immediately after buying and you set it at $85. This is important in case the price of your stock falls below $85. Your stop-loss will automatically be recognized as market price and even if the stock continues to fall, you will obtain your $85 per stock or the amount close to it.

    You may choose whatever percentage you want, all is up to you.


    Some advisors will tell you to set a stop-loss order at 10%. But if you think your stock is a good player you may decide to take more risk and set a stop-loss at 20, 30, or even 50%. For long-term investors, this may be a good solution, the bigger percentage will give space to the range and enough time to annulate the losses that can occur over time because they have a bigger investment horizon and have hope for a great return one day.

    But if you are a day trader just avoid big percentage, 10% of the initial price is quite a good solution to protect your trade.

    Defining a stop-loss order placing is all about targeting an individual risk potential. You should determine this price to limit loss. That’s the point.

    How to place stop-loss orders when trading

    Stop-loss orders are usually market orders, as we said. But if your stock doesn’t have a buyer at that price you may end with a lower price. That is slippage. 

    Stop-loss points shouldn’t be set at unplanned positions. Placing them is a strategy that should be based on your experience with different methods. This means you must have a trading plan. You have to know how to find the best way to enter the trade, how to control the risk, and how and when to exit the trade.

    If you are a beginner, just use a simple stop-loss strategy. That will give you the opportunity for the price to move in your benefit. Also, the simple stop-loss strategy will diminish your loss promptly if the price goes against you.

    Where to set stop-loss orders when buying


    One of the easiest ways is to set it below a swing low. A swing low happens when the price drops and then hops. That is the price support at some level.
    When you buy, the swing lows should be going upward. 

    Where to set a stop-loss order when selling


    Set it above a swing high. A swing high happens when the price grows and then drops. That is resistance.
    If you want short selling the swing highs should be going downward. 

    What is important with stop-loss orders

    There are several things you have to know about stop-loss orders.
    They are not suitable for dynamic traders and large chunks of stock because you can lose more in the long run.
    You must be sure that your stop-loss order has confirmation, never assume.

  • What Is EMA in Stock Trading?

    What Is EMA in Stock Trading?

    5 min read

    EMA in stock trading

    by Gorica Gligorijevic

    EMA in stock trading is a tool for tracking the progress of stock prices. Term EMA is actually the exponential moving average.

    Moving average should be one of the crucial parts of your education as a stock trader. But EMA differs from simple MA.

    EMA is created from an easy mathematical equation. Nevertheless, it is one of the most valuable and relevant chart indicators. By using EMA in stock trading you can easily recognize buy and sell signals and build an individual technical stocks trading method.

    EMA is related to historical data of closing prices. The information given by EMA is extremely helpful because those data provide you to determine trends and find future price action. EMA is a data point.

    Since EMA is moving average, let us evaluating Moving Averages.

    It is easy to find a simple moving average or SMA. All you have to do is to sum all closing prices in some period, for example, 10-days. That number now, divide by 10. The result is SMA.

    Also, you can use the chart and add changes in every single trade every day. After, in our case 10 days,  will show you the trend in the average closing price. The SMA line trending upward shows stock is rallying, and vice versa, the SMA line trending downward, shows a stock falling in prices.

    Exactly, the EMA shows the current price trend. 

    EMA in stock trading


    The longer the period covered by the EMA, the lower the relative weighting for recent trading.

    EMA chart lines such as 10-days can be used to simply see stock price trends. The slope of the EMA line will show you if the stock is in an up or downtrend. One interesting image may appear in the chart, it is the cross. When the price hits an EMA line and passes it, you can recognize the cross. That is the sign of a reversal trend.

     EMA line for a short period as in our example is, can tell when the trend is changing. The other EMA lines for 50-days or 200-days periods shows resistance and support levels for the stock price.

    How to use EMA for trading strategy?

    By drawing EMA and SMA on the chart, you can detect a potential shift in a stock price. If you notice the EMA line crosses over SMA line you can be sure the price is reversing from the current trend. Moreover, SMA will show you the support level and resistance level.

    To remind you, the support level is the point when the price is falling, and the resistance level is the point where the price starts to rise.

    The best moment to enter the trade is just when the price breaks the trend line or bounces against it and reverses. These points are made by crossing the EMA line and that is the reason why EMA is called a data point.

    How to calculate the EMA

    First, measure the SMA over an appropriate time period. It is the total of the stock’s closing price divided by the same number of periods. For example, a 10-day SMA is simply the amount of the closing prices for the last 10 trading days, divided by 10.

    The formula is 

    SMA = (N−period sum) / N

    N is the number of days in a specified period

    the sum represents the sum of stock closing prices in the observed period

    ​Further is somehow more complicated but not impossible :).

    Calculate the multiplier for weighting the EMA. 

    The weighted multiplier is calculated as 

    2Ă·(selected time period+1)

    2Ă·(10+1) = 0.1818 which is 18.18% in percentages.

    [2 Ă· (selected time period + 1)]

    or

    [2/(10+1)]= 0.1818

    And the last step. To calculate the EMA, use this formula

     [Closing price-EMA (prior day)] x multiplier + EMA (prior day)

    Let’s calculate the EMA in stock trading:

    EMA=Price(t)×k+EMA(y)×(1−k)

    The legend:

    t – today

    y – yesterday

    N – number of days in EMA

    k – 2Ă·(N+1)

    Bottom line

    Due to different trading strategies, underlying security, and traders affinities, you can find different types of moving averages. But one thing is sure, EMA is extremely popular because it gives more power to current prices, and has more advantages than other averages.

    EMA relies entirely on historical data. Some economists think that market prices carry all information. According to them, we don’t need EMA because the historical data will tell us nothing about the price movements in the future.  Also, there is the question of where to put more attention. On the current data or past data. Some traders think that fresh data quite good match the current trends.

    But one thing is sure: EMA is popular. If it cannot provide a good result, why traders would use it.

    • Chart source: TradingView
  • Take Profit Order – Limit Your Risk

    Take Profit Order – Limit Your Risk

    3 min read

    Take Profit Order

    Take Profit order or shorter TP is extremely essential element in all tradings. How to place the Take profit order? The question of how to place stop-loss order is one and those two are related and connected.
    So we have to make some distinctions.

    Stop-loss order linked to the risk when you take a position.

    Take profit is related to the gain for your open position.

    Both of these elements form what we call – money management. We told you about Stop-Loss in the prior posts. In case you missed it, you can read it HERE or HERE.

    But let’s stay awhile with the definition of “Take Profit” order.

    Take Profit order is a limit order. Traders use it to close a position when the market touches a specific price level. To be more clear. Take profit represents the reward that a trader planned before taking a position. Take Profit order has to follow, must go in the same direction as the market. The trader is free to define the level of reward depending on his/her feeling of how much risk is taken to obtain adequate profit.

    Take Profit order is similar to Stop Loss order, meaning, it is an exit order. Yet,  Stop Loss order will limit your loss on a trade, but Take Profit means a price at which a successful trade will be automatically closed. To make this simpler – Take Profit is your profit target. That is the reason why you always have to set Take Profit order at the level you are expecting the price will catch. When you buy, for example, a stock, your Take Profit order must be higher than the current price. But if you are selling a stock, your Take Profit order should be below the current price.

    Yes, we know you have an excellent idea. 

    But do you know how to place a Take Profit order? 

    If you do it wrong, you will not make a sufficient profit.

    Levels of resistance and support will help you to place a proper TP. This strategy is the most successful and we will show you why.

    Take Profit Order

    First, locate a resistance level in your chart. Then place a Take Profit order a bit below the resistance. In this way, when you place TP under the resistance level, you will increase your chances to match the level that the price will hit. The next step is simple, just close your position and make a profit. This profit will always be higher.

    This is in case you notice an upward trend. But if you notice a downward trend, you have to determine a support level.

    In that case, TP has to be a bit over the support.

    Contrary to the situation with resistance, a TP level should be a bit over the support.

    Experienced traders have some TP tips. One of them is that the TP must be 2 or 3 times of the SL value. But this advice is doubtful. You have to consider more indicators, not just one. If you are trading Forex, this strategy will work for you.

    But if you are trading stocks some other rules are more convenient.

    You will make the most gains in the 20%-25% range.

    If you see a notable increase of 20% to 25% – sell.

    Why this 20%-25% range?

    Stocks tend to rise 20% to 25% after breaking out the support, then fail and set up new support. Sometimes this game resumes their progress.

    In Traders-Paradise’s Full Trading & Investing Course – Secrets Revealed

    (don’t forget to subscribe while it is free of charge, the time is limited) you find a fantastic lesson about the rules and among them an explanation of the Rule of 72.

    Following Rule 72 you can easily calculate why the 20% to 25% is adequate Profit take range.

    How to calculate?

    Divide 72 by the percentage gain you have in stock. The result will show you how many times you have to compound that gain to double your capital. Let’s say you get 3. Re-invest your capital plus gains 3 times. You will double your money easier than to make 100% profit from one stock. The net profit will be greater. But as we mentioned, you have this all and detailed explained in Traders-Paradise’s Full Trading & Investing Course – Secrets Revealed

    Why place a Profit Target?

    Determining where to exit before trade begins allows you to calculate the risk/reward ratio.

    The stop-loss defines the possible loss on a trade. But the profit target defines the possible profit. Logically, the possible reward should exceed the risk. 

    By trading with a profit target, it is possible to estimate whether a trade is worth taking. If the profit potential doesn’t exceed the risk, don’t take a trade. By establishing a profit target you can eliminate weak trades.

  • The Stock Market prediction Is Possible or Not?

    The Stock Market prediction Is Possible or Not?

    The Stock Market prediction Is Possible or Not?
    Everyone would like to know everything about this

    By Guy Avtalyon

    Stock market prediction is the intention since the beginning of the stock market. The reason is clear. Every single participant in the stock market aims to gain huge or decent returns and to avoid losses. Sounds logical, indeed. In early days traders and investors were just guessing, to say it simply. Well, frankly, not just guessing. There were some estimations, judgments, listening to the rumors, asking. But today, traders and investors may employ different tools, machine learnings, and AIs to help them in stock market predictions. 

    Is the stock market prediction possible or not? 

    We already learn that past performances can’t show future trends. But is this truth 100%?

    Of course not.

    Watching past performances can help you with a high level of certainty to predict how some stock will act in the future. This is very important because based on that data you will determine and decide what to do with some stocks. Would you buy or sell, would you stay on position or leave.

    The modern stock market prediction is often based on machine learnings and AI technologies varying from very simple to complex ones. Those stock market prediction tools or techniques, whatever would you like to call them may help you a lot to secure your investments. Even the simplest can give you an insight into the future stock market trends. 

    Using robust algorithms has benefits, of course. But not every trader or investor can afford them. Some are very expensive and the result is very often almost the same if you use the simple version or some simple tool.  

    The crucial thing about stock market prediction is to have quite enough historical data to be able to make a conclusion, to have a basic sense of some stock’s nature.

    How to predict the stock market movements?

    The relationship between supply and demand is what dictates the stock price. And this works very simply. If there is in the market more sellers, that means the supply is greater than demand, so the price will decrease. And vice versa. That is the easy part of the stock market. Things become more complicated when you try to understand why some investors like one stock more than the other. But that is another question. We want to know is the stock market prediction possible or not.

    The algos, tools, learning machines deliver their predictions based on historical data. This means that all of them show the prior values of some stock and based on that give the future estimation of stock price action. 


    And that is exactly what you need as an investor. To get some info with the highest level of possibility on how some stock will perform in the future. To have that kind of info you don’t need to spend a fortune. Some simple tools may benefit you too. Such a tool must have historical data about prior performances, for some limited time, for example during one year. Based on that info you will be able to check your trading or investing strategy. And that is crucial. The possibility to check your strategy on your own and not to put all in the “hands” of some algorithm, because we want to be honest with you, algos can make fails. Algos, as like your trading strategy, depends on inputs that some other implemented in it. To say simpler, it is based on other people’s knowledge about the stock market prediction and investor expectations.

    Le’s check one example. Let’s say you have a strategy and you want to check how it works on a particular stock.

    How efficient your strategy is?

    If it shows your strategy isn’t good you can easily change the strategy or test it on some other stock. Moreover, the possibility to test different strategies on numerous stocks is extremely important when it comes to choosing the stock to invest in or strategy to employ. What is the main point of trading? To gain a nice return. And how to provide that? You have to find the best possible to take a profit point and stop-loss point.  

    Based on the info you can obtain from such a tool you can easily decide about your future trading. 

    Very simple and very helpful, don’t you think? 

    What Traders-Paradise wants to say is just stay tuned.

  • The value of investments is falling – What to do?

    The value of investments is falling – What to do?

    The value of investments is falling - What to do?
    This can be a big issue, try not to panic, and follow these steps to protect your capital invested.

    by Gorica Gligorijevic

    The value of investments is falling and you are worried. Don’t be, it’s normal from time to time but also, you may profit from it. Let me explain this.

    In stock investing, you have to respect a few general facts. You may face the value of investments fall, as first. What you have to do? To find the reason behind. When you determine the reason you will have a powerful weapon in your hands: you will be able to decide should you sell or hold your stocks. Moreover, you’ll be able to buy a new stock of shares. Well, you can see it isn’t the end of the world. Just think about other opportunities and try not to panic.

    Put your emotions aside and turn on your brain. Your investments are not your sweetheart.

    So, when (notice there is nor “IF”) the value of investments falls, don’t jump immediately to sell them. Yes, the news comes, but just stay cool because it can be temporary. Do you know how many investors lost their fortune reacting impulsively?

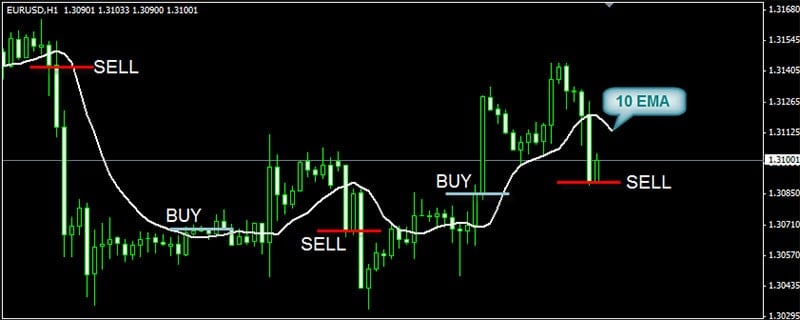
    It is painful to watch at stocks are falling in price, that’s true. But take a closer look at historical data of stock you hold. Maybe you can notice some patterns. When and why their value has had fallen before? 

    When the value of investments is falling, identify the pattern

    Yes, it is very important to identify the pattern. 

    Past performances don’t guarantee the future behave but at some point, you will figure out the causality. Most stocks respond to market movements in a logical pattern. And you’ll be ready for the next move. 

    Besides, just looking at the charts can make you more nervous. You must have more information. You must have a clear picture of how the whole industry is performing. Industry in which your beneficial company is working, of course. You are holding its stocks and you have to know something about the sector it is working on. What is about the overall market appearance, what is happening there? Is the market volatile maybe? Moreover, did you read at least one quarterly report from the company whose stocks you hold?


    The value of investments is falling don’t get panicked

    Okay, let’s talk about this a bit more. Let’s assume you have all the info. So, what would you do with this?

    The key is to recognize what forces the value of your investments to fall. If you cannot identify the reason behind, you should exit your position.

    Sometimes the gap in the market can cause the value of investments to fall. Or it can happen due to the market’s weakness. If you find this case, you should stay in a position. It isn’t rocket science, it is just market: supply and demand relationship. If you are on the market it is reasonable to have a diversified portfolio, right? This is very important, especially in today’s market. A diversified portfolio will produce a positive return to you. But more importantly, it will allow you to have a return higher than the inflation rate is. So, if you are a long-term investor, just stay cool when the value of investments is falling. Your investment horizon is what is really important. 

    Temporary drops shouldn’t concern you. 

    The question is, what is the main goal of any investing strategy? To gain returns bigger than the overall market for some level of risk. It is always a good concept to check how the performance of your stock is in comparison to the overall market. 

    But what if the value of investments is falling suddenly and it different from past performances? The company is still good as it was when you bought your stock! Think! Maybe the reason for the value of investments falling is exactly there. The company is too good and maybe many investors are willing to buy a stake of its shares. If you are not among them, leave your position and invest in some other company.

  • Who Is The Richest Person That Ever Lived?

    Who Is The Richest Person That Ever Lived?

    the richest person ever lived
    It is always an intriguing question. Here is what Traders-Paradise found.

    By Gorica Gligorijevic

    Some of you may think that Bill Gates is the richest person ever lived. Well, he is one of the richest today with $77.8 billion. Also, there was much fanfare when Amazon boss Jeff Bezos was marked as the wealthiest person ever lived with his $105.1 billion fortune. But it is a small part of what some other man held.
    That title is assumed to go to Mansa Musa. Who is Mansa Musa? 

    He was a West African ruler with wealth valued at $400 billion. This isn’t a fairytale and you will see why.  

    “Contemporary accounts of Musa’s wealth are so breathless that it’s almost impossible to get a sense of just how wealthy and powerful he truly was,” Rudolph Butch Ware, associate professor of history at the University of California, said the BBC.

    And Jacob Davidson wrote about the African king for Money.com in 2015  Musa was “richer than anyone could describe”.

    Do you know who were the greatest stock traders of all time

    Why Mansa Musa is the richest person that ever lived?

    His wealth is estimated at $400bn, but historians admit that his wealth is difficult to pin down to a number. That’s how huge it was.

    Mansa Musa was born in 1280 in a family of rulers.  His brother, Mansa Abu-Bakr, ruled the empire until 1312 when he abdicated and went on an expedition with a fleet of 2,000 ships and never returned.

    Mansa Musa inherited the kingdom of Mali. He was an impressive ruler. 

    The kingdom of Mali was from the Atlantic Ocean to Niger, with parts of Senegal, Ivory Coast, Mauritania, Mali, Niger, the Gambia, Guinea-Bissau, Burkina Faso, Guinea covering almost 2,000 miles. That large landmass gave great resources, for example, gold and salt.

    According to the British Museum, under Mansa Musa ruling, Mali possessed almost half of the Old World’s gold. And everything belonged to the king.

    “As the ruler, Mansa Musa had almost unlimited access to the most highly valued source of wealth in the medieval world,” said Kathleen Bickford Berzock, who specializes in African art at the Block Museum of Art at Northwestern University, to the BBC.

    “Major trading centers that traded in gold and other goods were also in his territory, and he garnered wealth from this trade,” she figured.

    The empire of Mali had so much gold that Musa was the world’s greatest gold producer and seller. 

    Who was Mansa Musa?

    To meet one of the five pillars of Islam, Mansa Musa made a pilgrimage to Mecca. This adventure cost huge amounts of cash. This “Lord of the Mines of Wangara” had to travel stylish and luxurious. The 60,000 big caravans had 1,000 helpers, 100 camels with gold packages, countless musicians for Musa to enjoy, and more than 500 slaves.

    Mansa Musa came back from Mecca bringing several Islamic teachers. Among them were direct descendants of the prophet Muhammad, for example, and an Andalusian poet and architect, Abu Es Haq es Saheli, who designed the famous Djinguereber mosque. Musa allegedly paid the poet 200 kg in gold. Counted today, it is about $8.2 million.

    Besides his legacy, Musa’s property is estimated to be worth an inconceivable amount, to around $400 billion. According to Time magazine: “There’s really no way to put an accurate number on his wealth.” 

    Some believe that Mansa Musa’s unbelievable fortune may have been somewhat overstated. Nevermind, he is still the richest person that ever lived.

    Don’t tell to the Rothschild Family.

  • Spelling Errors Cost Investors Millions Every Year

    Spelling Errors Cost Investors Millions Every Year

    Spelling errors cost investors millions
    Is really possible that spelling errors can cost investors millions? Here is the full story.

    By Guy Avtalyon

    You entered the stock market but still make mistakes. This time spelling errors. Okay, you are not the only one. Spelling errors cost investors millions every year. re you happy now? Of course not. 

    As we said billion times when you enter the stock market you have to be very aware of which company you want to invest in. What Traders-Paradise wanted was to present you with a wonderful world of investment. And you can find a lot of articles that we offered numerous examples, from how to choose the broker to how to calculate your profit. A lot of times we tried to teach you how to check the company in the market. And how important their ticker symbols are.

    What we saw is that you invested in FORD! 

    WOW, good choice indeed. But did you really want to invest in “Forward Industries” or “Ford motor”?

    Under this ticker symbol, FORD is “Forward Industries” not the car company. What, you already invested there? You should be more careful. Ford motor is under the ticker (F), just F.

    Take care of it because Ford Motor will publish its Q3 earnings on October 24th. 

    Why investors are losing millions every year?

    If you did invest in FORD, the only problem is that you invested in a manufacturer of “carrying cases for medical monitoring systems”  worth $10 million, so don’t expect too much from them. Experts calculated that this error costs investors about one million in trading only for the fees. 

    Where is the lower or lost return? Can you calculate that?

    A lot of those investors usually don’t even correct this mistake until it is too late. They still think they made a good investment until they see in the quarter or annual reports. Some of them notice the error several days after and try to sell their stocks, but is the game with poor results. Actually, it is very rare they can bring the invested money back.

    So, let’s see again where you can make similar errors?

    For example HP. Do you really think it is a giant company, Hewlett Packard? Nope! It is the ticker symbol for Helmerich & Payne. You are free to check their official website:

    “H&P is the leading U.S. unconventional driller, and our drilling experience spans the globe. Our company currently owns and operates land rigs across North America, South America, the Middle East, and Africa, with offshore rigs in the Gulf of Mexico.”

    Do you still want to invest there instead of Hewlett Packard, it trades under (HPQ)?

    Also, Hewlett Packard Enterprises, you will find under (HPE).

    Would you like to invest in ZOOM? Yes? That is another mistake. It is an unclear Chinese wireless business. We suppose you wanted to invest in ZM which is $25 billion worth video conferencing platform.

    Spelling errors cost investors millions 

    For example, you want to invest in Twitter. What is their market ticker symbol? TWTR or TWTRQ? Don’t invest in TWTRQ, it bankrupted. Yes, several years ago, in only one year, during 2013, it’s stock rose1000%. What a market star! But a shooting star. There is no more this home entertainment retailer. 

    But TWTR is still there ready for you to invest in. 

    There are more.

    Two professors at the Rutgers School of Business-Camden discovered that over half of listed US companies deal with a “meaningful part” of their tickers with a different company. 

    It can be in a different industry and, also, with huge differences in market capitalization. Those professors found almost 250 so-called, company pairs that can lead you to wrong decisions. Professors claimed, “250 company pairs where the possibility of confusion is particularly high.”

    For example R1 RCM (RCM) vs RCM Technologies (RCMT) where market cap difference is 3,215%

    The problem appeared due to a phenomenon known as “fat finger trades.” 

    So, take care, avoid spelling errors that cost you a lot of your hard-earned money.

    Also, the robo advisor can make mistakes. Yes, of course. The inputs are given by the people and the people make mistakes. The algorithm will follow inputs without the question. You can be sure.

    What we want from you is to “spellcheck” your investments. Proofread the tickers from your preferable company and make corrections on time.

  • How is Beyonce as an Investor – Celebrity Investors

    How is Beyonce as an Investor – Celebrity Investors

    2 min read

    Beyonce as an Investor
    Beyonce Knowles-Carter

    Beyonce Knowles-Carter is a singer. But, also, she is a worldwide brand. You can find her name on fashion marks, cosmetic industries, and Pepsi commercials.

    Her career began with girl-group Destiny’s Child and her destiny is incredible. Beyonce became one of the most popular singers in the world. She earned 23 Grammy awards. Also known under the nickname, Queen Bey.
    She is a businesswoman too. Beyonce owns a strong portfolio of real estate in the US and all over the globe. Most of them she owns in partnership with Jay-Z, her life partner. But some investments she holds by her own. 

    Beyonce invested in tech.

    Just like Ashton Kutcher, Queen Bey is interested in the tech world. BeyoncĂ© started the management company Parkwood Entertainment that have invested $150,000 into Sidestep. It is an app for purchasing concert merchandise. In the beginning, Sidestep was selling t-shirts and posters for Queen Bey. After some time, when Beyonce saw its profit and potential, she invested in Sidestep. According to Sidestep’s CEO Eric Jones, the idea of “a tiny scrappy startup doing the biggest tour in the world” was great.

    That was the first step as an investor

    Then, 2015. Uber came with an offer of $6million to perform on the company’s event in Las Vegas. But Beyonce had an offer too. Instead of cash, she asked to be paid in Uber’s shares. After Uber went public that $6 million were turned into to profit $300 million from her shares. 

    Beyonce isn’t the only celebrity who invested in this company before it got in IPO. 

    Apart from profits in the musical industry, Beyonce surely recognizes the point of diversifying her investment portfolio. Her investments are also in Dereon Clothing, deals from General Mills, L’Oreal DirecTV, Pepsi, Samsung, Ford, American Express, etc. Queen Bey released: “I have a lot of property. I’ve invested my money and I don’t have to make any more, because I’m set. I’m now able really to be free and just do things that make me happy.”

    Beyonce as an investor, not only as a singer or actress, proved that she is not just a hype. 

    Together with Jay-Z, she is part of Hip Hop’s first billionaire couple into several investments, revenue, and endorsements.

    Beyonce as investor thinks ahead 

    She made about $4 million from the 2018 Coachella Valley Music and Arts Festival. She was the first African-American woman to headline the festival. Her performances were a tribute to the culture of black colleges and universities but also inspired by black feminism.

    She also signed a $60 million worth deal with Netflix which brought Homecoming, a documentary about that show.

    Beyonce supported to start a vegan food company 22 Day Nutrition. She’s also a stockholder in streaming service Tidal.

    Queen Bey is widely recognized as a smart business icon. She has earned hundreds of millions of dollars with conservative investments. And she spends her money on extravagant gifts like Bugatti Veyron Grand, private jet, $88 million purchase of a Bel Air mansion, etc. She earns, she spends.

    Musicians aspiring to get rich off royalties are fooling themselves. The real money comes from smart investing. 

    Beyonce Knowles-Carter is a smart investor.