2 min read
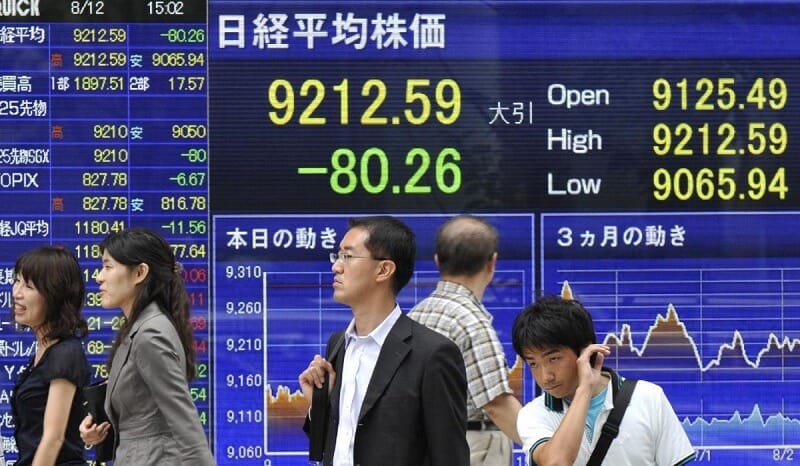
- Asian stock markets recorded substantial increases
Asian stock markets carefully raised in early trading Monday. The previous week was volatile for overall markets because the U.S.-China trade tensions escalated.
According to Goldman Sachs, a trade deal is pretty much impossible before the 2020 US presidential election. This US multinational investment bank cautioned that the open-ended trade war has a bigger influence on the U.S. economy than expected. In a letter to investors, this bank lowered its growth forecast for the market movements. Also, it warned the risk of recession is growing. The reason behind is the companies are reducing spending which is, of course, caused by trade-war risks.
Yesterday, 11/08/2019 Monday, China’s central bank set the yuan lower than 7 per U.S. dollar. The value is the same for the past three days. The People’s Bank of China set the currency’s reference limit at 7.0211 per dollar. That is lower than the level on Friday. The analysts had expected an even lower point.
According to MarketWatch:
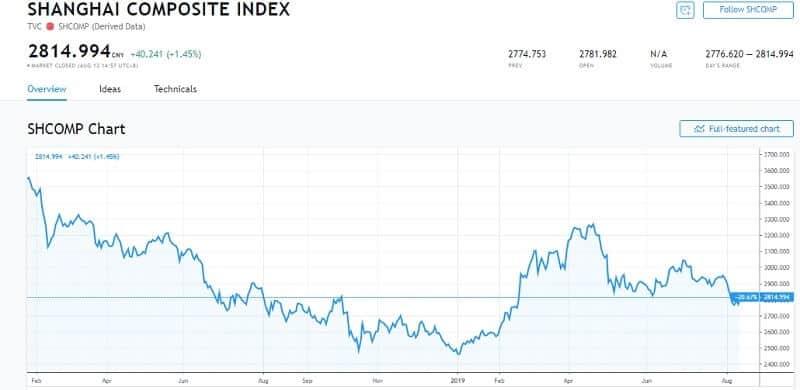
“Hong Kong’s Hang Seng Index HSI, -0.18% gave up early gains and was last about flat, while the Shanghai Composite SHCOMP, +1.45% gained 0.7%. South Korea’s Kospi 180721, +0.23% advanced 0.4%, while Taiwan’s TaiexY9999, -0.21% was about flat and Indonesia’s JSX Composite JAKIDX, -0.40% declined slightly. Australia’s S&P/ASX 200 XJO, +0.09% was little changed. Markets in Japan and Singapore were closed for holidays.”
Some individual stocks like Sunny Optical and Tencent raised in Hong Kong, but HSBC 5 fell. Samsung and SK Hynix increased in South Korea, in contrast to Rio Tinto that slipped in Australia.
President Donald Trump statement
The increases in Chinese stocks followed the U.S. President Donald Trump statement on Friday that he is “not ready to make a deal.”
“China wants to do something, but I’m not doing anything yet,” Trump told Breitbart. “Twenty-five years of abuse. I’m not ready so fast.”
In Trump’s opinion, as he said, it would be “fine” if the negotiation between the two countries planned for September, were “called off”.
Meanwhile, China fixed currency’s reference limit at 7.0211 per dollar which is lower than the 7 expected value.
Some very important data will come on Wednesday from China. On the first place, information on industrial production, retail sales, and the jobless rate.
That will be interesting because Cathay Pacific Airways Limited (HK:0293) fell more than 4% just because China blamed it that its employees participated in anti-Beijing protests. Well, the pilot is suspended.
There is Huawei too
President Trump told CNBC that the U.S. administration will not have any relations with Huawei as the trade war proceeds to increase.
“We are not going to do business with Huawei. … And I really made the decision. It’s much simpler not doing any business with Huawei. … That doesn’t mean we won’t agree to something if and when we make a trade deal,” Trump told CNBC.
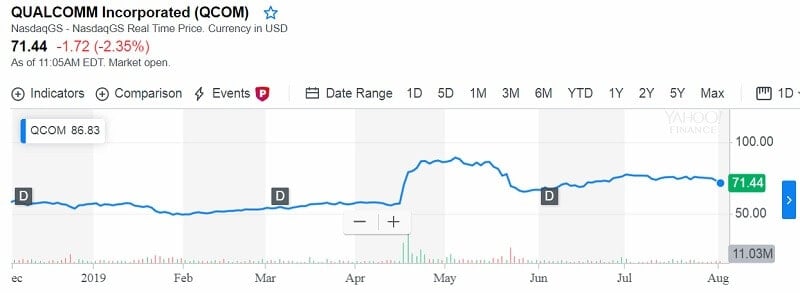
Speaking about Asian stock markets we cannot avoid Chinese tech stocks.
The accepted opinion is that they should lag the rest of the market. That opinion supports Ari Wald, head of technical analysis at Oppenheimer.
“We think the opportunity is on the U.S. side — U.S. tech — and we think the risk is in China tech,” Wald stated on CNBC’s “Trading Nation. ” and added “the S&P 500 is breaking out to the upside. We see this as the resumption of U.S. leadership.”