Author: Editor

  • Chinese Stocks May Get Delisted From the US Market

    Chinese Stocks May Get Delisted From the US Market

    2 min read

    Chinese Stocks May Get Delisted From the US Market

    By Guy Avtalyon

    Bloomberg published Friday that the Trump administration is analyzing to severely limit U.S. financial flows to China. They are considering to restrict the ability of federal pension funds to invest in Chinese companies. Also, severer requirements that could cause Chinese companies to delist from U.S. stock exchanges are on the table.

    According to the U.S.-China Economic and Security Review Commission, 156 Chinese companies are listed on the US stock exchanges. Their entire market capitalization is above than $1 trillion.

    U.S. stock markets are burning on this news. 

    Among Chinese companies that might be delisted are Alibaba Group, Baidu, Nio, JD.com, Tencent Holdings.

    Last market reports show that Alibaba and other Chinese stocks fell on reports White House. Even though it isn’t clear what particular actions the administration considers. The Times states that White House wants to block “longstanding loopholes that have allowed Chinese companies with links to its government to take advantage of America’s financial rules to solicit funds from American investors without proper disclosure.”

    Shares of Alibaba and other Chinese companies fell Friday after reports the White House is studying plans to restrict U.S. investments in China.

    The stocks traded on the Nasdaq, Alibaba fell more than 5% in the last trading day last week, Baidu and JD.com  fell 3.6% and 6%, NIO 13%, Huya had fallen 12%, Baidu fell 4%.

    The iShares China Large-Cap ETF, fore example, China Construction Bank, and Tencent Holdings are members among others, also dropped by 1.2%.

    Chinese Stocks


    This is actually disturbing

    Capital Hill hawks want to limit US investors’ portfolio flows into China. That would have huge consequences for billions of dollars in investment in major indexes.

    The options in considerations are: delisting Chinese companies from US stock exchanges and restricting Americans’ exposure to the Chinese market. Precise methods are still unknown and the plan has to be approved by President Trump. But he gave the green light to the study, as an unofficial source said.

    The other step of Trump administration could be to restrict the Chinese companies included in stock indexes. Even if managed by US companies. Many Chinese companies were added to major indexes over past years and a lot of investors have access to them.

    For example, Chinese companies have been added into the MSCI Inc.’s indexes since last year. Bloomberg Barclays started adding Chinese bonds to its leading Global Aggregate Bond Index in April this year.

    In reply to the news, Nasdaq stated, “One critical quality of our capital markets is that we provide non-discriminatory and fair access to all eligible companies. The statutory obligation of all U.S. equity exchanges to do so creates a vibrant market that provides diverse investment opportunities for U.S. investors.”

    Bottom line

    The US administration is doing everything to untangle the US economically from China. Many analysts thought this move would be one that might be taken by China as part of negotiations to put more advantages on their side in this Trade War.
    The decision to delist China stock from the US markets is an unusual shift. It might be too dangerous for investors to be in Chinese stocks now.

  • How to Identify Market Trends

    How to Identify Market Trends

    6 min read

    By Guy Avtalyon

    Being able to identify stock market trends is a crucial part of your investments and trading. How many times have you heard that the market is trending? Numerous. But did you have the ability to recognize the signs before the market move in some direction?

    So, when we say the market is trending we are talking about market moving in one of two directions. When the market is moving up it is Bullish, but when it moves down it is a Bearish trend. There is some misunderstanding toward trends. Let’s say this way, never fight against market trends. That will take you to losses. Rather catch the flow to manage your risk-reward.

    It is so important to have ways to identify market trends. Markets can also move within a ‘range’, and they don’t need to be recognized as Bullish or Bearish, rather they are falling sideways. So, you can see we have three possible market directions. Ability to recognize when a market is probably moving out of a trend will also help you. 

    Assume you are trading while the market is in a Bullish trend. So your focus would be on buying the position. But suddenly the market starts to change and your edge disappears. 

    It is absolutely scary when you are looking at those changes at your charts. But there are several things that will provide you to know how to identify market trends.

    First, let’s make clear what the trends are you looking at.

    This is very important. You have to determine the time frame you are looking at. Why is this so important? Assume you are looking at a daily time frame and the market is in a bullish trend. Suddenly, the market moves up. Where is the problem? Your 10 minutes chart shows the bearish trend! Yes, but you must have a bigger picture. The market may be in bullish trend the whole day but in those 10 minutes, it is bearish because it is falling. 

    That is the nature of markets. They will never go only up or only down.

    That’s why the timeframe you are looking at is very important. Just like in sport. Your favorite basketball team is in permanent progress to the top of the table. In the market, it is a bullish trend. But suddenly, your team has a match against some outsider and they lost the game (which usually happen to my favorite team). That is a bearish trend in the market. 
    <

    How to Identify Market Trends

    Identifying the trend is essential. But you have to be able to associate that trend with your trading. For example, you recognize a market as bullish on the daily timeframe. What is the possible move? Just wait until it comes back within support levels that you expected to be the span where the buyers will continue the trend. Than start to look at the 1-hour timeframe to buy positions. That is how you may adjust your trades with the market trend.

    You can identify market trends by applying different kinds of technical analysis. You can use trendlines and technical indicators. But trendlines are the most effective method of verifying that a trend breathes. 

    Identifying the trends will help you to avoid wrong buy/sell signals. One thing is important to know, the trending indicator will operate better in trending markets, while oscillators are better in sideways trends. Which one to use may define your success rate.

    Recognizing Trends

    The trends are an overall direction that a particular financial market is moving. To analyze trend you have to use technical analysis to determine direction. Just connect by using trendline all the highs and lows in your charts.

    So, let’s see what kind of trends we have:
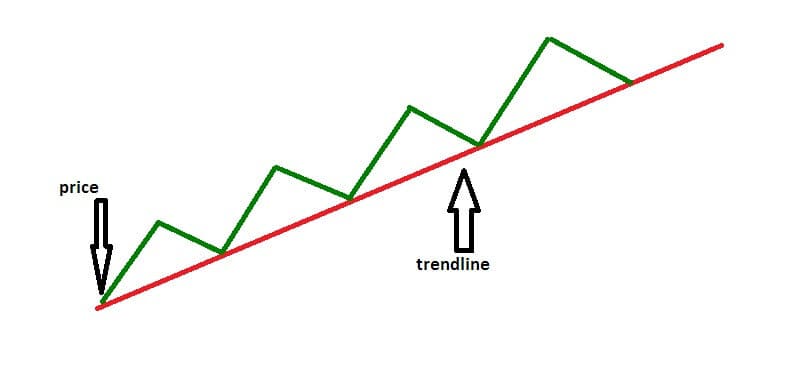
    Uptrend

    The uptrend is when you can inline low points sloping upward. The main characteristic of uptrend is higher highs and higher lows.

    Downtrend

    Connect a series of chart high points sloping downward, and you will have a downtrend. A downtrend is always defined by lower highs and lower lows.

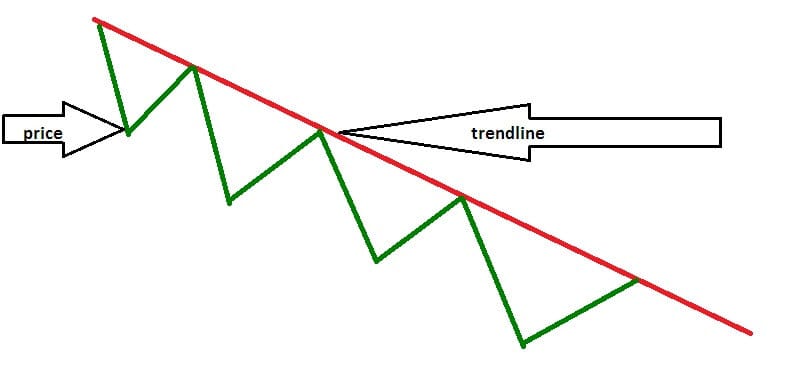
    These graphs are simple images in order to have a clear picture. Trendline should be drawn on the candlestick chart. But in any case, to be able to start a trend line you will need at least two points in the market. You may draw the trendline only when the second swing high or low is identified.

    Speaking about the candlestick chart, you will see that the majority of trend lines overlap the high or low of a candle. The point is to get the maximum touches without cutting the body of a candle. If the trend line cut the body of a candle you may be sure it is a violation. 

    Identifying Market Trends

    Draw triangles on market swings. 

    We already mentioned the market swing points. I am free to say that probably the most obvious way to identify a market trend is to follow them. You can do it by drawing triangles.

    We already know that higher highs and higher lows relate to a Bullish trend and lower highs and lower to a Bearish trend. By drawing triangles over important market swings you will spot when this is occurring. This helps also to inform you when the market

    It will also keep you alert to when the market finish trending and moves into a range, or the trend goes reverses.

    Also, you may use the Bill Williams fractals indicator.

     It is an excellent tool to identify market trends. This indicator is helpful to spot the market swings. When the arrows are upward that is the high of the swing, when the arrows pointing downwards it is low of swing.

    Upward pointing arrows indicate the high of a swing, downward pointing arrows indicate the low of a swing. This is a simple tool that will show you if the market is in a trend. Moreover in what direction, or if it is in a range.

    Moving average as help on how to identify market trends

    The moving average is one of the most popular methods to identify market trends. When the market is beyond the level of the moving average, it is Bullish. If under, it is Bearish. But this method has some disadvantages. It depends on the period you are looking at. 

    One moving average can miss out on great parts of trends so you will end up struggling against the trend. It is always smart to apply two moving averages. One has to be slower the other faster. And, when the faster one is above slower the market is bullish when it is below the market is bearish.

    Use trend lines

    That’s why we had to explain the trend lines. Trend lines are a great tool to identify a market trend. Also, they will highlight potential trading zones inside the trend. The market is in trend when it respects the trend line.

    When the market breaks the trend line it is moving out of the trend into a range, or into a trend reversal.

    Bottom line

    Markets consist of many different varieties of trends. How to identify market trends will principally define the success or downfall of your investing. No matter if you are a long or short-term investor.

  • BTC Price Will Surge Again

    BTC Price Will Surge Again

    2 min read

    BTC Price Will Surge Again

    Yes, the Bitcoin prices displaying a massive drop on Tuesday. Well, there is good news too. Crypto investors continue bullish! So the BTC price will surge again.

    As BTC recorded a huge fall and fell about 13%, investors and traders persist optimistically. They expect the bull market to recover quickly.

    Bitcoin price made a sharp drop yesterday (September 25) falling almost 16%. The daily open was at $9,691 but recorded a new low at $8,164. The price support was broken at $9,090 leaving the area that it has been trading in since June.

    In doing so, price broke strong support at $9,090 and exited the area that it has been trading in since June. Bitcoin’s price action continues bearish under this scope.

    But nothing is finished. Today’s chart (at the time of writing) shows some uptrend. A small one but still.

    The larger picture reveals regular price action with prior corrections. 

    You wouldn’t like to miss this: MONETIZING BITCOIN

    Traders-Paradise wrote about the second-largest German exchange in Stuttgart which started Bitcoin trading. Also, Bakkt starts and SoFi, a finance management firm is launching a crypto trading platform. 

    Are people still micro wise? Well, not all thankfully. BTC price will surge again.

    The BTC/USD pair is trading at the $8,407 after hitting a low at $8,125. In the past two days, the price has passed below the SMA200. Dangerous? Yes, but the typical race for Bitcoin. For unexperienced in Bitcoin, the bullish momentum will continue as long as the daily close is above the long term average. The indicator stays on the bullish side of the indicator. You can check it.

    BTC/USD needs strong support levels, instead, it may fall even more since BTC/USD had another heavily bearish day on Wednesday. The disturbing element is that the daily confluence indicator doesn’t show any support levels until $8,100.

    But even if it goes lower its still a good entry for longs. It is expected the volume further fails on a macro scale. But the price may consolidate if the trading starts again.

    Bitcoin’s price is a distraction from the value.  Everyone was yelling about Bitcoin’s drop past two days. What is about today? It has recovered.

    Don’t judge based on hash rate data. It is an estimation. It isn’t exactness. Until traders start to trade it again the price of Bitcoin may stay on the low level. The point is, Bitcoin may drop slightly more in the next few weeks, with frequent ups and downs but to the end of the year, it may surge again, and more than anyone can expect. That’s the nature of Bitcoin and the beauty of the game

  • European ETFs: Invest in the World’s Biggest Regional Economy

    European ETFs: Invest in the World’s Biggest Regional Economy

    European ETFs

    by Guy Avtalyon

    European ETFs give a large diversification in mutual funds and with a bit of the fee. If you buy one security as a foreign investor you will have exposure to a lot of firms in the EU. Why Europe is interesting for investors? First of all, some of the biggest companies are located in Europe. So, it is a great opportunity for foreign investors to invest in EU ETFs. The European Union factors about 20% of the world GDP, therefore it looks like one of the most valuable investment targets in the world. 

    Benefits of Investing in European ETFs

    Europe is one of the best-shielded business areas around the globe. To be honest, there are still some risks after the crisis in 2009. The companies in Eastern Europe have better growth potential than Western Europe. Anyway, having EU ETFs in your investment portfolio is a great choice and I’ll try to explain why that is.

    First of all, in Europe are some of the most successful companies. For example, a lot of US investors are very interested in them. Moreover, Europe is consists of several areas. That makes European ETFs very good for diversifying a stock portfolio without the risk which developing markets may give. The added quality is that the EU is honestly low-risk. Just compare it with Asia, for example.

    Many investors are now attempting to enter the European Union market through mergers and acquisitions. Also, by investing in its main businesses. The EU is, in fact, welcoming foreign investment. 

    Here is full information that will help investors about investing in European Union.

    Risks of investing

    Of course, there are some risks involved. 

    The main risk is that the members of the EU are very connected and dependent on each other. At first glance, nothing is bad with that but if a crisis occurs it will spillover among them, and business in the union may fall down like a house of cards. As I mentioned above, Wester Europe economies have slower growth and they may seem less attractive for investing. Especially for investors who want more risky investments.

    Where to find: Top European ETFs

    MSCI European ETF (NYSE: VGK)

    Vanguard is available in Europe. Its European funds are based in Ireland. Vanguard allows non-residents to buy their ETFs/funds through a broker. So you can not directly do it through them. Vanguard’s ETF is a good option but it involves currency exchange. You can simply open an account with any broker with access to the NYSE ARCA. That is the stock exchange where Vanguard ETFs trade. The rest is simple, buy it just like with any other international stock.


    iShares MSCI United Kingdom ETF (EWU)

    A lot of investors favor “tracker” funds. They allow you low-cost investments. But not all tracker funds are low cost. Moreover, the fund charge is not all you pay, you will have to pay the broker or fund platform too. The good news is that as your portfolio grows the broker will charge you less on a sliding scale.


    SPDR DJ Euro STOXX 50 ETF (NYSE: FEZ)

    FEZ includes the 50 biggest EU companies but the large-caps from countries that don’t use the euro, including the UK, Switzerland, and Sweden, are not included. But, FEZ’s portfolio includes companies from France and Germany. As a difference from other EU funds, it does not hedge euro exposure. 


    European ETFs provide the most comfortable approach to get exposure to European markets and the easiest access to invest in Europe. In comparison to buying foreign stocks directly, it is for sure.

    Further, European ETFs are an excellent method to diversify your stock portfolio with low-risk investments. To be honest, I have to say that European ETFs will not suit every investor. Risk seeking investors wouldn’t like them, or for younger investors, European markets are not volatile enough. Yes, there is pretty much a lack of excitement.

  • Trailing Stop Loss Definition and Examples

    Trailing Stop Loss Definition and Examples

    3 min read

    Trailing Stop Loss Definition and Examples

    The trailing stop loss may be practiced with stock, options, and futures exchanges that support regular stop-loss orders. It is a variety of stop-loss order. A trailing stop-loss order is executed when the price of the trading asset drops by the trailing value which can be expressed in percentage or currency amount. 

    For example, you might place a trailing stop order to sell your stock with a trailing stop loss of 4%. When the stock dropped 4% from its nearest high the trailing stop order will be executed.

    For example, assume that ABC stock is in its uptrend and hits $100 per share. If you placed a trailing stop loss of 4% it would be triggered when the price drops to $96 or below. Hence, your trailing stop loss at 96%, the sell order at $96 would be a market order. Instead, you can set a trailing stop limit which would provide you to gain a specified price placed in advance.

    Also, instead of placing percentages you may enter a trailing stop loss in currency. It is more favorable. Let’s do some math.

    Let’s say, ABC shares increase to $120, a $4 trailing stop would trigger at $116, which is a 3,3 % drop. If you entered a 4% trailing stop, it wouldn’t trigger until the shares fell 4% to $115.
    \

    The mistakes about using a trailing stop

    A typical mistake is to set a trailing stop too close to the current price. For example, 1% or 2% trailing stop loss. Most stock prices are changing by at least a few cents per minute. If you set the trailing stop loss too tied to the entry it will be stopped out before any significant price moves occurred. 

    The best way is to set a trailing stop distance enough from the current price. If you keep in mind that that the market regularly fluctuates inside a 10 cent span, you would like to set it a bit far from that amount. But be aware, if you set it more from that range because it could happen that you never reach the placed point. The consequence is that the trailing stop could be invalidated and never executed.

    The point of using the trailing stop loss is to get you out of the trade if there is a high possibility of the price changing and destroying your profit on your trade. 

    Trailing stops are useful because they secure in profit when the price moves in our beneficial. The disadvantage is that sometimes they get us out of a trade when the price isn’t really changing, but simply pulling back a little. A good option to a trailing stop loss is to apply a profit target, have that in your mind.

    How to move a trailing stop loss 

    It is easy to find a lot of brokers that provide this type of orders. It’s up to you to choose how much space you want to in your trade. Think twice would you like to set it in percentages or currencies (you have both examples above). When you confirm the order it will move as the market moves because that is the nature of trailing stops: to move as the prices move. You can set it automatically or manually.

    Bottom line

    Traders use different systems to improve their profits and diminish the losses. One of these methods is the trailing stop order. It allows you to define the circumstances that will trigger an order to exit your position. It safeguards your trade against unexpected downturns.

    No matter if you are trading stocks, bonds or whatever, you must have a solid exit strategy. Moreover, you must have it before you buy the position. We already wrote about emotional trading. A good exit strategy will allow you to diminish fears. Let’s say your exit strategy is to wait for the price of your stocks to drop by 15%. You’ll be able to avoid trading in a panic if your stocks drop by 10%. That is the main purpose of applying a trailing stops and other stop-loss orders, to give you a plan to realize your exit strategy.

    Don’t miss this: Trading With Success – A FULL guide for beginners

  • Boerse Stuttgart Exchange Has Started a Regulated Trading Bitcoin

    Boerse Stuttgart Exchange Has Started a Regulated Trading Bitcoin

    Boerse Stuttgart exchange has started trading Bitcoin
    Boerse Stuttgart exchange plans to add litecoin, ethereum, and XRP euro pairs to the end of this year – UPDATED

    By Guy Avtalyon

    Germany’s second-largest stock Boerse Stuttgart exchange (BSDEX) has started a regulated trading venue for digital assets, the company said. It is a fully regulated digital asset exchange under the German Banking Act, said the company in a statement. In the beginning, BSDEX will trade one pair, only the bitcoin-euro.

    In late 2018, the company revealed that it wants to launch a fully regulated digital asset exchange. In the same announcement, BSDEX stated that institutional and retail investors from Germany will have the chance to trade, but later it will be opened for the investors in the whole EU. The trading will be accessible 24/7 like other exchanges on the globe.

    According to CoinDesk, Boerse Stuttgart exchange plans to add litecoin, ethereum, and XRP euro pairs, besides Bitcoin, to the end of this year.

    “The market in cryptocurrencies is worth billions, and more digital assets will emerge on the basis of blockchain,” CEO Dr. Dirk Sturz revealed in the statement. “Our goal is to build up the leading European trading venue for those assets.”

    Boerse Stuttgart Exchange partnered with SolarisBank

    “BSDEX will give retail and institutional investors direct access to digital assets and provide flexible and relatively low-cost trading. We believe blockchain is set to bring about significant changes in the financial industry, and we want to leverage its potential to create the trading venue of the future,” stated Peter Grosskopf, CTO at BSDEX.

    About a year ago BSDEX announced it will launch the ICO platform and began to trade ETNs and litecoin.

    No Brokers Needed

    According to the press, the trading won’t need brokers. The traders will have access to the platform directly. That is nice, but they limited userbase and restricted trading options. For now, traders may set the market and limit orders, but ASAP the rest of the possibilities will be accessible.

    “Earlier, BSDEX has launched Bison. Bison is a mobile app that lets users trade Bitcoin, Ethereum, Litecoin, and XRP for euros. BSDEX’s trading platform is a sign of its new strategy to open the path for the trading of tokenized assets,” the reports say.
    This is important news for anyone who would like to invest or trade cryptocurrencies. A true step forward.
    Our concern is restrictions and limitations. But let’s not be so suspicious. What about giving them a chance? It looks like a reasonable decision. But will keep an eye on it.

    What we can say is that Bitcoin’s adoption continues. Nice venture.

    LAST UPDATE

    From 25 February 2020, new ETPs that track the inverse value of Bitcoin is available on the Boerse Stuttgart Exchange. It is still connected to the Euro.
    This tracker product’s value represents the inverse performance of the Bitcoin as an underlying asset. Meaning, when the price of Bitcoin drops, the ETP increases, minus management fee for daily trade. The product is completely hedged with the underlying asset 1:1. The launch of the first inverse is presented as a natural extension to the existing unleveraged range of crypto ETPs. Boerse Stuttgart stated that it offers a bigger choice to investors. This choice lies in the possibility for investors to better manage the grown volatility and changes in the cryptocurrency markets.

  • Negative Balance Protection

    Negative Balance Protection

    4 min read

    Negative Balance Protection

    by G. Gligorijevic

    Negative balance protection signifies that you will not lose more than your deposited money. Or to put it simply, you won’t owe money to your broker. Sounds great, indeed. You will not end up with a cash debt on your account.

    At first glance, this looks like a great thing. For example in spread betting, that lets traders take leveraged short-term bets on stocks could end in tremendous losses.

    Here is one example.

    Assume you put $10,000 to your account and want to buy stock. Let’s say the leverage is 5:1 which would provide you a position of $50,000. But, the market is really volatile those days and the price of your stock drops, for example, 8%. Remember, your leverage is 5:1, so this drop would make you a loss of 40%. It is $20,000 of lost. This lost would destroy your deposit of $10,000 and you have to pay back to your broker what you owe. Yes, this is an unpleasant situation but if you are trading with a broker who lets you negative balance protection, your loss would be exactly the amount you deposited, $10,000. Nothing more, nothing less. 

    It is a great thing for traders.

    Negative balance protection is a proposal that brokers practice in order to protect their customers. This method guarantees that traders will not lose more than their deposit is if their account moves into negative as a result of their trading activity. This is a great reason to choose the broker that provides it. You will not owe the money to your broker if you made the wrong trading choice.

    Yes, the brokers always have a margin call to protect. The truth is that this option isn’t the best choice when the market’s shift quickly and the stock prices are in high-speed movements. If the price moves too fast and moves beyond your margin call out level you may lose more than it is expected.

    Negative balance protection in Forex

    Negative Balance Protection

    It protects your account balance never to falls under zero. How is possible for your Forex trading account to go under zero?

    Don”t be worried. Your broker has protection, in the first place it is margin call. But, the same occurs as it is with stocks. When some incredible drastic move happens in the currency markets, your broker may not be able to close your trade immediately. Also, your stop-loss order will not be executed due to the high speed of the market movement.

    Therefore, the price may run beyond your stop loss or margin call close out level. That may cause a larger loss that exceeds the size of your account balance. So, you would have a negative balance.

    This is where negative balance protection comes to the scene. The broker can overlook or forgive your negative balance and lets your account to begin from zero again.

    Why traders need this?

    Forex and CFD markets are volatile. That makes traders unprotected in sudden price movements and gaps. When extreme price movements happen in open trade, this may have an important influence on the value of your open positions. It is particularly dangerous when your position is highly leveraged.

    If you hold a leveraged long position, you would lose more than your initial deposit. And as I said before, this would put you in a position where you would have to pay your debt back to your broker.

    Negative balance protection resets your account balances to zero.

    Is there anything bad?

    In short, yes.
    When you enter the market you are dealing with some unresponsible people who don’t pay attention to the risk involved because their goal is to beat the market. Sic!
    When you set negative balance protection heaven isn’t the limit. This safety net wouldn’t let you take additional risks just because you have the belief that you can make easy money. Stay in the safe zone, it is smarter and better for your trading account.
    Also, if you put negative balance protection, you have to pay increased margin rates. 

    The history of negative balance protection 

    It grew more prominent after the Swiss franc crisis in 2011. That was when the Swiss National Bank (SNB) closed holding its currency against the EUR at a fixed currency rate. The Swiss franc rapidly soared against the EUR. The consequence was that numerous traders shorting the franc ended up with enormous negative balances losing more than they had deposited on their account.
    The Swiss market had great losses and many traders ended up with the fear that their brokers would ask to get paid to cover their losses.
    The brokers that provide the leverage are obliged to apply for negative balance protection on a per-account basis, thanks to ESMA regulation for the EU.

  • How Often to Check The Investments?

    How Often to Check The Investments?

    2 min read

    How Often to Check The Investments

    by Guy Avtalyon

    Your investments should certainly be periodically checked but not every day. Even though it is your money invested. You have a bigger chance to lose money if you check your investments every single day.

    How?

    Well, you know that the price changes occur very frequently due to the stock market volatility. The stock price can rise and drops hourly. Watching that, you may feel a bit more nervous about your investments and provoke you to sell instead to hold and wait for the price to increase. Also, you have to know that daily fluctuation in stock prices does not influence your investments. The most important is how your stocks perform in a bigger time frame.

    If you check your investment too frequently, you will end up acting irrationally to market movements and sell your stock at a low price.

    Yes, I know,  our investments may give us the impression that we will never end up with sufficient money. You have to know how often to check your investments so that you don’t destroy them. 

    For new investors, quick gains can cause investing to look impressive. It is normal to check your investment every night. I can understand that. I know some investors are checking several times a day. If you need to be worried about your investment it is a sign you made the wrong choice. 

    If your portfolio loses just a bit in a few days or weeks there is no reason to panic. The statistic shows that fresh investors usually put money in mutual funds or ETFs because they are afraid to invest in more volatile stocks and they avoid them. The truth is that holding stocks requires more attention, time to track them, and knowledge.

    But you can’t have only mutual funds or ETFs in your portfolio and check them once a year. You would like to have stocks as well. And a lot of things will be changed.

    So, how often to check the investments?

    With stocks, things are pretty different. You have to check them at least once a week to notice if something, some event, for example, influences your investment.

    If you are holding or trading individual stocks, try to check them quarterly. OK, maybe monthly if you are so nervous. It is reasonable to check your investments from time to time. But too much checking can make you panic and sell at a lower price. And you will start that chain. That frequently checking will cause trading, fast trading will cause over-selling, over-selling will produce more fees and costs. Also, if you have too much trades you will have low returns.

    It is smart to pick a good investment strategy and stay with it. Check the progress of your investment quarterly and check the price, for example, monthly.

    With mutual funds and ETFs, you have wide diversification, so once a year is enough. 

    With stocks, check it out by online approval or in the paper version. Most of the financial websites such as  Yahoo Finance and some others offer stock research data. Also, your broker has quotes available.

    How often to check your investments? Less is better. You are investor, investing is a marathon, it is for a long run. Make a reasonable plan, according to your risk tolerance, be patient. Rebalance your investments once a year and let your money work for you.


  • Market Timing – A Way to Beat The Stock Market

    Market Timing – A Way to Beat The Stock Market

    market timing
    How is market timing possible? Read to the end.

    By Guy Avtalyon

    Market timing is the method of buying and selling in the market based on financial inclinations, business information, and market circumstances

    It is a kind of investment or trading strategy. It is an effort to beat the stock market by prognosticating its movements and buy and sell according to that data. While you are making moves in the financial market, changing the asset classes, you need some predictions. To make predictions you need tools, for example, technical indicators, financial and economic data, to be able to estimate how the market will move. 

    From these tools needed you can easily see that the market timing is in contrast to a buy-and-hold strategy.

    Some investors don’t believe that is impossible to time the market. But on the other side, you have a whole range of investors, especially traders that are sure in it. Well, both sides are right, at some point. It is pretty hard to time the market, but it is possible for the short run. Seeking to time the market over the long run can be difficult and may show a lack of consistency.

    Is market timing possible?

    If you are a short-term trader or full-time investor, you may have some good results but you have to be an exceptional one to notice the right time to buy and sell in the market. The statistic is explicit, there is no notable success in comparison with the buy-and-hold investor.

    Market timing is related to tactical asset allocation or dynamic investing.

    Let’s say you want to invest $10,000 and you put $5,000 in the stock, $3,00 in the bonds, and $2,000 in the cash. 

    The market timer tries to sell when the price is the highest and to sell when the price is at the lowest level. So, the trader or investor confidence to market time will sell some part of stocks in case the interest rates are increasing and buy bonds. Such an investor wants to profit from something called a market “peak” for stocks and the start of growth for bonds.

    The believer in market timing is sure that price movements in short-time are essential and usually predictable. That’s why the market anomalies are important to them to support their opinion. Chart patterns that are repeating are also important to them. Their investment horizon is shorter, it can be minutes, days, or months. On the other side, long-term investors, so-called buy-and-hold, prefer to estimate the long-term potential of their investments by employing fundamental analysis. They are estimating the company’s strategies, products, etc.

    Market time investors will use leverage to gain returns. This will add more risk to their portfolios but their returns could be higher too.

    Are there any costs for it?

    Investors that practice this strategy claim that by using this method they are able to diminish losses. The principle is quite simple, they just have to move one sector before drawbacks. You see, their aim is to find a safe investment and avoid market volatility while they are holding volatile investments. Market timing investors that attempt to time entries and exits very often may underperform the long-term investors. The reason behind, it is extremely hard to gauge the next direction of the market. Despite their optimism, the real costs for the majority of them are higher than the possible gain of moving in and out of the market. 

    There are also extra trading commissions and capital gains taxes. The continuous analysis linked with market timing requires frequent asset reallocation and a lot of trading activity. Much more than passive investing. If you want to practice this method you will need more time and an excellent education.

    Market timing is a questionable approach. You can find a lot of very serious studies that have revealed that the market’s bottoms and tops are pretty hard to find consistently.

    Moreover, long-term investors truly support the efficient market hypothesis, which claims that the prices are random and reflect all available data, so it is impossible to outperform the market in the long run. It is especially too hard in a short time since it is impossible to forecast stock prices. Although, market timing has huge and faithful followers among investors. Can we say they are enjoying the challenge to consistently produce higher-average returns? Maybe.

    The most important thing for all investors is the fact that they have to watch their investments, to watch charts and they have to know the market timing method.

  • Stocks Under 5 Dollars Per Share to Buy Right Now

    Stocks Under 5 Dollars Per Share to Buy Right Now

    Stocks under 5 dollars
    Stocks under $5 can be a good opportunity, they are low-cost but can generate a large percentage gains

    By Guy Avtalyon

    Why should anyone invest in stocks under 5 dollars per share? Just read this post to the end. There is no excuse for not investing. You can do it with just $5 per share. Traders-Paradise presents you three stocks under 5 dollars per share with pretty great potential. There is a great risk involved too since they are really volatile. Be aware, all stocks under $5 are volatile. Because of their nature, these stocks may provide you great returns but large losses too.

    So, these are our tips on stocks to buy right now and make a profit.

    Reebonz Holding Limited 

    Ticker – RBZ
    Market cap – $16.053M

    Reebonz is an online platform with a focus on buying and selling luxury products. Headquarter is in Singapore. The company was founded in 2009, today it is the leading online platform for buying and selling luxury products in the Asia Pacific region. It has offices in Singapore, Thailand, Hong Kong, Korea, Taiwan, Japan, China, Australia, the United States, and many other countries.

    On Friday it stated that will release its unaudited business results for the first half of 2019, before the opening of U.S. markets on September 23. So, we will see. 

    Until then, let’s see what do we know about this company.

    This platform operates as an eco-system of B2C e-tail and B2C marketplace covering more than 1,000 brands. It is supported by C2C which provides private members to sell luxury products. Shopping is very easy since the company’s UI is user-friendly. Reebonz sources collections of many brands from luxury boutiques from all over the world.

    The current price per share is $2.58. The analysts estimated the RBZ stock will be one year from now at $11. Our suggestion is to buy its shares.


    ReneSola Ltd 

    Ticker – SOL
    Market cap – $71.59M

    ReneSola Ltd was founded in 2005. ReneSola Ltd is headquartered in Shanghai, China. The company is listed on the New York Stock Exchange in 2008. It is an international technology provider of green energy products. 

    It is a Chinese producer of the range one solar panel with a 10-year product and 25-year performance warranties. Their panels are corrosion resistant, and that fact makes them very convenient for installation by the sea. Renesola has offices in Sydney and Melbourne too.

    The company produces string inverters, microinverters, and LED lighting too. It provides the highest quality green energy products and services for EPC, installers, and green energy projects all over the world.

    The current price per share is $1,88. So, our suggestion is to purchase since the shares are undervalued for no reason. These shares are good. They already beat analysts’ expectations.


    Trevi Therapeutics Inc.

    Ticker TRVI
    Market cap $82,930,751

    Trevi Therapeutics was founded in 2011. Its headquarter is in New Haven, the U.S. state of Connecticut. They are developing nalbuphine ER, treatment for uremic pruritus, improving “the quality of life of patients suffering from the serious symptoms associated with chronic neurologically mediated conditions” as they stated on the official website.

    The Trevi Therapeutics’ team is highly engaged and experienced in life science clinical development, successful commercialization, and building companies of exceptional value. 

    Since launching, Trevi has raised $92.2 million in the financing, according to the filing for its IPO this May. 

    Trevi Therapeutics, Inc. is focused on the development and commercialization of nalbuphine ER to treat serious neurologically mediated conditions. The company’s nalbuphine ER  is in a clinical trial. The purpose is for the treatment of chronic pruritus, chronic cough in patients with idiopathic pulmonary fibrosis, and levodopa-induced dyskinesia in patients with Parkinson’s disease.

    The current price per share is $4,5 but analysts predict that easily can be over $16 in the next 12 months

    These are only three stocks under 5 dollars worth to buy right now. There are more, of course. The price per share is low, the growth potential is reasonably good. But remember, the low-cost stocks are extremely volatile. The high potential risk is involved but the reward can be great also. Everything is up to you when it comes to stocks under $5. This is just a suggestion. But I would like to give more info on trading so-called penny stocks.

    Why trade penny stocks?

    As I just gave you a suggestion of stocks under $5 I would like you to know that these are so-called penny stocks. So, penny stocks represent the companies whose stocks are valued under $5. You can find that definition can vary but, in essence, this is the right explanation. At least, it isn’t wrong. So, let’s put aside the definition. You may ask yourself why should you trade penny stocks.
    Trading penny stocks has one reasonable goal: to turn a little money into the big money. Traders’ profit comes from small changes in stock price but from large percentage gains. They trade with large leverage. That’s the point. Also, that’s the way how you can trade with a little money and earn very nice. Once I said don’t be shy to buy cheap stocks, stocks under 5 dollars. This is especially valuable for the penny and undervalued stocks.

    At the end of the day what really matters is your profit. Happy investing!