

Category: How to Master in Trading – Advanced


The purpose of the category How to master in trading – advanced is to give experienced traders an insight into the new trading techniques. Very often they are very rarely used because they require advanced knowledge in many fields – from complex mathematical operations and calculations to the usage of high-level trading tools. Traders-Paradise’s goal is to inform about them. But not only that. The main intention is to make them familiar to all traders. No matter are they beginners or elite.

Traders-Paradise gives you an opportunity

In trading, just like it is in many fields, having advanced knowledge is an advantage per se. Thanks to our excellent analysts and experts, the most advanced techniques are available to the traders. Moreover, each of them is fully explained, with real trading examples. All complicated mathematical calculations are explained in detail. So, traders need to have on hand this valuable information and samples.

Traders-Paradise insists on quality

Concerning beginners’ already gathered knowledge, sometimes the explanation in the posts in the category How To Master Trading- Advanced will not be enough clear no matter how much we want that. Simply, to understand what our team writes here, the visitor will need to improve the skills. For them, Traders-Paradise has one simple piece of advice – visit one of our categories designed and written exclusively for the beginners.
This category – How to Master In Trading – Advanced is directed at elite traders. The impressive thing is that all posts and articles are very precise in explanation no matter how complicated the subject is. All advanced trading techniques, methods, strategies are understandable thanks to comprehensive and detailed explanations.

  • Volume Weighted Average Price (VWAP) –  All Calculation, Practices, and Mistakes

    Volume Weighted Average Price (VWAP) – All Calculation, Practices, and Mistakes

    Volume Weighted Average Price (VWAP)
    Volume Weighted Average Price is an indicator that takes into account both stock price and trade volume. 

    For all of the indicator followers, Volume Weighted Average Price is a very important indicator. VWAP (Volume Weighted Average Price) is quite simple to calculate. Traders are using Volume Weighted Average Price to check if the price at which they traded was good or maybe the price was not and they made a wrong trade. Also, intraday traders will use Volume Weighted Average Price as a kind of indicator. As a contrast from the moving average, VWAP provides traders to get price points of interest, to estimate relative strength, and recognize best entries and exits. They will buy when the price is above the VWAP.

    What is the Volume Weighted Average price exactly? 

    Окаy, let’s say you have to compare two obviously good stocks. What you have to do? The answer is logical, you have to check its price trend and the trading volume. Checking the price is reasonable, but why would you check the volume?

    Well, the volume is important because it shows how many takers the stock has. Who would like a stock with a few traders? No matter if you think the price is reasonable, you would like to know the volume. Therefore, the VWAP was designed to give traders an insight into the stock price and volume. These are very important info that provides every investor should make a decision whether to buy or not a particular stock. 

    The formula for calculating VWAP is 

    VWAP = (Cumulative (Price x Volume)) / (Cumulative Volume)

    It will show you the average price that investors have paid for that stock during the trading day. So, you will know how other investors are positioned. Moreover, this measure is used by algos also. They use it to scale into positions. By using it, the algo can break up its position size into segments so as to reduce its impact on the market.

    Well, the philosophy of how VWAP is used can lead to various types of trading systems.

    VWAP calculation

    It is done by charting software and reveals an overlay on the chart representing the calculations. This design is in the form of a line, similar to the moving average. How to calculate that line?

    You have to determine your time frame, for example, 1 minute.

    Find the typical price for all periods in the day. You can calculate the typical price when adding the high, low and close prices and that sum you have to divide by 3.

    The formula is

    (H+L+C)/3

    H – high
    L – low
    C – close

    It’s not finished yet. The number you got as a typical price now multiply by the volume for the chosen period. 

    TP x V

    TP – typical price
    V – volume

    Now, you will need a cumulative TPV. You will attain this by constantly adding the most current TPV to the earlier values. The exception is the first period from obvious reasons, there was no prior value. This number is becoming larger as the day is coming to an end.

    Calculate VWAP based on your data and use this formula: 

    cumulative TPV/cumulative volume 

    This will give you a volume-weighted average price for each period. Now, based on this data you can create the line that covers the price data on the chart.
    It is better to use a spreadsheet to track the data in case you are doing this manually.

    Time to buy according to VWAP

    The best time to buy a stock is when the price goes above VWAP. It is a sign that buyers are in control and the majority of intraday positions are in profit. But if the stock price is below VWAP it means that traders have bad trades and losing money on them.

    The Volume Weighted Average Price unlike other technical analysis tools, it is best adapted for intraday examination. It offers a good way to identify the underlying trend of an intraday. So, as you can see, when the stock price is above the VWAP, that means the trend is up. Contrary, when the stock price is below the VWAP, that means that the trend is down.

    But remember, indicators are using past data to calculate the average. Every indicator starts to calculate at the open and stop to calculate at the close. And as you come closer to the end of the day, the indicator will have more lags. In intraday charts that use very short time frames, you have hundreds of periods in a single day.

    Use Volume Weighted Average Price as trend confirmation

    We have already said, VWAP provides traders info related to volume and price. But, it will help traders to confirm the appearance of trends that might be rising or going down over the day. For example, you see in the chart VWAP is rising despite the swings in the closing price. You can be sure that there are less sellers than buyers for that stock.

    Thus, a rising VWAP indicates a bullish period, while a decreasing VWAP indicates a bearish period.

    It can be a trade execution strategy

    VWAP is helpful for institutional investors as they need to buy or sell a huge amount of shares but they want to avoid a spike in the volume. They don’t want to attract attention and influence the price.

    For example, some institutional investors want to buy 10.000 shares of some companies. If such an investor sets the buy order of 10,000, the consequence will be a spike in the price in the moment of filling the order. So, when other investors recognize that big demand, they would also like to buy the same stock and at a higher price than the bid price of an institutional investor. Of course, traders would sell the stock back at a much higher price. That’s how the stock price rises in a particular case and dramatically increases the “ask” price of the stock. As we mentioned before, some software is able to divide these huge amounts of shares into smaller blocks and execute the trade and not let the closing prices go far from the VWAP. It is important to keep the closing price as much as possible near to the VWAP.

    Bottom line

    As we explained, VWAP is a lagging indicator. So, don’t try to use it for more than for one-day frame, because it will not show you the right trend. It is good for intraday trading. Also, when the stock or, in some cases, the overall market is bullish, you will not be able to find crossovers for the whole day. So, you will have poor data. By the way,  VWAP isn’t able to give you much historical data.

    The VWAP provides valuable information, more than the moving averages. Also, it isn’t a tool for a long term investor.


  • The Barbell Portfolio –  Strategy Of A Balance

    The Barbell Portfolio – Strategy Of A Balance

    The Barbell Portfolio - Strategy Of A Balance
    The barbell portfolio holds only short term and long term bonds and generates fixed income. A flattening yield curve situation is the best time to use this strategy, while a steepening curve is harmful to the strategy.

    The barbell portfolio was invented by bond traders. The strategy means to hold safe short-term bonds and riskier long-term bonds. Put them together and that is the barbell portfolio. This also means that you are betting on both sides. But your barbell portfolio gives you protection since you have extremely safe short-term bonds. Yes, they will provide you with less profit but the profit is compensated from the other side of your portfolio – by long-term bonds that are extremely risky but provides a great profit.

    Building a barbell portfolio, you will give your investments a balance that can run you through different circumstances, even extreme ones. The barbell portfolio is a very simple investment allocation actually. But the barbell portfolio is heavily weighted on two ends, just like a barbell. This concept is easy to understand and we want to explain it by using bonds. You can create this kind of portfolio with cash and stocks, also it can be a nice substitute to a 60/40 stock/bond portfolio.

    How to structure barbell portfolio 

    Let’s say the short-term bonds are risk-free. But you will not earn a lot by holding only them. To have a profit you must add something riskier to your portfolio. So, you can do it by holding long-term bonds. You see we are not considering mid-term bonds. There are long-term bonds to provide the yield to your portfolio. 

    Yes, they are the riskiest but also give the highest returns.

    The idea of this kind of portfolio is to bypass and avoid the risk on one side of the barbell portfolio and to do it as much as possible but to put more risks with long-term bonds.

    For every investor, the risks diversification is one of the most important parts. So how to do that with a barbell portfolio? For example, you can build it if one half of your portfolio is in bonds with 5 years maturities and the rest is in bonds with 15 years maturities. The point is to put weight on both ends of your portfolio. But it hasn’t to be equal weight. it can be turned in one direction or another. Of course, it depends on an investor’s vision and yield demands.

    You have to pay attention to the bond barbell strategy. It isn’t a passive strategy. You will need to monitor short-term bonds and adjust them frequently. Also, the other end with long-term bonds should be adjusted from time to time because of their maturities shorten. Some investors will just add new bonds to replace the existing.

    Barbell Investing

    It is all about aiming to balance risk in your investment portfolio. For example, if you put bonds on the left end of the barbell portfolio you might be faced with rising interest rates. So, the value of the bonds could decline. In order to balance the weight, you can replace them or part of them with, for example, with dividend-paying stocks, or some other ETFs. This left side has a great role. It has to protect your wealth so the savvy investor will always choose low-volatile and low-risk assets for the left end.

    The right side’s role in your barbell is to give you high profits. That is your financial goal. So you can add some aggressive stocks there instead of long-term bonds.

    The barbell strategy is actually a simple investment allocation. Two ends, two sides of your portfolio are designed like opposite ends. What you have to do is to allocate your capital between safe and aggressive sides. Some experts recommend holding 80% treasury bonds and 20% stocks.

    Some may ask why to diversify like this. Here is why. Let’s say you have invested 100% in different stocks. Yes, you have a diversified portfolio but you are, at the same time, 100% exposed to downside risk and you are at risk to lose all your capital invested.

    But if you build a barbell portfolio with 80% bonds and 20% stocks your downside risk can arise on your risky part of the portfolio. That is 20% of stocks. But the point is that the majority of your portfolio will be in safe investments. Moreover, bonds will give you interest too.

    Why use this strategy?

    Because it can lower risks for investors. At the same time, it can provide exposure to higher yield bonds. Higher yields will compensate for the higher interest risk rate. So that is the first benefit. This strategy allows investors to have access to higher yield long-term bonds. The other benefit is that this strategy reduces risks because the short-term and long-term bonds’ returns favor being negatively correlated. In other words, when short-term bonds are doing well, the long-term bonds will have difficulties. When you hold bonds with different maturities it is more likely to have less deadfall risk. Let’s say when interest rates grow, the short term bonds are rolled over and reinvested. Of course, at a higher interest rate.  That will compensate for the drop in the value of longer-term bonds. Opposite, when interest rates are lower, the value of the longer-term bonds will grow. Simple as that.

    But remember, it’s so important to manage the weight of both ends. And to do it actively. The contrary will never produce long-term returns. If you notice that the assets on one end of your barbell portfolio somehow look expensive you have to change it and balance by leaning toward less expensive assets on the other end. Well, if the prices are expensive on both ends, you will need to reduce overall portfolio risk.

    Is there any risk?

    Yes, interest rate risk no matter do you hold both long term and short term bonds. If you buy the long-term bonds while the interest rates are low they may lose value quickly when the interest rates increase.

    An additional risk of the barbell strategy comes from the investors’ limitation, this portfolio doesn’t include intermediate-term bonds so you will not have exposure to them. And we all know that intermediate-term bonds give better returns than short-term bonds. Yes, they are riskier but not too much. In comparison with long-term bonds, intermediate-term bonds will offer a bit lower returns. That is the downside of the barbell portfolio because you don’t have an opportunity to earn on these returns.

    Well, the main risk of the barbell strategy lies in the longer-term bonds. They are more volatile than their short-term bonds. As we said, you will lose if rates rise and you choose to sell them prior to their maturity date. If you keep the bonds until the maturity date, the fluctuations will not influence negatively.

    The worst scenario for the barbell is when long-term bond yields are rising faster than the yields on short-term bonds. That is the steepening yield curve. The bonds that make up the long end of the barbell drop in value. So, you may be forced to reinvest the profits of the lower end into low-yielding bonds, to balance the portfolio.

    But the flattening yield curve, if yields on shorter-term bonds rise faster than the yields on longer-term bonds you will earn. That is an advantageous part of the barbell strategy.

    Bottom line

    The benefits of the barbell investing strategy are numerous. Firstly, you will have a better diversification of your investments. Also, you will have more potential to reach higher yields with less risk. If interest rates are falling all you have to do is to reinvest at lower rates when the maturity date of that bond comes. In case the rates are rising, you will have the chance to reinvest the profits of the shorter-term securities at a higher rate. Since the short-term bonds mature frequently, that will provide you the liquidity and adaptability to solve emergencies.

  • Black Swan Investing Strategy To Reduce The Risk

    Black Swan Investing Strategy To Reduce The Risk

    Black Swan Investing Strategy
    Predicting when the next black swan event will happen is the mission impossible. But you can create a portfolio created to reduce the risks related to black swans.

    Black Swan investing isn’t quite a strategy, it is more a trading philosophy. Actually, it is a method of predicting the occurrence of black swans. The black swan is an unplanned, unexpected event in the markets. Such events come as a sudden blow and may influence the market. But black swan also can have both a positive and negative impact and we are going to discuss them here.

    An example of a negative black swan is the crisis of 2008.

    Black Swan investing is a trading philosophy based completely on the probability that some accidental event will hit the markets. To avoid losses caused by a black swan, traders who are trading based on black swan strategy always are buying options, never sell. They never estimate will the market go in one or another direction, up or down, they are buying. These traders are actually betting on the chance the market will move both up and down.

    Protection of investments 

    Behind that behavior is investors’ need for insurance for their portfolio to protect against another black swan event like it was financial crisis 2007-2009.

    They are afraid of is losing money as they did at the time of the crash. But losing money is a risk that you have and can determine. The black swan is a risk that you can not determine or predict. How can you plan some sudden and hidden events ahead? Hence, we can’t hedge out the risk of secret and unknown events. All we can do is analyzing past events.

    The black swan investing theory is based on an old saying that presumed black swans did not exist. Nassim Nicholas Taleb developed black swan theory but in his book The Black Swan he also recommended traders to fire their advisors claiming that they don’t know enough or know a bit about investing. Brave claim indeed. His belief in the incompetence of financial advisors is based on their disregard for Black Swans.

    Is it possible to predict the next event?

    It sounds like an impossible task because it is. As we said, how can you predict something unknown? But what you can do is to build a well-diversified portfolio to reduce the risks. Also, now you have this tool to determine when to exit your trade and avoid money losses. Moreover, you can determine when to do that in profit. 

    Yes, your portfolio can be structured to reduce risks linked to black swans.

    Positive or negative black swans

    Okay, you would like to know how to invest for positive or negative black swans. So, first of all, you have to understand how not to depend on catastrophic predictions. Let’s say, you invested with the belief that the stocks will grow forever. Also, you are pretty much sure that the financial crisis will never come, or the company will never bankrupt. Well, something has to be changed in your beliefs. The truth can be very painful for you at this very moment. Stocks will not rise all the time. Not even in the next 20 years or even five. They will go up and down.

    The main point of black swan investing is to profit from unpredictability. But such events come suddenly, they are surprising, so how can we invest in it? We cannot do it directly. All we can do is to be ready for them, meaning to be exposed to such exceptional but extremely impactful events.

    How to expose to a positive black swan

    How to do that? How to take advantage?

    If you follow Taleb’s definition it is quite clear what to do to positive events. If you can seek exposure to something you can not predict,  then seek out exposure that is unrestricted to the upside. Well, there is no need to know will some event come or not, or when it is going to happen. All you have to do is to detect exposures that have the potential to blast if meet the proper conditions.

    Exposure to positive black swans may sound a bit esoteric. Some investors that are practicing a black swan strategy like to say that it is necessary to build a portfolio that is able to “invite” positive events, amazing and unexpected. We don’t have material proof that it works. 

    Their idea is to give a portfolio a chance by setting up limited sums of money or scale it up. If it works, it’s okay. If it doesn’t work, just give up and risk later. 

    This stands in firm contrast to traditional investing advice.

    Behind this idea

    For any trader who wants to implement the black swan investing strategy, it is necessary to create a barbell portfolio. This kind of portfolio was created by bond traders. This strategy requires owing safe short-bonds on one side of the barbell, and on another side to balance the weight of investments, riskier long-dated bonds.

    By building a barbell portfolio, you’ll have very safe investments on one end and notably risky investments on the other end. The safe investments virtually don’t have risk. They will survive even a black Swan. The risky side of the portfolio opens it up to the endless upside. This kind of portfolio advances despite any circumstances in the market. That’s according to Taleb.

    Black Swan investing 

    Since black swan traders never sell and they are counting on the crash, they are buying out-of-the-money options.

    But one question arises. Can any empirical evidence account for black swans? We are afraid the answer is no. So, we cannot predict the market. Why there are still people trying that? Because we all need progress in this field. Yes, we have algos, AIs, learning machines, automated trading, etc. But yet, no one can predict the market. And it is a great challenge. By fair, that moment isn’t so far from us. One day someone will find some formula for that. Frankly, how many people were able to predict all possibilities of the internet? A very small number. Today it is part of our daily lives. 

    Yes, we truly believe that one day, somewhere, someone will find a way to predict market movements. Meanwhile, there is no need to give up from investing because of the lack of unreachable knowledge. Just work with what you have and know. That would be enough. At last, it was enough for the past 200 years.

    Pro tip: Develop an efficient portfolio on a demo account first; (1) Examine how well it guards you from random Black Swans (2) optimize (3) only then risk real funds.

    Bottom line

    Banks are a negative black swan business. The upside is inadequate and the downside is complete. The examples of positive black swan investing biotechnology stocks, venture capital, publishing, etc.

    The venture investor that invested in Uber in its beginning was exposed to a positive black swan, but today would be more exposed to a negative black swan with the same investment.

    The key principle in black swan investing is to find extremely aggressive as unreasonable as possible assets. Hence, when you find that chance, take it.


  • CAPE Ratio Or The Shiller PE Ratio

    CAPE Ratio Or The Shiller PE Ratio

    CAPE Ratio Or The Shiller PE Ratio
    The CAPE ratio has some predictive ability so you can create your investment strategy based on the CAPE.

    The CAPE ratio is a variety of the P/E ratio. Just like the P/E ratio, the CAPE ratio shows whether a stock price is undervalued, overvalued, or fairly valued. 

    But, the CAPE ratio permits the evaluation of a company’s profitability during various periods of an economic cycle. The CAPE ratio also analyses economic fluctuations, both the economy’s expansion and recession. Basically, the CAPE ratio is a tool analysts use to measure how ‘cheap’ or ‘expensive’ the stock market is. We can know that only if we compare its P/E ratio with historical values over the last 10 years, that is common. And if the P/E ratio of the market is lower than it’s 10-years average we can say the market is undervalued. Hence, if the 10-years average is higher, the market is overvalued.

    This metric to estimate if the stock market is overvalued or undervalued was developed by Robert Shiller, an American Nobel Prize Laureate in economics. It became very popular during the Dotcom Bubble. At that time Shiller perfectly pointed out that equities were extremely overvalued. That’s why this metric is also called Shiller PE.

    How to calculate the CAPE ratio?

    It is possible if you divide the current market price by the 10-year average of inflation-adjusted earnings per share. 

    CAPE RATIO = PRICE / AVERAGE EARNINGS ADJUSTED FOR INFLATION


    That’s a big bite, so lets this formula to make a bit simpler.

    Let’s say, some farmer is selling apples for $20 each. WOW! This guy may make a fortune. But who will pay $20 for just one apple? Is it golden? Everyone would think the price is insane. But let’s take a look at historical data for the last 10 years. For example, we found one single apple has been selling at $40 over the past 10 years. This would change your opinion and we suddenly believe the price of $20 isn’t high, it is contrary, very cheap. Something different we would believe if we found the apple average price was $2 over the last 10 years. Who would buy now? 

    So, we estimated what was the average apple price in 10 years to have a comprehensive idea of how much apple costs.

    Let’s this example apply to the stock market which has a historical price called a P/E.

    P/E is when the price per share is divided by the earnings per share each year. If the farmer mentioned above started a company and makes $2 a share and the stock market values each share of the company at $10, what would the P/E ratio be? The P/E would be 5.

    Let’s use CAPE

    If the CAPE ratio is extremely high, which means that we have a company with a higher stock price than the company’s earnings show. So we would easily conclude that the stock of such a company is overvalued. Of course, we can expect that the market will ultimately correct the stock price by shifting it down to its fair value.

    How the CAPE Ratio Works 

    A good position for following the CAPE ratio is to estimate the basic P/E ratio as first. It is a generally-accepted metric, but Shiller noticed a restriction in it.

    Well, a company’s earnings can be reasonably volatile from year to year particularly during top and not so good years in a business cycle. To have accurate info about some company we have to minimize the effect of the short-term business cycle on the valuation. That was the problem that Shiller noticed. Instead of looking at just one year, he created the ratio that takes into consideration the average earnings over the past 10 years. This provides comparing valuations over a longer period of time.

    One disadvantage of the popular P/E ratio is that it is related to the past 12-months earnings only. But what if something temporary happens during that period? For instance, a big store-chain has to close some of them for restoring them. That would reduce the earning for sure but the company finished what was planned and made progress in earnings. But you didn’t buy a share of that company just because you made your decision based only on one metric – P/E ratio. And you missed the profit. By using the CAPE ratio you would be able to make a better choice.

    Ability of Forecasting

    The CAPE ratio showed its importance in recognizing possible bubbles and market crashes. It was determined that the historical average of the ratio for the S&P 500 Index was inside 15 and 16. The maximum levels of the ratio passed 30. The record-high levels occurred several times. The first was in 1929 before the Wall Street crash that flagged the Great Depression. The second occurred in the late 1990s and announced the Dotcom Crash. Also, we had signals before the 2007-2008 Financial Crisis.

    Speaking about investors and investments, there is held to be a relationship between the CAPE ratio and future earnings. Shiller noticed that lower ratios give higher returns for investors over time.

    Nevertheless, there are critiques regarding the use of the CAPE ratio in predicting earnings. The main problem is that the CAPE ratio does not calculate the moves in accounting reporting rules. For example, what if changes in the calculation of earnings under the GAAP appear? That could change the ratio and present a pessimistic sense of future earnings.

    Bottom line

    The CAPE isn’t the only metric you should use when investing but of course, it is one of. 

    It’s mostly used to the S&P 500, but can be applied to any stock index. The advantage is that it is one of several valuation metrics that can help you. It is important to find the current relationship between the price you pay for stock and future earnings. If the CAPE is high, and other measures are high, it is a good idea to cut your stock exposure. Also, you can invest in something cheaper.

    A savvy investor should always compare the price that pays and the value that gets. Regularly, all investors want to buy a company when its stock is trading at a low P/E ratio. That will give them a better profit.

    But that could be the problem too. When a recession, the stock will fall. At the same time, the company’s earnings will fall, and that can quickly raise the P/E ratio. But it is temporary. The consequence is that we are receiving a false signal that the market is expensive. And what we are doing? We don’t buy the stock when certainly it’s the best time to buy it. And here is the point where the CAPE ratio is fully useful.

    It shows a more realistic relationship between current prices and earnings based on 10-years average adjusted for inflation over the latest business cycle.

    When you are choosing which assets to sell, CAPE can be a great support. If you see that CAPE shows the S&P 500 is undervalued, sell bonds. And when CAPE shows the S&P 500 is overvalued, sell those holdings first.

  • 7Twelve Portfolio – Craig Israelsen Strategy

    7Twelve Portfolio – Craig Israelsen Strategy

    7Twelve Portfolio - Craig Israelsen Strategy
    The Israelsen 7Twelve is intended to protect the portfolio against losses. The portfolio has 7 different asset classes and 12 different funds. Each fund has the same weight of 8.3% or 1/12 of the overall portfolio.

    7Twelve, a multi-asset balanced portfolio, is developed by Craig Israelsen, Ph.D. in 2008, today he is a principal at Target Date Analytics. As a difference from a traditional two-asset 60/40 balanced fund, the 7Twelve strategy covers various asset classes in an investment portfolio. The purpose is to improve performance and reduce risk. This represents a totally new school of a balanced portfolio.

    The number 7 describes the number of asset classes proposed to add to your portfolio. The number 12 (twelve) outlines the number of separated mutual funds that fully represents the 7 asset classes in your portfolio. 

    The roots

    Craig Israelsen was a teaching family finance at Brigham Young University. One day he got an interesting question: What should be in a diversified portfolio? Even if he thought how the question is interesting,  Israelsen didn’t have the right answer at that very moment. The subject was so provocative that Israelsen developed a unique formula for portfolio diversification. It was 2008.

    which has been catching on with financial planners. The name 7Twelve Portfolio came from Israelsen himself.

    The reason is simple. His new portfolio consists of 12 equal parts of mutual funds pulled from seven fund types: real estate, natural resources, U.S. equity, non-U.S. equity,  U.S. bonds, non-U.S. bonds, and cash. But it was the first version based on historical data to 1970. Later, as the markets changed, he added U.S. midcap, emerging markets, natural resources, inflation-protected bonds, and non-U.S. bond funds.

    7Twelve strategy

    Each mutual fund in the 7Twelve strategy is equally weighted and represents 1/12th of the portfolio. This allocation is managed by adjusting the portfolio back to equal parts monthly, quarterly or annually.

    7Twelve model is the “core” of an investment portfolio. Any investor may add individualized assets around the core. But one thing is obvious, using 7Twelve can improve the efficiency and the portfolio performance for the investor because it is a strategic model and doesn’t rely on tactical moves or changes.

    Investing by using 7Twelve strategy

    There are some statistical data that support the idea of how Israelsen’s portfolio model is better than traditional. For example, if we observe the Vanguard Balanced Index fund (consists of 60% U.S. stocks and 40% U.S. bonds) from 1999 to the end of 2014, we will find that it had an average annual compound return of 5.7%. In the same period, the 7Twelve portfolio would return 7.6%, as Israelsen calculated it. The result showed that the 7Twelve portfolio had smaller losses in bad years,  and that is the point of a well-diversified portfolio, right?

    Some experts argued with Israelson, claiming that he made 7Twelve by back-testing which allocations have had the best performances in the recent past. If yes, why and how would he equally weight assets? In such a case, the returns would be different.

    The value of 7Twelve is its simplicity. Actually, it can be easily adjusted for each investor individually.

    The advantages

    7Twelve portfolio gives a wide diversification because all known asset classes are covered. So, you can get excellent diversification across many asset classes. Simplicity is a great part. It is so easy to follow 12 funds or ETFs, equal-weighted. Moreover, this model is one of the rare that includes mid-cap stocks. Maybe the most useful part is a great opportunity for rebalancing monthly, quarterly or annually. That possibility is giving reduced risk and increased returns.

    Rebalancing the 7Twelve Portfolio

    Rebalancing is an important part of the 7Twelve plan. It is very simple. All you have to do is bringing each of the 12 funds in your particular 7Twelve model back to their given allocation (1/12 or 8.33% in the core 7Twelve model). 

    For example, if you had some funds that performed better in the, let’s say the prior quarter, just deposit more into the funds that were underperformed in the same quarter. In this way, you are rebalancing the account of all funds in your portfolio. That is how you have to manage your portfolio, without emotions.

    Let’s say your investment 7Twelve portfolio is $10.000 worth. If you don’t re-balance it, you will lose 13 bps over 20 years. That is empirical evidence. In money, it is almost $920.

    The full info you can find HERE

    It is a strategic portfolio. All you have to do is to set the percentages and rebalance them when they get out of balance. And you can stay relaxed until some market events ask for you to rebalance. Generally, a good idea. Just view this portfolio graphically.

    Bottom line

    Every single investor would admit that diversified investing is a great and ultimate thing for everyone in the market. But the reality shows that the ordinary investor hasn’t too much experience in building a diversified investment portfolio. Most investors are holding a portfolio of several mutual funds. That isn’t diversification. 7Twelve provides investors the possibility to build a diversified, multi-asset portfolio.

    In many articles and books, Craig Israelsen explained how simple it is to maintain a strong portfolio with a plan. And it is. Moreover, it provides investors to reduce risks of investing.

    The deeply diversified portfolio avoids losses efficiently, decreasing the usual deviation of return, and frequency of losses. A well-diversified non-correlated portfolio provides a good return and low volatility. 

    What people don’t like about 7Twelve?  Firstly, some think there are too many commodities. 

    Secondly, some stated that this strategy is boring. Investors who like to check their portfolios every hour a diversified portfolio could be. The same comes to investors that like to detail-manage their investment.  But no one says this is an unreasonable portfolio. Contrary. Literally, you can find plenty of good portfolios and this is one of them. The main problem is that only a small number of investors have been using this portfolio for a long time despite the fact it is created more than 10 years ago. 

    The most important thing is to choose one and stick with it, through the highs and deeps.

  • Leveraged ETFs – How to Trade, Guide, Tips and Strategies

    Leveraged ETFs – How to Trade, Guide, Tips and Strategies

    (Updated October 2021)

    Leveraged ETFs - How to Trade, Guide, Tips and Strategies
    Two times leveraged ETF is a vehicle calibrated to 200% or double the gain or loss of the price movement

    Did you come across something called a leveraged ETFs?  What is leveraged ETF and how it is different from other ETFs? We found a lot of questions like these thanks to visitors to our website. We’ll try to make this closer to you especially if you are a beginner in this field. 

    Let’s take time to jump in and explore these somewhat new securities.

    Firstly, leveraged ETFs aren’t for long-term investors.

    When you are buying a leveraged ETF, you must know that you have to make short-term trade. As we said, it isn’t a long-term investment. For newbies, a short-term trade lasts from one day to several weeks, not longer. Don’t try to buy a leveraged ETF for a long-term investment. 

    They became one of the most successful varieties of ETFs in recent times. So, we can easily say that leveraged ETFs are a novelty. However, they can be difficult innovation. Well, they are not either good or harmful, all you need is to know them better to be able to trade. Here are some basics about leveraged ETFs.

    Let’s say the traditional ETF tracks one security in its underlying index, 1:1. As a difference, with leveraged ETF, you can strive for a 2:1 or even 3:1 ratio. A leveraged ETFs use financial derivatives to magnify the returns of an underlying index. 

    Leveraged ETFs are possible for the Nasdaq 100 and the Dow Jones Industrial Average, for example.

    Where is the advantage?

    Leveraged ETFs can help you to capitalize on the short-term momentum of a particular ETF. The main question is how to add leveraged ETFs into your portfolio?

    For example, the trader is assured that a particular stock will drop. And trader is shorting that stock. Besides, shorting stocks are bought on margin and the trader has to borrow the money from the broker. That is leverage.

    With leveraged ETF, you don’t need to buy the securities on margin, since it allows you to amplify your returns by multiples of over 1 up to 2 or 3 times. That depends on the ETF product you are trading. The amount of leverage will depend on your experience or temperament. Some less-experienced traders will choose lesser leverage, for example.

    But be aware, they are designed to return three times the inverse of the S&P 500 index. So, if the S&P 500 drops by 1%, this fund should rise by approximately 3%. And contrary, if the index rises by 1%, this fund should drop by about 3%.

    Leveraged ETFs have the aim to outperform the index or stock they track. 

    Also, there are inverse leveraged ETFs. They give multiple positive returns if some index decreases in value. They operate the same as normal inverse ETFs but designed for multiple returns.

    Leveraged ETFs are not suitable for beginner’s portfolio

    Please, don’t make a mistake. Yes, it is fascinating to have amplified returns but you should never add leveraged ETFs into your long-term portfolio. By buying them as a long-term investment you are making a foolish decision. To repeat, leveraged ETFs are not investments, they are speculation. Don’t mislead yourself.

    Moreover, the payoff may not be as bright as you predict. So, they are risky. You will have to pay management fees, brokerage commissions, taxes on capital gains. 

    Leveraged ETF surely has its purpose for short-term investing. For example, you can use it as a hedge to protect a short position. Yet, long-term investors should be careful with leveraged ETFs.

    Definitely, when things are going fabulous, leveraged ETFs are excellent investments. Over the first 6 months in 2017, the S&P 500 has returned a bit over 10% but the 3 times amplified leveraged ETF has returned approximately 30%.

    But, think about what happens when the market turns down. For example, the S&P 500 falls by 10%. A leveraged ETF tracking the index could fall by approximately 30%. Just think about these figures.

    How to make success in trading leveraged ETFs

    As experts recommended, start with small if you aren’t experienced enough. When your portfolio becomes larger add more shares. There will be more risks, of course. But you will diversify your trades. Some elite traders recommend starting with an account of $25.000 minimum. Less isn’t recommended due to trading ability and margin rules for smaller accounts. Moreover, a smaller amount may cause conflicts in your decisions. You’ll need space to make them. 

    Further, trade when the sentiment is low. It is the best opportunity to profit. Set a stop-loss to, let’s say, minus 2% or 2.5%. Follow the trend and enter the winning position. If your profit goes up, sell some of your winning positions. Do it on spikes. If you reach 2% of profit very quickly, sell half of your shares to move stops up to breakeven. This can be a no-lose trade.

    Read a lot about ETFs and leveraged ETFs and test some free trials to find the accurate one. Do your own homework, it is the best way.

    Always monitor leveraged ETFs on a daily basis. If you have to use a limit order on a position it is reasonable to sell your position since you can’t follow market makers strictly. If you want to turn trade, it is better to trade traditional ETFs. that will give you less profit, but more freedom. For leveraged ETFs, you will need to sit and look at the screen or phone almost all day long. Trading isn’t for everyone, at all. That job can be addictive. Take a break from time to time but don’t give up. If you made some mistakes, keep in mind why, when, what caused them. And learn how to avoid them.

    And buy when the ETFs are positive.

    Disagreements

    The leveraged ETFs are new and still developing, and the disagreements will change as time goes by.

    Yes, they will provide you 2 times bigger returns but not always.

    The typical fault is that leveraged returns are on a yearly basis. This is false. They provide multiplied returns on a daily basis. So, don’t look at the index’s yearly return of say 2% because the leveraged ETF will seemingly not have a return of 4% per year. Rather take a look at the daily returns during the year. However, something is more important. The multiple returns don’t mean you will have multiple profits. You may have multiple negative returns also. 

    Leveraged ETFs are high-risk due to their design. Also, some index-tracking malfunctions may occur as well as some other limitations.

    Bottom line

    These the most attractive ETFs in the market today have a great advantage of using. Traders can overcome some of the risks through diversification and leveraged ETFs are very suitable for that. Still, they are still adjusted for stocks only. Therefore if the stock market falls the ETFs will fall too. Anyway, you can enhance your trades if you spread the risk across other assets besides stocks. It’s easy to find ETFs assets like currencies, bonds, or commodities. That will help you to improve your portfolio diversification buying power (the last mentioned is for really aggressive traders).

    Leveraged ETFs are new products but they are providing more choices to manage risks and take profit. 

    They are a good option but what if you don’t want to enhance your buying power if the bear market is in play? That would require short positions to take advantage of the downside potential in the market.  A leveraged ETF could be a great answer in this situation, also.

  • Indicator Trading And How To Use It

    Indicator Trading And How To Use It

    Indicator Trading And How To Use It
    Indicators can help find some market tendencies but you must learn how to use them properly.

    Indicator trading means to use technical indicators to examine the stock price and ensure trade signals. Trading indicators handles stock price data utilizing mathematical formulas. In essence, indicators will show you an illustration of the mathematical formula and stock price data. But you have to be an experienced chart reader or elite trader to notice that indicators will not show you more than the simple price chart without indicators.

    But indicators may help to simplify it and that’s the reason why indicators are so attractive to fresh traders. Well, it is simpler to find an indicator that will define the trend or trend reversal than to learn how to examine and find a trend on the stock price chart.

    So, behind indicator trading lies the simplicity of using.

    Indicators will provide you a particular trade signal and alert you that is the time to enter a trade.

    We can say that technical indicators are primarily formulas that help to examine chart data. They are accurate, they are simple, also, they request less time and give direction to price charts. But here is the tricky part. Indicator trading doesn’t mean that you will have 100% successful trades.

    What are indicator trading strategies? 

    The main problem is that you can find numerous indicators and new indicators appear almost every day. But you can combine them and create an indicator trading strategy.

    For example, a crossover strategy which means that price or an indicator crosses way with different indicator. Let’s say that price crossing a moving average is one of the simplest indicator trading strategies.

    One of the variants of this strategy is when a shorter-term moving average crosses a longer-term moving average and it is so-called a moving average crossover.

    Some crossover signals combine an RSI moving above 70, for example, and then go back under. When you see this signal you can be sure that there is the overbought condition and a pullback will occur. Thus, when you see a drop under let’s say 20 or 30, and it is accompanied by a rally back over 20 or 30, it is an indication that the rally will come. 

    Also, you can use indicators as a tool to confirm your opinion in trading since they will show you reversals and downtrends. There is one thing you have to keep in mind, a lot of indicator trading strategies will not result in profit.

    What are the disadvantages of indicator trading?

    So, it is obvious that indicators have their flaws. The problem is that they make calculations based on historical prices, so they don’t provide any outside insights. If you practice indicator trading in the stock trading, technical indicators will never give you actual data about the company.

    Moreover, indicators usually come after the price chart. So, the following situation may occur. Let’s say the current price is changed for a short time and got back, but your indicators will be changed according to the previous price but you entered the trade based on them. What is likely to happen? Your entry point is wrong and you could end up with a loss.

    Lastly, indicators may oppose each other. Also, the same indicator may display different things at different times. And you have to recognize when they are accurate. 

    This is the reason why many traders have doubts about indicators. Yes, you can find various indicators or develop your own by using software but you have to use them properly.

    How to use indicators properly?

    Firstly, don’t expect a miracle from indicators. All you can expect is that your estimation will be a bit more accurate. But your decision shouldn’t be based on one particular indicator. The reason behind is that all indicators are not the same. Each of them has its own philosophy and mission, to be said.

    You can find many types of indicators, for example, trend indicators,  volatility indicators, oscillators, etc. But indicators are useful only if you use them in line with their design. For example, the trend indicator is adjusted to recognize and follow a trend. You cannot use it for the price in a range because you will miss its full potential. Another thing is very very important. Indicators may provide you faulty information if you don’t use them in a proper way.

    The benefit of indicator trading

    As we said above, they can simplify price moves. For newbies in the stock market indicators are easier to understand than the complicated price chart. But easy isn’t always profitable, you should know that and keep that in mind. 

    Indicators are outstanding tools for mastering how to find gaps or strengths in the stock price when trends are weakening. They can be very helpful for new traders that still have a problem to guess on a price chart. With the help of indicators, they could recognize the fine tunes they have not yet qualified themselves to notice on the price chart.

    How many trading indicators to use?

    In indicator trading, you will need several indicators to know when and how to enter the trade. If you use only one indicator it is possible to get false signals. A lot of them.

    For example, the MACD provides crossover signals and it is smart to sell when the MACD graph goes under the signal line. But if you are a really smart trader, you will not sell every single time when MACD shows that or you’ll have a lot of losing trades. So, you will need to use some other indicators as control or filter in order to recognize the trend. For example, the moving average can be useful. In this way, you’ll increase the number of valuable signals. Simple as that.

    But be cautious, if you use too many indicators you may overanalysis your chart. That can have a bad influence on your trade. 

    The experts’ recommendation is to use up to 5 indicators per trade. Actually, 3 indicators are quite good enough for a solid trading strategy.

    Bottom line

    The indicators are a key part of technical analysis, after all. But do you really need indicators for profitable trading? Actually, no. Surely, they can give you strongly aid and improve the results of your trading and they are worth using. On the other hand, never observe indicators as only and the most important part of trading. The truth is they can simplify your trading more than price action trading. But keep in mind, as we said, the simple isn’t always more profitable. 

    Use indicator trading to recognize occasions when to get in or out of the trade since it isn’t always visible in the price charts.
    In most cases, indicators will not tell you what the price chart is not telling you. Hence, use indicators if required. If you see they are not raising your profit, give up. 

    Is there any other reason you may have to use them? No.

  • How to Find Big Opportunities in Investing

    How to Find Big Opportunities in Investing

    How to Find Big Opportunities in Investing

    Everyone would like to know how to find big opportunities in investing. That’s the point, right? One of the best ways is to notify where traders are overreacting to the news.

    By Guy Avtalyon

    To find big opportunities in investing, other traders’ extreme fears will help you. For example, traders reacted to news that brokers were cutting their fees. But did you notice a massive rise in their stock price? During the past few weeks, online brokerage stock took hits.

    Let’s go step by step. When Charles Schwab announced it would cut all commissions for all trading, E-Trade, Interactive Brokers and TD Ameritrade fell. This news sent brokerage stocks lower because the traders overreacted.

    In that period, for example, TD Ameritrade (AMTD) dropped from $48 to $33. The other brokerages experienced a decline in stock price too. Interactive Brokers (IBKR) fell from nearly $54 to almost $45, Charles Schwab Corp. (SCHW) dropped from $43 to $35, etc.

    The traders responded to news that brokers are cutting their fees. They had fears about brokerage future without that income and started to sell. But the point is to overcome the fears and recognize the opportunity. When you recognize the bottom in some stocks you actually can see great returns. And let’s take a look at our example again.

    What happened with these stocks a bit more after?

    Charles Schwab moved from $35 to $42, TD Ameritrade moved from $33 to $39, Interactive Brokers stock rose from $45 to $48, etc. How did this happen? There are no tricks. When some stock becomes oversold and gets stretched in one direction too quickly, too far, you will notice bounce back. That is exactly the time when you have to buy the stock. So, you are profiting while others are feeling fears. 

    It is simple to recognize when the stock dropped on extreme fears. How to find those big opportunities in investing?

    Key technical pivot points 

    Bollinger Bands

    Let’s say you noticed that traders picked a moving average of 20 with two regular deviations up and under that average. When a stock reaches or enters the lower zone, you can be sure the stock is oversold.

    RSI and W%R

    Use RSI to confirm the indicators that are higher. The oversold condition will appear when RSI goes to or below its 30-line, also when W%R (Williams’ %R) comes to or up the -80-line the stock is considered to be oversold.

    MACD

    Moving Average Convergence-Divergence is helpful and simple. It helps to confirm the info we get from previously mentioned indicators. MACD is calculated by subtracting the 26-period EMA from the 12-period EMA (Exponential Moving Average). 

    How to identify investment opportunities?

    You will need a bit of magic to find big opportunities in investing.

    These four indicators must be matched with one another if you want this to work. They have to be aligned. And moreover, you don’t want to rely on one indicator. You must have all four.
    So, what we had with brokerages in October this year? Just to be said, we can use other examples, but this is fresh. We saw the stock dropped due to the fees-pricing fight. Though, we saw the precise time of extreme fear and, at the same time opportunity.

    When you see the stock dropped to its lower Bollinger Band, it is a sign that the stock is oversold. Use historical data for that stock and you will find that whenever the lower Bollinger Band is reached or entered the stock turned and bounced back higher from that point.

    Use RSI to find big opportunities in investing

    But you have to check RSI also. Find the confirmation on what Bollinger tells you. If the RSI is a below-set line the stock is oversold. That the confirmation of Bollinger Band’s story. Check this info in historical data to have a sense of how the stock was performing in case it had lower RSI and if the stock moved to its lower Band.
    If you see the stock bounced back higher quickly that is the confirmation and you should buy. 

    And as we mentioned before MACD and Williams’ %R have to confirm the described condition to be sure you can trade with 85% of success.

    Examples of how to find big opportunities in investing

    The list is really endless. Big investments may come fro different fields, different companies. For example, some small but developing company can be a better choice than a famous brand.
    In case you don’t believe this, let’s see what stats tell us. Small companies are the spine of any national economy. That’s the fact. Small companies employ many people, actually the majority. So, it is easy to conclude that the can be a big opportunity to invest in.
    Just keep in mind before you invest in one of them to examine its potential for growth, financial strength. When you go through this process try to find out how passionate management is about business, sometimes that will tell how serious they are about future growth and the company’s future. Especially if you want to invest in some startup.

    Big opportunities in investing can be detected in up to 85% of cases.
    Put all these indicators together with extreme traders’ fears based on news, and you will see how to find big opportunities in investing.

  • How to Calculate the Fair Value of Your Stock

    How to Calculate the Fair Value of Your Stock

    Fair value points to the genuine value of a stock or other security that is agreed between the two parties, the seller and the buyer. It can be calculated for the assets that are traded, but not for the products that are being liquidated. It can be a challenge to calculate the fair value if there are no obviously visible market prices. The point of this is to define the price or value that is fair for both sides, the seller will not be on the losing side, and the buyer will end with a satisfying price.

    For example, a trader Anna sells its stocks to the trader John at $50 per share. The trader John believes he could sell it at $70 per share once he gets them. So, John buys 1,000 shares at the price Anna is setting. It is a fair value because both sides agreed the price and the trade is beneficial for each of them.

    Intelligent investors

    How to calculate fair value?

    You can do it with comparable information, for example.

    Use respectable financial news and find the last closing price for the stock you want to buy. Say, you want to buy 100 shares of some company and the last closing price of their stocks was $30. The fair value of 100 shares would be 100 x 30 = $3,000.

    Also, you can calculate the fair value using the discounted cash flows.

    For example, you want to examine investment that offers a range of cash flows. And you can’t find anything comparable. So, how to calculate the fair value of the investment?

    Let’s say it is an investment of $10,000 and it generates $2,500 cash flow per year. What you have to do is to write down the cash flows for, let’s say, 5 years.

    $10,000

    1 – $2,500
    2 – $2,500
    3 – $2,500
    4 – $2,500
    5 – $2,500

    Assume that the rate of return is 6%, and first calculate the discount factor so that you could calculate the discounted cash flows for each year.

    For calculation purposes, the percentages need to be transformed into whole numbers. It is done by adding 100 to the number of percents and then dividing that sum by 100, i.e. (100+6)/100=1.06. Now you can calculate the discount factor for each year by rising to power of that year this number, i.e. to the power of 1 for 1st, to power of 2 for 2nd, and so on.

    That should look like this:

    1.06^1 = 1.06
    1.06^2 = 1.12
    1.06^3 = 1.19
    1.06^4 = 1.26
    1.06^5 = 1.34

    The next step is to divide every $2,500 cash flow by the discount factor for each of these five years.

    $2,500 / 1,06 = $2,359
    $2,500 / 1,12 = $2,232
    $2,500 / 1.18 = $2,100
    $2,500 / 1.26 = $1,984
    $2,500 / 1.34 = $1,866

    This produces five discounted cash flows of:  $2,359, $2,232, $2,119, $1,984, and $1,866.
    Add these five numbers to -10,000. That was the initial investment, do you remember? Let’s see the result.  The result is 541. This means that using a 6% rate of interest, the fair value of this particular stocks is $541.

    Also, you can calculate the fair value for a stock is by using the P/E (price to earnings) ratio.

    The formula to calculate the P/E ratio is 

    the current stock price per share / current earnings per share

    What you have to do is to compare P/E ratios among companies from the same industry. For example, if you want to find the fair value for a utility, you have to compare the P/E ratio to other P/E ratios in that industry.

    If the company has a high P/E ratio it usually means the company is overvalued. On the other hand, a low P/E ratio shows the company is undervalued. For example, if you hold a stake of shares in a company with a P/E ratio of 4 and the average P/E ratio for other companies in the same industry is 2, you can be sure that your stock is expensive or, in other words, overvalued.

    The next thing to do is to modify the stock price to the average P/E ratio. Let’s say the average P/E ratio is 2, and the P/E ratio on your stock is 4. This means the current price is $8 and earnings per share is $2. We know that by following the P/E ratio formula.

    Use the P/E calculation to find what the stock price needs to have a P/E ratio of 2. 

    The equation is 

    New P/E ratio x Earnings per share

    And the answer is 2 x $2 or $4. The fair value for this stock is $4, not $8.

    Bottom line

    The puzzle of what security is really worth is one of the basic questions in investing. By calculating fair value, you will find the answer, maybe not exactly but you will be very close to it. Although, fair value calculations are essential to any investor’s stock.

    Ways to fair value can classify value investors and growth investors. 

    The growth investors will estimate earnings that can be unstable. On the other hand, value investors will buy stocks at a discount to their fair value. They will wait for the fair value of their investments to rise.  But both kinds of investors have to know that their companies can stumble. Also, the company may get significantly bigger which will cause keeping historical growth rates difficult.

    The point is to buy stocks that will rise to meet the fair value of the company.


    You might find these interesting too:

    >>> The Average Daily Trading Volume How to Calculate

    >>> Calculate Portfolio Performance

    >>> Short Selling For Profit

    >>> Lot size in forex – What is it and How to calculate it?

  • How to Identify Market Trends

    How to Identify Market Trends

    6 min read

    By Guy Avtalyon

    Being able to identify stock market trends is a crucial part of your investments and trading. How many times have you heard that the market is trending? Numerous. But did you have the ability to recognize the signs before the market move in some direction?

    So, when we say the market is trending we are talking about market moving in one of two directions. When the market is moving up it is Bullish, but when it moves down it is a Bearish trend. There is some misunderstanding toward trends. Let’s say this way, never fight against market trends. That will take you to losses. Rather catch the flow to manage your risk-reward.

    It is so important to have ways to identify market trends. Markets can also move within a ‘range’, and they don’t need to be recognized as Bullish or Bearish, rather they are falling sideways. So, you can see we have three possible market directions. Ability to recognize when a market is probably moving out of a trend will also help you. 

    Assume you are trading while the market is in a Bullish trend. So your focus would be on buying the position. But suddenly the market starts to change and your edge disappears. 

    It is absolutely scary when you are looking at those changes at your charts. But there are several things that will provide you to know how to identify market trends.

    First, let’s make clear what the trends are you looking at.

    This is very important. You have to determine the time frame you are looking at. Why is this so important? Assume you are looking at a daily time frame and the market is in a bullish trend. Suddenly, the market moves up. Where is the problem? Your 10 minutes chart shows the bearish trend! Yes, but you must have a bigger picture. The market may be in bullish trend the whole day but in those 10 minutes, it is bearish because it is falling. 

    That is the nature of markets. They will never go only up or only down.

    That’s why the timeframe you are looking at is very important. Just like in sport. Your favorite basketball team is in permanent progress to the top of the table. In the market, it is a bullish trend. But suddenly, your team has a match against some outsider and they lost the game (which usually happen to my favorite team). That is a bearish trend in the market. 
    <

    How to Identify Market Trends

    Identifying the trend is essential. But you have to be able to associate that trend with your trading. For example, you recognize a market as bullish on the daily timeframe. What is the possible move? Just wait until it comes back within support levels that you expected to be the span where the buyers will continue the trend. Than start to look at the 1-hour timeframe to buy positions. That is how you may adjust your trades with the market trend.

    You can identify market trends by applying different kinds of technical analysis. You can use trendlines and technical indicators. But trendlines are the most effective method of verifying that a trend breathes. 

    Identifying the trends will help you to avoid wrong buy/sell signals. One thing is important to know, the trending indicator will operate better in trending markets, while oscillators are better in sideways trends. Which one to use may define your success rate.

    Recognizing Trends

    The trends are an overall direction that a particular financial market is moving. To analyze trend you have to use technical analysis to determine direction. Just connect by using trendline all the highs and lows in your charts.

    So, let’s see what kind of trends we have:

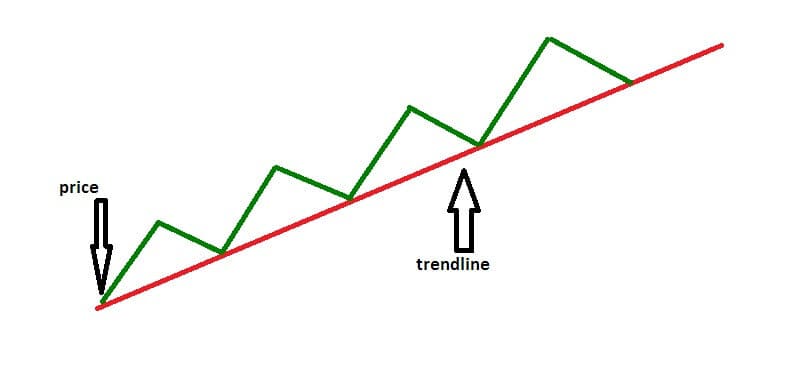
    Uptrend

    The uptrend is when you can inline low points sloping upward. The main characteristic of uptrend is higher highs and higher lows.

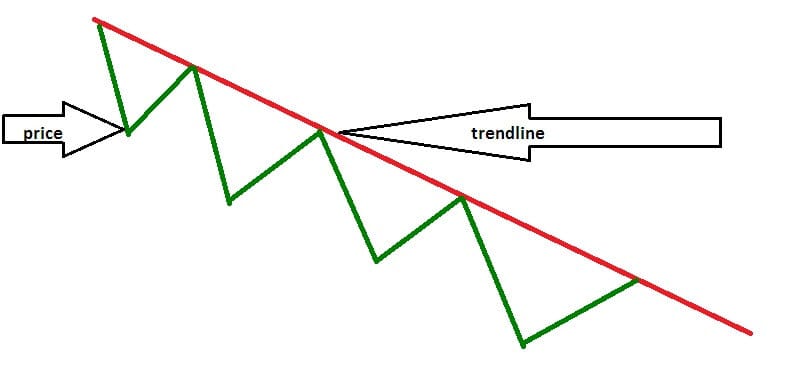
    Downtrend

    Connect a series of chart high points sloping downward, and you will have a downtrend. A downtrend is always defined by lower highs and lower lows.

    These graphs are simple images in order to have a clear picture. Trendline should be drawn on the candlestick chart. But in any case, to be able to start a trend line you will need at least two points in the market. You may draw the trendline only when the second swing high or low is identified.

    Speaking about the candlestick chart, you will see that the majority of trend lines overlap the high or low of a candle. The point is to get the maximum touches without cutting the body of a candle. If the trend line cut the body of a candle you may be sure it is a violation. 

    Identifying Market Trends

    Draw triangles on market swings. 

    We already mentioned the market swing points. I am free to say that probably the most obvious way to identify a market trend is to follow them. You can do it by drawing triangles.

    We already know that higher highs and higher lows relate to a Bullish trend and lower highs and lower to a Bearish trend. By drawing triangles over important market swings you will spot when this is occurring. This helps also to inform you when the market

    It will also keep you alert to when the market finish trending and moves into a range, or the trend goes reverses.

    Also, you may use the Bill Williams fractals indicator.

     It is an excellent tool to identify market trends. This indicator is helpful to spot the market swings. When the arrows are upward that is the high of the swing, when the arrows pointing downwards it is low of swing.

    Upward pointing arrows indicate the high of a swing, downward pointing arrows indicate the low of a swing. This is a simple tool that will show you if the market is in a trend. Moreover in what direction, or if it is in a range.

    Moving average as help on how to identify market trends

    The moving average is one of the most popular methods to identify market trends. When the market is beyond the level of the moving average, it is Bullish. If under, it is Bearish. But this method has some disadvantages. It depends on the period you are looking at. 

    One moving average can miss out on great parts of trends so you will end up struggling against the trend. It is always smart to apply two moving averages. One has to be slower the other faster. And, when the faster one is above slower the market is bullish when it is below the market is bearish.

    Use trend lines

    That’s why we had to explain the trend lines. Trend lines are a great tool to identify a market trend. Also, they will highlight potential trading zones inside the trend. The market is in trend when it respects the trend line.

    When the market breaks the trend line it is moving out of the trend into a range, or into a trend reversal.

    Bottom line

    Markets consist of many different varieties of trends. How to identify market trends will principally define the success or downfall of your investing. No matter if you are a long or short-term investor.