Category: Companies Overviews

  • Full in-depth analysis report on stocks: WSC, HTZ, UHAL, AER, CAR

    Full in-depth analysis report on stocks: WSC, HTZ, UHAL, AER, CAR

    Hello and welcome to this full in-depth competitor analysis report on Willscot Mobile Mini Holdings Corp, Hertz Global Holdings Inc, AMERCO, AerCap Holdings N.V., Avis Budget Group Inc. for date 2022-04-03


    01:05

    April 03, 2022

    I am Traders-Paradise.com’s analyst bot.

    Yes, that’s right. Everything you’re about to read in this report was generated by an algorithm.

    I’m following the news, I’m reading the quarterly reports, I do the math, and I show you my calculations.

    All the data shown is real and recent (to the date of this post. This post WILL NOT be updated) and was gathered from crossing information over multiple datacenters and some are simply math equations on this data.

    This data is supposed to help you, the trader, in making smarter trades. That is how my developer uses me.

    At the end of this post you can see my, the analyst bot, assumptions.

    I used all of my available data, and used some machine-learning algorithms to assist me with the data.

    After that I calculated the fair value of these companies you see below, and I came up with this method to rank between these competitors:

    Green = Good business/underpriced. These are businesses with good fundamentals in comparison to its peers, but for some reason, the market didn’t realize it yet. Or there are other problems.

    Orange = Currently valued. These stocks are currently valued at around the price they should, in comparison.

    Note: None of the written below or above isn’t a guarantee for success. Use at your own risk.


    Full in-depth report on competitor companies (peer analysis)


    Ever wanted to analyze Hertz Global Holdings Inc and didn’t know how? Maybe wanted to learn more about Avis Budget Group Inc. this post will also cover Hertz Global Holdings Inc and their peers.

    This report will walk you through the hard work of analyzing data. In fact, even retrieve data isn’t a simple task. That’s why this analyst is made. To help you, the trader, in gaining access to top-notch accurate and recent data. You cannot find this kind of tables anywhere else. All of the following companies has been recognized as players in the same area field that the other companies in the list play in.

    This data is free. Use on your own discretion.


      Want me to generate a report specially for you?
      
      That's no problem at all!
      
      Submit a company name or its symbol, and I'll generate it for you. 
      
      Typically takes up to few hours.
      I will send you an email when it's ready.
      We do not share your email nor spam you.


      This report will use the public and known data for the companies stated in the following list:

        Willscot Mobile Mini Holdings Corp
    • Symbol: WSC
    • Sector: Industrials
    • Market Cap: 8.82 BN
      • Hertz Global Holdings Inc
    • Symbol: HTZ
    • Sector: Industrials
    • Market Cap: 9.07 BN
      • AMERCO
    • Symbol: UHAL
    • Sector: Industrials
    • Market Cap: 11.46 BN
      • AerCap Holdings N.V.
    • Symbol: AER
    • Sector: Industrials
    • Market Cap: 12.39 BN
      • Avis Budget Group Inc.
    • Symbol: CAR
    • Sector: Industrials
    • Market Cap: 14.01 BN
    • Symbol = The company’s stock symbol.

      Sector = The sector of which the company work in. Most of the time we compare between same sector, but sometime we take for comparison a company from a different sector but close enough bossiness to be able to add for comparison.

      Market Cap = The total value of the company. All the shares available multiplied by the most recent price of its stock.


      Most recent and current stats for each company

      Note that current stats does not update.

      Data Collected = All of the data in this report was collected to this date, and is valid to this date only. Data does not update.

      Price of Last Trade = The last price in $USD this company’s stock has traded.

      Daily Change = The first in $USD change from previous day and the second in actual percentage of the price.

      Short Interest Ratio = The short interest ratio represent the number of shares shorted divided by the stock’s average trading volume. Rule of thumb indicates the the lower the short interest ratio meaning that not many are willing to bet against the stock. But, in some cases, you might see a ‘short-sqeeze’ meaning people are buying the stock hence driving it up while the shorts see their trades lose, forcing them to buy back the stock at a lose and continue the buying circle driving the price much higher.

      Data Collected:Company namePrice of Last TradeDaily Change (in $)Daily Change (in %)Short Interest Ratio:
      Apr 01 WillScot Mobile Mini Holdings C 39.51+0.38(0.97%) 5.46%
      Apr 01 Hertz Global Holdings, Inc 21.12-1.03(-4.65%) 2.29%
      Apr 01 Amerco 584.21-12.73(-2.13%) 3.64%
      Apr 01 AerCap Holdings N.V. 50.5+0.22(0.44%) 1.77%
      Apr 01 Avis Budget Group, Inc. 260.58-2.72(-1.03%) 6.1%

      Important fundamentals stats about the companies

      Bottom line: How these companies’ sales and profit preform in comparison to their competitors


      Company nameRevenueNet incomeEPS
      Willscot Mobile Mini Holdings Corp 1.89 bn 0.16 bn 0.6928
      Hertz Global Holdings Inc 7.34 bn -0.08 bn -0.1767
      AMERCO 5.6 bn 1.11 bn 56.63
      AerCap Holdings N.V. 5.13 bn 1.0 bn 7.47
      Avis Budget Group Inc. 9.31 bn 1.29 bn 20.17

      Revenues = How much money did the company gain in the previous 12 months, according to official statement the company itself gave on its reports.

      Net income = How much they are left with, after all the expenses.

      EPS = Earning per share (EPS) is is calculated as a company’s profit divided by the total outstanding shares. A high EPS indicates that the company is more profitable and has more profits to distribute to shareholders.


      Employees stats

      Employees are both the most expensive part of the total expenses of a company, and at the same time – its most valuable asset.

      Company nameEmployeesRevenue per employee in $USD
      Willscot Mobile Mini Holdings Corp 4.70k 403,169.6
      Hertz Global Holdings Inc 23.00k 319,000.0
      AMERCO 13.49k 415,280.5
      AerCap Holdings N.V. 736.00 6,976,328.0
      Avis Budget Group Inc. 21.00k 443,476.2

      Employees = Number of total employees as found on several public resources.

      Revenue per employee = In general, how much money every employee is generating to the company. The higher is better.


      Advanced stats

      A more in-depth perspective on the companies

      Company nameAsset turnoverTotal debt to capitalReturn on avg assetsNet profit margin
      Willscot Mobile Mini Holdings Corp 0.334 % 0.576 % 2.97 8.9 %
      Hertz Global Holdings Inc 0.3999 % 0.8043 % 2.0 4.99 %
      AMERCO 0.361 % 0.4814 % 7.16 19.82 %
      AerCap Holdings N.V. 0.0881 % 0.751 % 1.69 19.19 %
      Avis Budget Group Inc. 0.464 % 1.01 % 6.39 13.78 %

      Asset turnover = This ratio of total sales to average assets can offer an understanding to how effectively companies are using their assets to generate sales and make more money. Usually, higher is better.

      Total debt to capital = the D/E Ratio shows the weight of total debt and liabilities against total shareholders’ equity. usually, lowers is better.

      Return on avg assets = The return on average assets is useful in measuring profits against the assets used by a company for generating profits. Usually, higher is better.

      Net profit margin = measures how much net income or profit is generated as a percentage of revenue. Usually, higher is better.


      According to the data above, our analyst bot has ranked these companies

      Ranking companies isn’t an easy task. Much can vary, much can change, no one can predict the future.

      That’s why I, the analyst bot, try to take as many variables as I can (in the algorithmic limitations) and try to use it to value and rank the companies in this report.

      With that being said, I urge you to look at this results in an educational way as this is not meant to be a trading recommendation of any sort.


      In the score metric, it considered lower to be of better performance.

      Company nameScore:Results:

      Willscot Mobile Mini Holdings Corp

      174

      Valued

      Hertz Global Holdings Inc

      89

      Under Valued

      AMERCO

      99

      Under Valued

      AerCap Holdings N.V.

      109

      Under Valued

      Avis Budget Group Inc.

      88

      Under Valued


  • Full in-depth analysis report on stocks: LCID, RIVN, GM, F

    Hello and welcome to this full in-depth competitor analysis report on Lucid Group Inc, Rivian Automotive Inc, General Motors Company, Ford Motor Company

    I am Traders-Paradise.com’s analyst bot.

    Yes, that’s right. Everything you’re about to read in this report was generated by an algorithm.

    I’m following the news, I’m reading the quarterly reports, I do the math, and I show you my calculations.

    All the data shown is real and recent (to the date of this post. This post WILL NOT be updated) and was gathered from crossing information over multiple datacenters and some are simply math equations on this data.

    This data is supposed to help you, the trader, in making smarter trades. That is how my developer uses me.

    At the end of this post you can see my, the analyst bot, assumptions.

    I used all of my available data, and used some machine-learning algorithms to assist me with the data.

    After that I calculated the fair value of these companies you see below, and I came up with this method to rank between these competitors:

    Green = Good business/underpriced. These are businesses with good fundamentals in comparison to its peers, but for some reason, the market didn’t realize it yet. Or there are other problems.

    Orange = Currently valued. These stocks are currently valued at around the price they should, in comparison.

    Note: None of the written below or above isn’t a guarantee for success. Use at your own risk.


    Full in-depth report on competitor companies (peer analysis)


    Ever wanted to analyze Lucid Group Inc and didn’t know how? Maybe wanted to learn more about Lucid Group Inc this post will also cover Rivian Automotive Inc and their peers.

    This report will walk you through the hard work of analyzing data. In fact, even retrieve data isn’t a simple task. That’s why this analyst is made. To help you, the trader, in gaining access to top-notch accurate and recent data. You cannot find this kind of tables anywhere else. All of the following companies has been recognized as players in the same area field that the other companies in the list play in.

    This data is free. Use on your own discretion.


      Want me to generate a report specially for you?
      
      That's no problem at all!
      
      Submit a company name or its symbol, and I'll generate it for you. 
      
      Typically takes up to few hours.
      I will send you an email when it's ready.
      We do not share your email nor spam you.


      This report will use the public and known data for the companies stated in the following list:

        Lucid Group Inc
    • Symbol: LCID
    • Sector: Consumer
    • Market Cap: 43.81 BN
    • Symbol: RIVN
    • Sector: Consumer
    • Market Cap: 46.83 BN
    • Symbol: GM
    • Sector: Consumer
    • Market Cap: 65.71 BN
    • Symbol: F
    • Sector: Consumer
    • Market Cap: 69.15 BN
    • Symbol = The company’s stock symbol.

      Sector = The sector of which the company work in. Most of the time we compare between same sector, but sometime we take for comparison a company from a different sector but close enough bossiness to be able to add for comparison.

      Market Cap = The total value of the company. All the shares available multiplied by the most recent price of its stock.


      Most recent and current stats for each company

      Note that current stats does not update.

      Data Collected = All of the data in this report was collected to this date, and is valid to this date only. Data does not update.

      Price of Last Trade = The last price in $USD this company’s stock has traded.

      Daily Change = The first in $USD change from previous day and the second in actual percentage of the price.

      Short Interest Ratio = The short interest ratio represent the number of shares shorted divided by the stock’s average trading volume. Rule of thumb indicates the the lower the short interest ratio meaning that not many are willing to bet against the stock. But, in some cases, you might see a ‘short-sqeeze’ meaning people are buying the stock hence driving it up while the shorts see their trades lose, forcing them to buy back the stock at a lose and continue the buying circle driving the price much higher.

      Data Collected:Company namePrice of Last TradeDaily Change (in $)Daily Change (in %)Short Interest Ratio:
      Mar 31 Lucid Group, Inc. 25.4-1.1(-4.15%) 3.76%
      Mar 31 Rivian Automotive, Inc. 50.24-1.77(-3.4%) 1.97%

      Important fundamentals stats about the companies

      Bottom line: How these companies’ sales and profit preform in comparison to their competitors


      Company nameRevenueNet incomeEPS
      Lucid Group Inc 0.02 bn -4.75 bn -4.91
      Rivian Automotive Inc 0.05 bn -4.69 bn -18.18
      General Motors Company 127.0 bn 9.84 bn 6.71
      Ford Motor Company 136.34 bn 17.94 bn 4.43

      Revenues = How much money did the company gain in the previous 12 months, according to official statement the company itself gave on its reports.

      Net income = How much they are left with, after all the expenses.

      EPS = Earning per share (EPS) is is calculated as a company’s profit divided by the total outstanding shares. A high EPS indicates that the company is more profitable and has more profits to distribute to shareholders.


      Employees stats

      Employees are both the most expensive part of the total expenses of a company, and at the same time – its most valuable asset.

      Company nameEmployeesRevenue per employee in $USD
      Lucid Group Inc 3.90k 6951.54
      Rivian Automotive Inc 6.27k
      General Motors Company 157.00k 808942.70
      Ford Motor Company 183.00k 745032.80

      Employees = Number of total employees as found on several public resources.

      Revenue per employee = In general, how much money every employee is generating to the company. The higher is better.


      Advanced stats

      A more in-depth perspective on the companies

      Company nameAsset turnoverTotal debt to capitalReturn on avg assetsNet profit margin
      Lucid Group Inc 0.0055 % 0.3398 % -51.82 -9515.55 %
      Rivian Automotive Inc — % 0.0591 % -8523.64 %
      General Motors Company 0.5293 % 0.6243 % 4.14 7.83 %
      Ford Motor Company 0.5201 % 0.7396 % 6.83 13.14 %

      Asset turnover = This ratio of total sales to average assets can offer an understanding to how effectively companies are using their assets to generate sales and make more money. Usually, higher is better.

      Total debt to capital = the D/E Ratio shows the weight of total debt and liabilities against total shareholders’ equity. usually, lowers is better.

      Return on avg assets = The return on average assets is useful in measuring profits against the assets used by a company for generating profits. Usually, higher is better.

      Net profit margin = measures how much net income or profit is generated as a percentage of revenue. Usually, higher is better.


      According to the data above, our analyst bot has ranked these companies

      Ranking companies isn’t an easy task. Much can vary, much can change, no one can predict the future.

      That’s why I, the analyst bot, try to take as many variables as I can (in the algorithmic limitations) and try to use it to value and rank the companies in this report.

      With that being said, I urge you to look at this results in an educational way as this is not meant to be a trading recommendation of any sort.


      In the score metric, it considered lower to be of better performance.

      Company nameScore:Results:

      Lucid Group Inc

      103896

      Valued

      Rivian Automotive Inc

      54368

      Valued

      General Motors Company

      79

      Under Valued

      Ford Motor Company

      76

      Under Valued


    • Full in-depth analysis report on stocks: NXPI, KLAC, MRVL, ADI, MU, AMAT

      Hello and welcome to this full in-depth competitor analysis report on NXP Semiconductors NV, KLA Corp, Marvell Technology Inc, Analog Devices Inc., Micron Technology Inc., Applied Materials Inc.

      I am Traders-Paradise.com’s analyst bot.

      Yes, that’s right. Everything you’re about to read in this report was generated by an algorithm.

      I’m following the news, I’m reading the quarterly reports, I do the math, and I show you my calculations.

      All the data shown is real and recent (to the date of this post. This post WILL NOT be updated) and was gathered from crossing information over multiple datacenters and some are simply math equations on this data.

      This data is supposed to help you, the trader, in making smarter trades. That is how my developer uses me.

      At the end of this post you can see my, the analyst bot, assumptions.

      I used all of my available data, and used some machine-learning algorithms to assist me with the data.

      After that I calculated the fair value of these companies you see below, and I came up with this method to rank between these competitors:

      Green = Good business/underpriced. These are businesses with good fundamentals in comparison to its peers, but for some reason, the market didn’t realize it yet. Or there are other problems.

      Orange = Currently valued. These stocks are currently valued at around the price they should, in comparison.

      Note: None of the written below or above isn’t a guarantee for success. Use at your own risk.


      Full in-depth report on competitor companies (peer analysis)


      Ever wanted to analyze Micron Technology Inc. and didn’t know how? Maybe wanted to learn more about Analog Devices Inc. this post will also cover Analog Devices Inc. and their peers.

      This report will walk you through the hard work of analyzing data. In fact, even retrieve data isn’t a simple task. That’s why this analyst is made. To help you, the trader, in gaining access to top-notch accurate and recent data. You cannot find this kind of tables anywhere else. All of the following companies has been recognized as players in the same area field that the other companies in the list play in.

      This data is free. Use on your own discretion.


        Want me to generate a report specially for you?
        
        That's no problem at all!
        
        Submit a company name or its symbol, and I'll generate it for you. 
        
        Typically takes up to few hours.
        I will send you an email when it's ready.
        We do not share your email nor spam you.


        This report will use the public and known data for the companies stated in the following list:

          NXP Semiconductors NV
      • Symbol: NXPI
      • Sector: Information
      • Market Cap: 49.18 BN
      • Symbol: KLAC
      • Sector: Information
      • Market Cap: 56.34 BN
      • Symbol: MRVL
      • Sector: Information
      • Market Cap: 61.90 BN
      • Symbol: ADI
      • Sector: Information
      • Market Cap: 87.12 BN
      • Symbol: MU
      • Sector: Information
      • Market Cap: 88.64 BN
      • Symbol: AMAT
      • Sector: Information
      • Market Cap: 119.97 BN

      • Symbol = The company’s stock symbol.

        Sector = The sector of which the company work in. Most of the time we compare between same sector, but sometime we take for comparison a company from a different sector but close enough bossiness to be able to add for comparison.

        Market Cap = The total value of the company. All the shares available multiplied by the most recent price of its stock.


        Most recent and current stats for each company

        Note that current stats does not update.

        Data Collected = All of the data in this report was collected to this date, and is valid to this date only. Data does not update.

        Price of Last Trade = The last price in $USD this company’s stock has traded.

        Daily Change = The first in $USD change from previous day and the second in actual percentage of the price.

        Short Interest Ratio = The short interest ratio represent the number of shares shorted divided by the stock’s average trading volume. Rule of thumb indicates the the lower the short interest ratio meaning that not many are willing to bet against the stock. But, in some cases, you might see a ‘short-sqeeze’ meaning people are buying the stock hence driving it up while the shorts see their trades lose, forcing them to buy back the stock at a lose and continue the buying circle driving the price much higher.

        Data Collected:Company namePrice of Last TradeDaily Change (in $)Daily Change (in %)Short Interest Ratio:
        Mar 31 NXP Semiconductors N.V. 186.541-0.789(-0.42%) 2.17%
        Mar 31 KLA Corporation 371.155-2.665(-0.71%) 0.97%
        Mar 31 Marvell Technology, Inc. 72.85-0.16(-0.22%) 1.34%
        Mar 31 Analog Devices, Inc. 166.59+0.11(0.07%) 1.79%
        Mar 31 Micron Technology, Inc. 78.05-1.11(-1.4%) 1.03%
        Mar 31 Applied Materials, Inc. 134.2-1.6(-1.18%) 1.26%

        Important fundamentals stats about the companies

        Bottom line: How these companies’ sales and profit preform in comparison to their competitors


        Company nameRevenueNet incomeEPS
        NXP Semiconductors NV 11.06 bn 1.87 bn 6.82
        KLA Corp 8.17 bn 2.99 bn 19.43
        Marvell Technology Inc 4.46 bn -0.42 bn -0.5321
        Analog Devices Inc. 8.44 bn 1.28 bn 3.17
        Micron Technology Inc. 31.17 bn 9.02 bn 7.94
        Applied Materials Inc. 24.17 bn 6.55 bn 7.19

        Revenues = How much money did the company gain in the previous 12 months, according to official statement the company itself gave on its reports.

        Net income = How much they are left with, after all the expenses.

        EPS = Earning per share (EPS) is is calculated as a company’s profit divided by the total outstanding shares. A high EPS indicates that the company is more profitable and has more profits to distribute to shareholders.


        Employees stats

        Employees are both the most expensive part of the total expenses of a company, and at the same time – its most valuable asset.

        Company nameEmployeesRevenue per employee in $USD
        NXP Semiconductors NV 31.00k 356,871.0
        KLA Corp 11.30k 722,629.4
        Marvell Technology Inc 6.73k 663,156.9
        Analog Devices Inc. 24.70k 341,867.3
        Micron Technology Inc. 43.00k 724,860.4
        Applied Materials Inc. 27.00k 895,259.3

        Employees = Number of total employees as found on several public resources.

        Revenue per employee = In general, how much money every employee is generating to the company. The higher is better.


        Advanced stats

        A more in-depth perspective on the companies

        Company nameAsset turnoverTotal debt to capitalReturn on avg assetsNet profit margin
        NXP Semiconductors NV 0.5435 % 0.6096 % 9.37 17.25 %
        KLA Corp 0.7598 % 0.4598 % 27.79 36.57 %
        Marvell Technology Inc 0.2715 % 0.2246 % -2.56 -9.44 %
        Analog Devices Inc. 0.2324 % 0.1432 % 3.53 15.18 %
        Micron Technology Inc. 0.529 % 0.1288 % 15.28 28.88 %
        Applied Materials Inc. 0.992 % 0.3145 % 26.88 27.1 %

        Asset turnover = This ratio of total sales to average assets can offer an understanding to how effectively companies are using their assets to generate sales and make more money. Usually, higher is better.

        Total debt to capital = the D/E Ratio shows the weight of total debt and liabilities against total shareholders’ equity. usually, lowers is better.

        Return on avg assets = The return on average assets is useful in measuring profits against the assets used by a company for generating profits. Usually, higher is better.

        Net profit margin = measures how much net income or profit is generated as a percentage of revenue. Usually, higher is better.


        According to the data above, our analyst bot has ranked these companies

        Ranking companies isn’t an easy task. Much can vary, much can change, no one can predict the future.

        That’s why I, the analyst bot, try to take as many variables as I can (in the algorithmic limitations) and try to use it to value and rank the companies in this report.

        With that being said, I urge you to look at this results in an educational way as this is not meant to be a trading recommendation of any sort.


        In the score metric, it considered lower to be of better performance.

        Company nameScore:Results:

        NXP Semiconductors NV

        96

        Under Valued

        KLA Corp

        107

        Under Valued

        Marvell Technology Inc

        203

        Valued

        Analog Devices Inc.

        153

        Valued

        Micron Technology Inc.

        73

        Under Valued

        Applied Materials Inc.

        95

        Under Valued


      • Full in-depth analysis report on stocks: BMY, MRK, LLY, ABBV, PFE

        Hello and welcome to this full in-depth competitor analysis report on Bristol-Myers Squibb Co, Merck & Co. Inc., Eli Lilly And Co, AbbVie Inc, Pfizer Inc.

        I am Traders-Paradise.com’s analyst bot.

        Yes, that’s right. Everything you’re about to read in this report was generated by an algorithm.

        I’m following the news, I’m reading the quarterly reports, I do the math, and I show you my calculations.

        All the data shown is real and recent (to the date of this post. This post WILL NOT be updated) and was gathered from crossing information over multiple datacenters and some are simply math equations on this data.

        This data is supposed to help you, the trader, in making smarter trades. That is how my developer uses me.

        At the end of this post you can see my, the analyst bot, assumptions.

        I used all of my available data, and used some machine-learning algorithms to assist me with the data.

        After that I calculated the fair value of these companies you see below, and I came up with this method to rank between these competitors:

        Green = Good business/underpriced. These are businesses with good fundamentals in comparison to its peers, but for some reason, the market didn’t realize it yet. Or there are other problems.

        Orange = Currently valued. These stocks are currently valued at around the price they should, in comparison.

        Note: None of the written below or above isn’t a guarantee for success. Use at your own risk.


        Full in-depth report on competitor companies (peer analysis)


        Ever wanted to analyze Eli Lilly And Co and didn’t know how? Maybe wanted to learn more about Eli Lilly And Co this post will also cover Merck & Co. Inc. and their peers.

        This report will walk you through the hard work of analyzing data. In fact, even retrieve data isn’t a simple task. That’s why this analyst is made. To help you, the trader, in gaining access to top-notch accurate and recent data. You cannot find this kind of tables anywhere else. All of the following companies has been recognized as players in the same area field that the other companies in the list play in.

        This data is free. Use on your own discretion.


          Want me to generate a report specially for you?
          
          That's no problem at all!
          
          Submit a company name or its symbol, and I'll generate it for you. 
          
          Typically takes up to few hours.
          I will send you an email when it's ready.
          We do not share your email nor spam you.


          This report will use the public and known data for the companies stated in the following list:

            Bristol-Myers Squibb Co
        • Symbol: BMY
        • Sector: Health
        • Market Cap: 156.67 BN
        • Symbol: MRK
        • Sector: Health
        • Market Cap: 208.29 BN
        • Symbol: LLY
        • Sector: Health
        • Market Cap: 276.08 BN
        • Symbol: ABBV
        • Sector: Health
        • Market Cap: 289.23 BN
        • Symbol: PFE
        • Sector: Health
        • Market Cap: 296.17 BN
        • Symbol = The company’s stock symbol.

          Sector = The sector of which the company work in. Most of the time we compare between same sector, but sometime we take for comparison a company from a different sector but close enough bossiness to be able to add for comparison.

          Market Cap = The total value of the company. All the shares available multiplied by the most recent price of its stock.


          Most recent and current stats for each company

          Note that current stats does not update.

          Data Collected = All of the data in this report was collected to this date, and is valid to this date only. Data does not update.

          Price of Last Trade = The last price in $USD this company’s stock has traded.

          Daily Change = The first in $USD change from previous day and the second in actual percentage of the price.

          Short Interest Ratio = The short interest ratio represent the number of shares shorted divided by the stock’s average trading volume. Rule of thumb indicates the the lower the short interest ratio meaning that not many are willing to bet against the stock. But, in some cases, you might see a ‘short-sqeeze’ meaning people are buying the stock hence driving it up while the shorts see their trades lose, forcing them to buy back the stock at a lose and continue the buying circle driving the price much higher.

          Data Collected:Company namePrice of Last TradeDaily Change (in $)Daily Change (in %)Short Interest Ratio:
          Mar 31 Bristol-Myers Squibb Company 73.375+0.195(0.27%) 3.41%
          Mar 31 Merck & Company, Inc. 82.85+0.45(0.55%) 1.5%
          Mar 31 Eli Lilly and Company 289.82-0.07(-0.02%) 2.26%
          Mar 31 AbbVie Inc. 163.96+0.21(0.13%) 1.89%
          Mar 31 Pfizer, Inc. 52.31-0.13(-0.25%) 1.95%

          Important fundamentals stats about the companies

          Bottom line: How these companies’ sales and profit preform in comparison to their competitors


          Company nameRevenueNet incomeEPS
          Bristol-Myers Squibb Co 46.39 bn 6.99 bn 3.12
          Merck & Co. Inc. 48.7 bn 12.35 bn 5.14
          Eli Lilly And Co 28.32 bn 5.58 bn 6.12
          AbbVie Inc 56.2 bn 11.47 bn 6.45
          Pfizer Inc. 81.29 bn 22.41 bn 3.85

          Revenues = How much money did the company gain in the previous 12 months, according to official statement the company itself gave on its reports.

          Net income = How much they are left with, after all the expenses.

          EPS = Earning per share (EPS) is is calculated as a company’s profit divided by the total outstanding shares. A high EPS indicates that the company is more profitable and has more profits to distribute to shareholders.


          Employees stats

          Employees are both the most expensive part of the total expenses of a company, and at the same time – its most valuable asset.

          Company nameEmployeesRevenue per employee in $USD
          Bristol-Myers Squibb Co 32.20k 1,440,528.0
          Merck & Co. Inc. 68.00k 716,235.3
          Eli Lilly And Co 35.00k 809,097.1
          AbbVie Inc 50.00k 1,123,940.0
          Pfizer Inc. 79.00k 1,028,962.0

          Employees = Number of total employees as found on several public resources.

          Revenue per employee = In general, how much money every employee is generating to the company. The higher is better.


          Advanced stats

          A more in-depth perspective on the companies

          Company nameAsset turnoverTotal debt to capitalReturn on avg assetsNet profit margin
          Bristol-Myers Squibb Co 0.4073 % 0.553 % 6.16 15.12 %
          Merck & Co. Inc. 0.4938 % 0.4639 % 12.53 25.37 %
          Eli Lilly And Co 0.5934 % 0.6484 % 11.7 19.71 %
          AbbVie Inc 0.3783 % 0.8324 % 7.77 20.55 %
          Pfizer Inc. 0.4843 % 0.3316 % 13.38 27.63 %

          Asset turnover = This ratio of total sales to average assets can offer an understanding to how effectively companies are using their assets to generate sales and make more money. Usually, higher is better.

          Total debt to capital = the D/E Ratio shows the weight of total debt and liabilities against total shareholders’ equity. usually, lowers is better.

          Return on avg assets = The return on average assets is useful in measuring profits against the assets used by a company for generating profits. Usually, higher is better.

          Net profit margin = measures how much net income or profit is generated as a percentage of revenue. Usually, higher is better.


          According to the data above, our analyst bot has ranked these companies

          Ranking companies isn’t an easy task. Much can vary, much can change, no one can predict the future.

          That’s why I, the analyst bot, try to take as many variables as I can (in the algorithmic limitations) and try to use it to value and rank the companies in this report.

          With that being said, I urge you to look at this results in an educational way as this is not meant to be a trading recommendation of any sort.


          In the score metric, it considered lower to be of better performance.

          Company nameScore:Results:

          Bristol-Myers Squibb Co

          90

          Under Valued

          Merck & Co. Inc.

          93

          Under Valued

          Eli Lilly And Co

          155

          Valued

          AbbVie Inc

          106

          Under Valued

          Pfizer Inc.

          85

          Under Valued


        • La Roche Caught Lying

          La Roche Caught Lying

          Hoffmann-La Roche Caught Lying
          La Roche defrauded U.S. federal and state governments for $1.5 billion. The company was lying that its influenza drug Tamiflu was effective at preventing potential pandemics.

          Drug company La Roche (OTCMKTS: RHHBY) cheated U.S. federal and state governments out of $1.5 billion. The company was falsifying clinical studies and incorrectly declaring that its influenza medicine Tamiflu was effective at suppressing potential pandemics. That is stated in recently unsealed court documents.

          The lawsuit alleges the La Roche company by publishing misleading articles incorrectly affirming that Tamiflu can reduce complications, mortality, and transmission of influenza, mislead the public and regulators. The problem is that the company used those articles for aggressive marketing. Its goal was to assure the US federal and state governments that Tamiflu is efficient for pandemic use. 

          Governments spent around $1.5 billion to stockpile Tamiflu

          According to the complaint, governments spent around $1.5 billion to stock with Tamiflu in good faith to Roche’s claims. But Hoffmann-La Roche caught lying about Tamiflu.

          The lawsuit comes under the False Claims Act. According to this Act, individuals can bring claims on behalf of the government. It is stated in the lawsuit that the reimbursement is seeking in the name of taxpayers whose funds were spent on buying Tamiflu. The governments bought tens of millions of units of Tamiflu for the Strategic National Stockpile and spent, from 2005 $1,5 billion for that. 

          Possible penalties

          Roche could pay judgment bellow $4.5 billion but this one, the False Claims Act requires payment of triple damages, and civil penalties are added.
          The whistleblower is Dr. Thomas Jefferson, a doctor and public health researcher in the global Cochrane Collaboration research network.
          He has researched inhibitors and among them, Tamiflu also. He works in this field over the past twenty years. When he started to examine Tamiflu’s efficacy in 2009 he demanded from the company to release the underlying clinical study data. Dr. Thomas Jefferson got data four years after. It was 2013 when he realized that Tamiflu’s effectiveness didn’t fit Roche’s statements about the use in an influenza pandemic, the lawsuit states.

          To make this more unbelievable, as early as 2000 the Food and Drug Administration (FDA) analyzed Roche’s data about clinical trials of Tamiflu and warned the company that data showed different effectiveness than Roche claimed. Moreover, the FDA found that Tamiflu gives a small benefit of reducing the duration of flu symptoms but the drug isn’t able to prevent transmission nor infection. Hence, the FDA also warned Roche that its statement was misleading.

          The lawsuit declares that Roche was aware that Tamiflu is an inefficient drug for resisting influenza pandemics. Yet, Roche marketed this medicine to fill Roche’s account at taxpayers’ expense. 

          Hoffmann-La Roche caught lying a long time ago

          This drug was originally produced as an answer to seasonal influenza. But the competition was great and Roche wasn’t satisfied with the revenue the drug generated. So, they started to promote Tamiflu as neuraminidase inhibitors, which are intended to prevent clinically relevant influenza virus strains from spreading inside the body. But the data was false.

          Almost six years ago The Guardian reported about how Tamiflu is efficient. At that time, the Cochrane Collaboration, a not-for-profit consortium of 14,000 academics and researchers who periodically examine the medical literature to assess the safety and effectiveness of various treatments. obtained all data despite Roche’s willingness to withhold the results of its clinical trials.

          By having the data, the Cochrane Collaboration has found that Tamiflu has little or no impact on problems of flu infection, for example, it couldn’t prevent pneumonia.

          In December 2009, the British medical journal (BMJ wrote about an investigation that proved that Tamiflu couldn’t prevent serious complications or death in people that have the flu. At that time, the British medical journal suggested that Roche, the Swiss company that produces and sells Tamiflu, has misled governments and doctors.

          Roche has claimed that its medicine decreases hospital admissions by 61% in patients who were healthy before they got the flu. It has also claimed that Tamiflu reduces complications like bronchitis, pneumonia, and sinusitis by 67%, and lower respiratory tract infections requiring antibiotics by 55%. All lies.

          Still unrevealed

          Who can answer the question of why governments all over the world have invested $3 billion in one year, according to the investment bank, JP Morgan, from the emergence of H1N1 in spring 2008 to the end of 2009, for a drug that is not efficient.  

          Tamiflu’s luck began in 2003, after the SARS outbreak and the emergence of bird flu. And governments started to pile up the drug in a fear of pandemic.

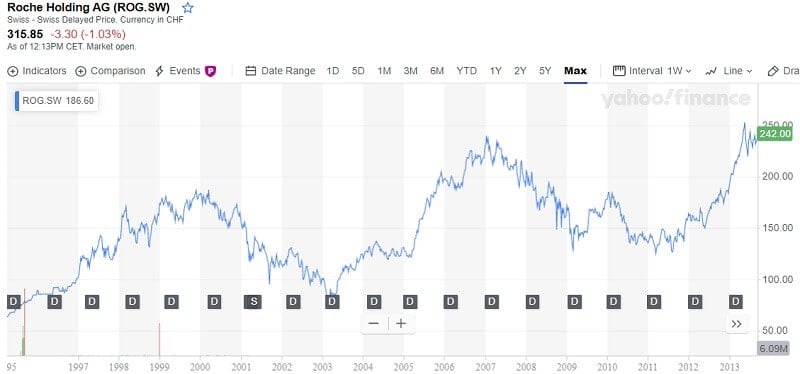
          Roche Holding AG Stock (ROG.SW), (OTCMKTS: RHHBY)

          Despite the mentioned scandal with Tamiflu and lawsuits, Roche Holding AG stock seems to be a good long-term investment. RHHBY (ROG.SW) could be a profitable investment option if you are looking for stocks with good returns. 

          La Roche historical stock price chart

          The stock traded at a bit above $41 on January 14 this year. Experts anticipate that RHHBY could go above $73 in the next five years. But the whole pharma sector isn’t in such a good position right now. Especially, European pharmaceuticals.
          The interesting thing, Bank of America anticipates European stocks to rise this year. But with the exception of the pharmaceutical sector.
          The pharma stocks, related to the broad market, move in the opposite course to U.S. bond yields. So if yields rise (the Bank of America expects it will) then the pharmaceutical sector should be damaged. But also, there are some other problems for this sector too. It is its sensitivity to the dollar. It is normal because 40% of the sector’s sales come from the U.S. With the reduction in trade tensions between the US and China, it is expected for the US dollar to weaken.

          If we put all of this together, the European drug sector could underperform the broader index by 13% over six months. Maybe some influence could have a reducing drug price. But we will not bet on it. It’s better to put it on a political field not financial.

          Bottom line

          The analysts have issued 12-month target prices for Roche Holding Ltd. Genussscheine’s shares. Their forecasts are from CHF 225 to CHF 375. On average, they anticipate Roche share price to reach CHF 318.17 in the next year. 

          Twelve Wall Street analysts have issued “buy,” “hold,” and “sell” ratings for Roche Holding Ltd. in the last year. Currently, there are 2 sell ratings, 2 hold ratings and 8 buy ratings for this stock. So, a consensus recommendation is “Buy.” After the last lawsuit that alleges the Hoffmann-La Roche company was incorrectly affirming that Tamiflu can reduce complications and death in people with flu, everything is possible. The company can be punished by investors and they may start hard selling. That will decrease the stock price. Since things work that way in the market, some other investors will see the opportunity to buy more at a lower price.


        • Nike Q2 2020 Earnings Report Is Expected To Show Great Result

          Nike Q2 2020 Earnings Report Is Expected To Show Great Result

          Nike Q2 2020 Earnings Preview
          During Q2 reporting everyone will look at Nike’s direct-to-consumer business. The company’s revenue is expected to be $10.08 billion and EPS $0.58 

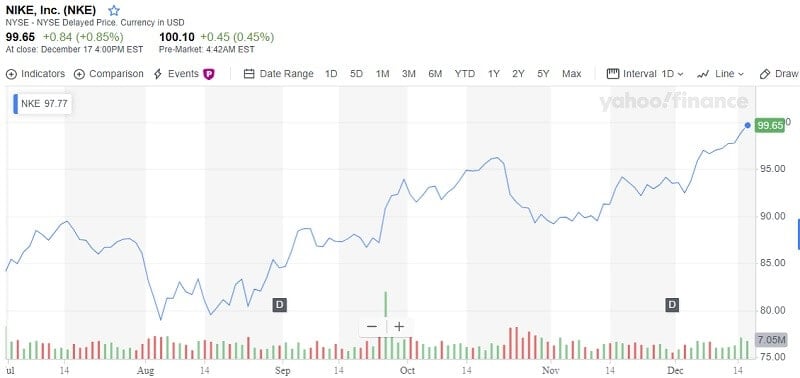
          Nike is prepared to report Q2 earnings on Thursday, December 19. It will be interesting to see will the famous sportswear producer sustain success which made over this year and what is the new plan. Nike (NYSE:NKE) shares have risen 34.2% this year, exceeding the S&P 500’s 27.5% rise. 

          Nike stock chart

          So, a lot depends on its Q2 2020. Will the gains continue? It looks like a lot of things depend on the company’s digital and direct-to-consumer efforts.

          Nike continued to fund its Direct strategy, the rollout of its apps to other countries and its partnerships with e-commerce platforms. For example, Tmall and WeChat Chain’s services. Nike dealt more acquisitions, such as NFL star Russell Wilson’s TraceMe startup. This startup has one important feature, a built-in sports-prediction service.

          Nike revenue

          The revenue is expected to be $10.08 billion and EPS $0.58.
          Nike shares have risen in 2019, despite the overall trade and economic slowdown. The company’s performance this year indicates the management is doing right. The stock rally will have a great test tomorrow after Nike issues its fiscal 2020 Q2 earnings.
          During this year there was no reason to believe that the company is doing something wrong. 


          Nike’s growth strategy showed good results

          The leading Nike’s efforts is “Triple Double Strategy.” The goal is to double its resources on its digital features; more and faster innovation and product creation, and increasing one-to-one connections.

          Nike has established a powerful track record of delivering on its strategy. Nike has beaten quarterly earnings estimations more than 90% for the past 11 years. And the company made it at the same time when Amazon got a major portion of customer spending. Moreover, this famous brand became more powerful, by spreading sportswear out of gyms to the street. 

          The result was that Nike grabbed a larger market share from its main EU rival, Adidas. Also, its presence on the home market is larger too and with increasing sales. The same result comes from the markets of Asia.

          For example, in Nike’s Q1 earnings report, the company released that sales in China rose by 27%. It is an impressive result because this success came during the trade war, and having such a good result in this communist country means that Nike, as an American brand, was doing well.


          The break out with Amazon 

          Recently, Nike ended the relationship with Amazon that lasted the past two years. This break appeared as part of a continuing effort to improve digital selling. 

          The first change at a stock price after the announcement showed how right they were. The stock increased by more than 7%. 

          Nike’s idea of digital selling is more idea of creating a personalized experience for customers. Some media reported that Nike spent about $1 billion on this strategy. The company’s digital loyalty program, NikePlus has more than 170 million subscribers and it is still growing. Thanks to app customers can find the perfect shoes for their feet because this app has a fantastic feature – it scans the foot in a few seconds. Of course, the app has other features too, from reserving some products to the mentioned one.


          Nike and Michael Jordan

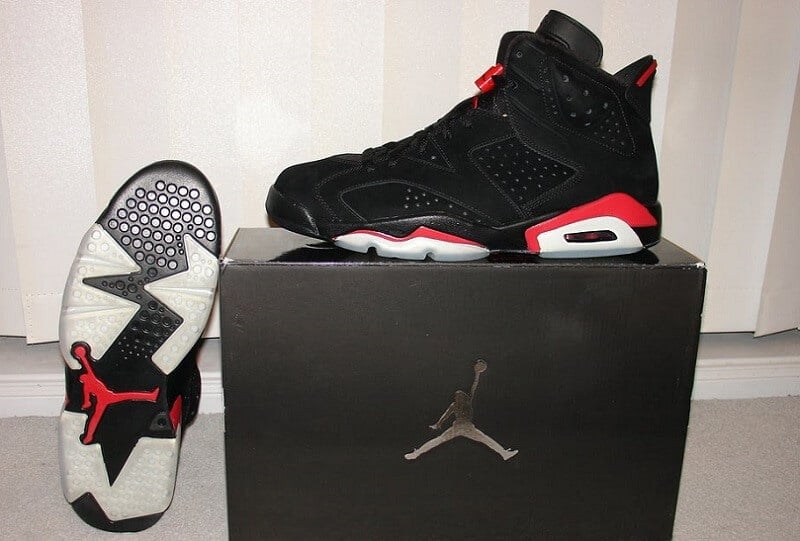
          Nike is the official uniform supplier of the NFL and the NBA. Its Micheal Jordan brand is still going strong, fans all over the world like the latest Jordan shoe model. That’s why it made more than $3 billion in revenue for fiscal 2019, which is more than 7%  in comparison to last year.

          Bottom line

          Nike’s stock price might seem as expensive. Its gain for this year and  P/E ratio at 37, may cause such thinking.

          The current share price of $99.65 and the stock is traded at $100.10 at the pre-market. The point is that the stock price is very close to the analysts’ estimation of $103.60 so some investors may think there is a small space for the rise. But, it is expected Nike to report great data on digital and direct-to-consumer sales. The natural movement in shares will be to bounce higher.

          Nike’s stock could easily hit $150.00 or even $160 in the next 12 months. So, NKE is considered to be a good long-term investment.


        • The Dilemmas About Aramco Investing Are Showing Up

          The Dilemmas About Aramco Investing Are Showing Up

          The Dilemmas About Aramco Investing Are Showing UpInvestors’ demand drove Saudi Aramco market value to $2 trillion on the first 2 days of trade in Riyadh


          But the dilemmas about Aramco investing rose. Yes, Saudi Aramco (SE:2222) reached the $2 trillion target. Saudi leader Crown Prince Mohammed bin Salman had a wish, and it became a truth on Thursday, December 12. Aramco shares have been rising for the second day to make Saudi Prince happy. Finally, this guy has a chance to show how big visionary he is. 

          Aramco’s initial public offering (IPO) is the cornerstone of his vision to provide Saudi’s economy the independence from oil. The money ($25.6 billion) collected by selling the shares of Aramco will be used for developing some other fields of the national economy. That is how the plan was presented in public. So far, so good.
          This is a tremendous opportunity for the Kingdom. Oil has long been the main export product for Saudi Arabia and Aramco is the biggest oil company in the world.

          The end of the fairy tale?

          The bubble around Aramco shares grows. Even before its IPO. It was represented as a great investment, a great opportunity for investors all over the world. But just be careful. If some sharks are buying those shares it doesn’t mean that everyone should do the same. Maybe Saudis have to do that but you don’t. Saudi Aramco is a state-owned company and some Saudis, according to media reports, are taking loans to buy the shares.

          Saudi Aramco’s IPO gives opportunities for Saudi citizens. Now, they can have a part of this Kingdom’s crown jewel. And everyone is excited, full of optimism and enthusiasm. But, where is the limit of it?

          Must be somewhere. 

          The share price is high in December, as we can see and it seems it will rise more. But what if the stock is overvalued? What if it is a bubble? It will explode and the prices will eventually fall.

          Don’t miss: Trading With Success – A FULL guide for beginners

          Why the dilemmas about Aramco investing arise?

          For several reasons.

          Saudi Aramco has become the most valuable listed company in history. This oil producer gained a market value of $1.9tn on its first day of trade.
          Shares were climbing almost $200bn above the $1.7tn valuation established before its market appearance on Riyadh’s stock exchange.
          This the biggest “provider” of the climate crisis had been valued at more than Apple and Facebook together. Also, double more than Amazon and Alphabet. 

          On the second trading day, it hit the $2 trillion target.

          But investors should be worried because of the company’s relationship with a state. And it isn’t SOME state. Saudi Arabia is well known as related to human rights abuses and with some dark things too. Have you ever asked yourselves why the main support for the company comes from the Saudis and the Middle East?
          But the main concern comes from investment index providers such as S&P Dow Jones, MSCI, or FTSE.
          They all said they will include Aramco shares into their indices. What are the consequences? Well, the investors from all around the world, pension funds and other funds will be forced to buy these Aramco shares.
          The dilemmas about Aramco investing came directly from the state of Saudi Arabia. 

          Saudi officials said that the government will sell more shares after the IPO. If the Saudi government does so, it will overwhelm the market with additional shares. And the bubble burst is coming! 

          The sale of more shares by the government could easily cause the price of Aramco shares to decrease notably. 


          Bottom line

          We don’t want to say that you should or shouldn’t invest in Saudi Aramco. We just want to say that you should avoid Aramco-mania. Stock investing is risky. In the markets, nothing goes up permanently. So, keep this in mind. And invest smartly and carefully.

        • Fiat Chrysler Stock to Watch in December 2019

          Fiat Chrysler Stock to Watch in December 2019

          Fiat Chrysler Stock to Watch in December 2019
          FCAU could be a solid portfolio addition since Fiat Chrysler Automobiles is a good investment.
          The labor concerns are solved and Fiat Chrysler can switch its attention to its merger with Peugeot owner, PSA Group.

          Of course, you will watch the stocks you like, but our choice of stock to watch in December is Fiat Chrysler. On Monday, December 2, its shares were changed a bit since the Fiat Chrysler stated that the automaker made an agreement with the United Auto Workers (UAW) over the last weekend. It looks that Fiat Chrysler Automobiles will avoid a strike. Previously, General Motors and Ford made agreements with the UAW.

          So, it will be interesting to watch this stock in December and how this agreement will influence the stock price.

          The UAW revealed some parts of the agreement. According to UAW Fiat Chrysler will invest $9 billion to add 7,900 jobs in the next four years. The negotiations were focused on benefits, salary, and job security. The deal is expected to be reviewed by UAW’s national council on Wednesday, December 4. If UAW’s council confirms it, the next step is Fiat Chrysler union members to ratify it. It should be happening on Friday.

          The smart choice made Fiat having in mind how big financial damage experienced General Motors during the UAW strike in September and October.

          General Motors’s revenue declined 1% in the third quarter,  net income fell by nearly 9%. But that is not the end, General Motors easy could experience further downs next year when its Q4 earnings report is expected.

          With this deal, Fiat Chrysler opened a space to continue with the merger with Peugeot owner PSA Group. The past tries to couple with this European car company, didn’t result in a union. 

          The Fiat Chrysler’s problems grow

          The Schall Law Firm announced the filing of a class-action lawsuit against Fiat Chrysler Automobiles N.V. (NYSE: FCAU) for violations of the Securities Exchange Act of 1934 and Rule 10b-5 declared thereunder by the U.S. Securities and Exchange Commission.
          Investors who bought the Fiat securities between February 26, 2016, and November 20, 2019, didn’t have the real data, according to the law firm.

          According to the Complaint, Fiat Chrysler presented incorrect and misleading reports to the market. Fiat joined in a bribery system created to obtain beneficial terms from labor unions for its collective agreements. The top-level management was engaged or had information about the schemes. The law firm said that Fiat’s “public statements were false and materially misleading throughout the class period.” When the market noticed the facts about Fiat, investors experienced losses. Some of them have losses above $100,000.
          The Schall Law Firm represents investors all over the world and specializes in securities class action lawsuits and shareholder rights litigation. 

          Fiat Chrysler (FCAU) stock price

          Fiat Chrysler Stock to Watch in December 2019

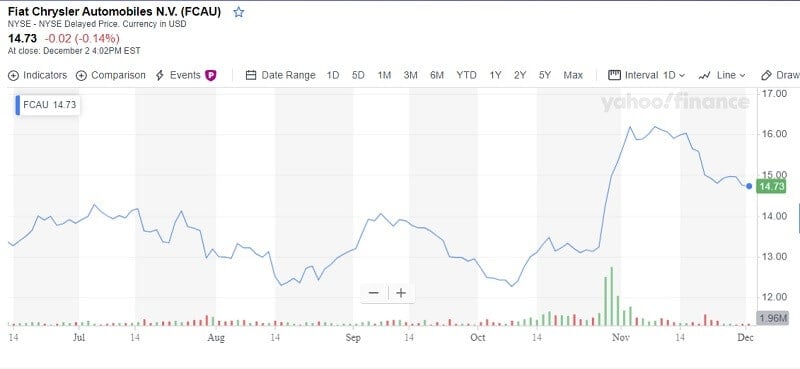
          Fiat Chrysler stock was traded at $14.73 on Monday which was a decline of 0,14 %. Today it is $14.760 with an increase of 0.1017%. It is a good company, the stock can provide a good return, so we can say it is a lucrative investment option.

          Based on Traders-Paradise’s calculations, this stock is a good long-term investment. In the 5-years period, the revenue on your investment could be about 40% and the stock might worth above $20 at the end of that period.

          The analysts forecast for Fiat Chrysler Automobiles a median target of $17.85. A high estimate is about $20 and a low estimate is around $12. The future price of the stock is predicted at $28.799 after a year according to some other analysts. On 2019 December 03, the current price of FCAU stock is $14.765 and our data shows that the stock price has been in a downtrend for the past 12 months.

          FCAU stock price has been presenting a declining tendency but Check our tool to determine the best exit strategy.


        • The Kraft Heinz Company Is Bottoming

          The Kraft Heinz Company Is Bottoming

          The Kraft Heinz Company Is Bottoming
          The packaged-food giant reached rock bottom and positive signs are unfortunately weak. They are not enough to warrant a buy right now.

          The Kraft Heinz Company (NASDAQ: KHC) reported third-quarter 2019 financial results on October 31. The company reported lower net sales and higher input costs. So, the third quarter performances for this company were a lot below their potential but still, the company showed growth in comparison to the first six months this year.

          Kraft Heinz CEO Miguel Patricio said: “We are making good progress in identifying and addressing the root causes of past performance, as well as setting our strategic direction. Although there is still much work ahead, we’re encouraged by our improving performance, and are even more confident in our ability to turn around the Company and set a path of long term growth and profitability.”

          The Kraft Heinz Company results

          Net sales were $6.1 billion, and it was 4.8% below than it was in the same period last year.
          Net income increased to $899 million and diluted EPS increased to $0.74. Adjusted EBITDA declined 7.8% to $1.5 billion. The drop was caused by the drop in the United States and Canada, but there are higher overall corporate expenses also.
          The Board of Directors of the Kraft Heinz Company announced a quarterly dividend of $0.40 per share of common stock. It will be payable on December 13, 2019.
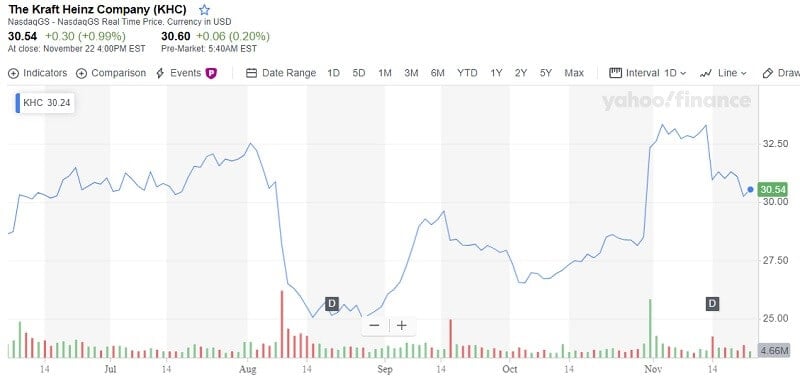
          The KHC stock was traded at $30.54 on Friday, November 22, which is an increase of 0.99%.

          The Kraft Heinz Company Is Bottoming

          Should you buy the Kraft Heinz Company stock?

          The analysts offering 12-month price predictions for Kraft Heinz Co have a median target of $32.00. Their high valuation is at $38.00 and a low at $23.00. The median shows a 4.78% rise from the current price.

          The recommendation is to hold stock in Kraft Heinz Co. 

          But the other group of analysts is pretty much sure that the Kraft Heinz stock couldn’t have good returns. That’s the reason why they claim that this stock is a bad and high-risk long-term investment. Today’s quote (Nov 25) for Kraft Heinz is $30.53 which is lower than on Friday. 


          Traders-Paradise opinion

          Having the current price of KHC stock in our mind and with the knowledge that the stock price had a downtrend for the past 1 year, we in Traders-Paradise are not sure is this stock is good as a long-term investment. We are close to thinking that this stock could easily drop significantly in the future hitting a decline of over 100% and to end up worthless. So, we suggest staying away from this stock if you are seeking a new addition to your investment portfolio. This is important especially if you are a new player on the market and don’t have enough experience. 

          This stock is trading in bear markets, which is harder for new traders.

          But if your plan is to buy and hold Kraft Heinz stock for a short time, for example, the next 10 days or two weeks, it can be a good choice. As we can see, the stock price could hit around $35 in the next several days.


          Bottom line

          The price line shows the possibility of zigzag running to the end of this year. After the end of this year, we are afraid that this stock will gain further declines.

          Our opinion comes from the suspicion that the company is not able to answer the challenges of predicting consumer demands. In its latest report, we couldn’t find that the company is ready to offer new products or to react to rivals’ improvements.
          The Kraft Heinz Company survives 150 years of challenging and produced some of the products well-known over the world. Yes, it is one of the largest global food companies, but the new era is already here and the company has to catch the moment.
          The point is that General Mills or Nestle are better choices in our opinion.
          We can recognize some possible upward movements, but they are weak and don’t provide enough reasons to buy this stock now.


        • Amazon’s Workers or Why I’ll Never Invest in Amazon?

          Amazon’s Workers or Why I’ll Never Invest in Amazon?

          Amazon's Workers or Why I’ll Never Invest in Amazon?
          Amazon’s workers are under pressure, afraid of being punished if take time off, don’t talk to each other during working hours
          Over three months 28 ambulance calls were made from just one of Amazon’s fulfillment centers asking for medical help. Over the years several were made way too late to save people’s lives

          by Gorica Gligorijevic

          Amazon's workers work under pressure

          First of all, I don’t need toxic toys, diet books, self-help books, or clothes that don’t match the picture from the catalog. And moreover, I don’t understand people who are still buying on Amazon after the reports of the inhuman treatment of their employees. For me, as an investor, is extremely important that the company has good vibes with employees. That it takes care of them, and that it is honest. 

          Recently I was reading some articles about Amazon’s PR “headaches” and concerns about work conditions in its fulfillment centers. The stories I found were true horror.  

          The company has installed a stupid advertising campaign featuring employees saying things like: “I bake cakes every Tuesday!” 

          What does it mean, for God’s sake? Should it have to show us how happy they are? What’s wrong with you people? Workers are not robots (yes, I know Amazon prefers robots), workers are human beings, with problems, emotions, ambitions, life outside the workplace.

          Amazon’s invisible army of hundreds of thousands of employees secures millions of packages are delivered every day. The employees’ testimonies, I have been reading, were scary.

          They expressed their long work hours as a “brutal”, labor slavery, compulsory 60-hours work weeks, they are afraid to take time off, report workplace injuries, and the enormous pressure even during regular days not only around the holidays. And moreover, the company doesn’t care.

          For example, Business Insider reported that ambulance callouts increased during the company’s busiest weeks of the year to three Amazon warehouses in the UK.

          Amazon’s $15 minimum wage per hour

          What Amazon’s workers have to do for that amount?
          Amazon stated it is satisfied with its “great working conditions, wages and benefits, and career opportunities.” Really?
          Should we ask Nick Oates from Kansas City?
          Prior to Cyber Monday in 2018, it was ugly weather in Kansas City. The governor at the time, Jeff Colyer, had to declare a state of emergency on November 25, and people had to stay off the roads. But Oates and his colleagues had to work without excuse. For several months he was living in his car and worked in the fulfillment center since he took medical leave from Amazon for depression. Nobody cared!

          Amazon stated at that time: the staff is advised to stay at home if they think it’s not safe to travel and can do so without fear of punishment. But Oates said his experience showed how far employees will go to provide Amazon’s ability to operate. I would like to add: and how afraid they are to take time off or refuse the overtime. 

          Barely these workers had been in the spotlight.

          In September this year, Billy Foister, a 48-year-old warehouse worker in Amazon, died after a heart attack at work. His brother told media that an Amazon human resources representative said to him that Billy had lain on the floor for 20 minutes before getting attention from Amazon’s internal safety responders.

          “How can you not see a 6ft 3in man laying on the ground and not help him within 20 minutes? A couple of days before, he put the wrong product in the wrong bin and within two minutes management saw it on camera and came down to talk to him about it,” Edward Foister said to The Guardian.

          How is possible that the worker is on the floor 20 minutes and nobody notice that? It is unbelievable! If you have co-workers, colleagues, working with you, you are talking from time to time during the shift, you can see each other, even if you are working in some lab, not in bloody Amazon’s warehouse.

          More accidents to Amazon’s workers 

          This case isn’t the first the company has been accused of providing delayed medical attention to a warehouse worker during working hours. In January this year, the widow of Thomas Becker filed a lawsuit against Amazon. She claimed that management hesitated to provide medical attention during a cardiac arrest. Becker worked at Amazon’s warehouse in 2017 in Joliet, Illinois. 

          From January to March 2019, over three months 28 ambulance calls were made from the warehouse in Etna, Ohio. Five employees with suicidal concerns and five on-the-job injuries. About 3,700 workers are employed at this fulfillment center.

          An Amazon spokesperson said: “Safety is a fundamental principle across our company and is inherent in our facility infrastructure, design, and operations.” Really? With reports of temperatures reaching 45 degrees Celsius during summers in some warehouses and workers who work in them for stretches of 4-5 hours without a break, worker safety doesn’t appear to be “fundamental principle”.

          Bottom line

          Horror stories of working conditions in Amazon and Amazon’s workers have overwhelmed the news, walkouts have erupted across Europe, and lawmakers in the US have lobbied for pay raises. Amazon’s founder and CEO, Jeff Bezos, has turned Amazon into a $790 billion worth company. Yes, he is the richest man in the world. But I don’t have to make him richer. Not me. I wish him luck but my money will stay with me. I’ll never invest in such a cruel company. Profit is important but human lives are more so. 

          I don’t want to say that Amazon isn’t worth investing in, these are my personal reasons why I want to stay away from it.

        • Traders-Paradise