Author: Editor

  • Artificial intelligence and machine learning we can apply on the financial markets

    Artificial intelligence and machine learning we can apply on the financial markets

    What is artificial intelligence and machine learning and can we apply it on the financial markets?How can we apply artificial intelligence to the financial markets

    By Guy Avtalyon

    What is artificial intelligence and machine learning and can we apply it to the financial markets?
    It took us 3 and a half years of research and development until we finally reached a point we can trust our software.

    Obviously you can find all sort of information on the internet about machine learning and AI, like these articles on Wikipedia for example, but the concept is quite simple: You run an algorithm (there are many) on the set of data, and once the algorithm is finished, the software will know how to run by itself on new sets of data, even if it’s never been seen.

    There are 2 types of algorithm methods –

    1.       Supervised – Similar to training a dog: if it does good you pet them, if it does wrong you scold at them. After a while, they will learn how to behave
    2.       Unsupervised – This is the most interesting algorithm out there. This means you give the algorithm a set of data but you DO NOT tell it what is wrong and what is good. It does it by itself.

    So, can you apply those algorithms in the financial markets?

    First, let’s start by learning a bit about how ML (Machine Learning) and AI (Artificial Intelligence) work and its purposes.

    To create simple computer software, we need to insert some scenarios we want it to handle, we add the way we’d like the software to act, and let it run.

    A “stupid” software will ONLY KNOW HOW TO WORK according to the scenarios we entered and taught it.

    An AI software will take the same scenarios we entered and ways to behave we told it to, and will be able to do it NOT only on the ones we told it to but also on SIMILAR scenarios.

    This is basically why AI and ML are the future in any way you can imagine – Because it’s not limited to what the programmer writes in the code, but also it can adjust and act to things that aren’t inside its code and also, over time, will be smarter in handling situations only by itself.

    OK let’s go back a bit

    Scenarios? Ways to behave? WHAT??

    Say we got a lifetime doctor’s records of some people. They are anonymous, of course, because we don’t care who they are. We only care about their DATA.

    Now we want to find something, like, maybe, can we find cancer disease BEFORE the person knows it’s happening – or in other words – Can we predict cancer?

    We can check – are they the cigarette smokers? If yes, how many had cancer?

    This has been the way until now.

    You probably can already guess why it’s not merely enough.

    If they don’t smoke – does that mean they won’t have cancer? We already know it’s not true.

    And sadly there’s a variety of cancers to almost every organ in the human body (cancer is when some cells of our own body stop dying unlike the other cells and the body starts to attack them. Basically, nature makes our body suicide from inside).
    So what can we do if we want to predict cancer?

    It’s simple – We take into consideration as many parameters we can. Like:

    Age, gender, place of living, place of working, family history, doctors’ appointments, and medical record, food and drink habits, etc.

    Those are the objective data.

    We need also subjective data such as happiness in life, the scale of pressure, type of person, etc.

    Once we have ALL this data for every person, we need to do 3 things:

    1.       Check which one of the parameters can, in fact, be some kind of prediction to cancer
    2.       Run a statistics machine learning algorithm (like Naïve Base)
    3.       Use the results to solve a worldwide problem  

    We wish, right?

    Now we get on to the problems of artificial intelligence (AI) and ML:

    1.  Data

    Data is extremely difficult to collect, and then to manipulate. In our example to get these data, we need to cooperate with medical services to get their clients’ data, create a questioner, and send it to all the clients and analyze the data. Though there is such cooperation around the world, it’s still not easy to also get subjective data.

    1. Analyzing big data

    Big data has become a known word around the world.

    There was a time companies said they work with big data and clients threw the money at them.

    But it’s not that simple. Every data you add for the algorithm to learn from – increases exponentially the time for the software to analyze


    Inefficient software may take a very LONG period of time to run.

    Funny personal anecdote, our first AI software we developed to learn how to predict price changes in the stock market looked so genius at first, but after we started running that artificial intelligence and measuring the time it will take to finish, we saw it will take no less than 27,000,000,000,000,000 years from now(!!) Obviously, we couldn’t wait, and in future articles, I will explain how we lowered it to only a few hours running time.

    Let me give you an example of the difference between Big Data and just simple data with a game:

    I chose a number between 1-1000. You have to guess which one is it. But there’s a catch – you need to find the number in as little time possible. How would you do it?

    Think about it for a second.

    Got a solution?

    If you guessed that you should ask me “Is it higher than 500?” and then according to my answer (If I chose the number “990”), the answer is yes. Then your next question will be “Is it higher than 750″
 You get the point.


    That’s easy, right?

    What if you got a number with 80 digits? Then it might take a long long time until we break this number, maybe even months. And that’s only one running time. What if we need it to create strategies for trading and investing and we need it to go over millions of possible strategies?

    It will take a lot of time.

    As humans, we can’t really comprehend really big (or small) numbers. Like these two questions, I like to ask people once I talk about large numbers.

    1.       If 1 million seconds is 12 days, how much time is 1 billion seconds?
    2.       And, if your salary is $100,000 each month, how long will it take until you reach 1 billion dollars (say you can save all of it each month)?

    You can easily calculate it, but it’s an intuition question, not a math one. Think for yourself, what’s your intuition answers are? The answers will be later on in this article.

    So we’ve talked about what’s machine learning algorithm and a bit on big data problems.

    Now, can we apply artificial intelligence to the financial markets?

    In short, yes.

    But it’s easier said than done.

    It took us 3 and a half years of research and development until we finally reached a point we can trust our software.

    Because other than the ML and big data problems, we face a whole different problem in the field of financial markets, since they act like in a chaotic environment it makes predicting a lot harder.

    And, (and it’s the most important and) because of the spread whenever you enter a position you face an average of 56% against you.

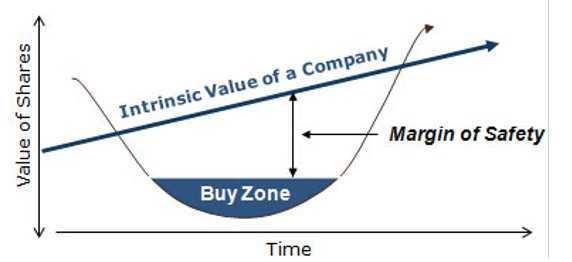
    That’s probably the time to say there are two kinds of players in the financial markets:

    1.       Investors – They invest their money for years ahead and they gain the average rate the market makes (around 8% a year). By the way, according to decades of studies, there’s one stock that if you’re an investor you should put all your money on, and that’s the S&P500 stock (Symbol SPY). In another post, I’ll prove this fact.
    2.       Traders – They usually use time limit (options) or profit/loss lines (if it reaches +X get out with a profit and if it reaches -Y get out in a loss)

    We are on the traders’ side.

    We want to gain more money, faster, and more chances of getting out in time.

    But unlike investors who buy now and then forget about it, as traders we must beat not only the commissions our broker offers us but also the spread (the difference between the lowest price a seller is willing to sell and the highest price a buyer is willing to buy). The spread is usually set by the broker and it’s one of the best ways for a broker to gain profits.

    So, we also know that like in gambling the house always wins, so as in the financial markets – the broker’s always gaining profits.

    Back to our financial algorithm – we found a broker service that lets us collect the financial data, and we’re saving it. Now, we need to analyze it to find patterns. But how?

    In an everyday changing environment, how can we rely on anything? 

    We solved that problem by relying on our algorithm on behavior analysis. We figure that even though the market can change, the forces that control it (the investors and traders) will stay the same (Obviously, they change too, but way slower).

    So we’re talking about collecting on average millions of data and parameters a day for each stock. Once we try to collect 1000 stocks for a few years time you can imagine how much data is inside, so it’s just a matter of creating a super-fast unsupervised machine learning algorithm with only one rule: The most money you can make is the better – and let it run and find the best way to trade by itself.

    Creating artificial intelligence

    In conclusion, it is possible to create an automatic software or some artificial intelligence to trade for you in the financial markets, but it’s EXTREMELY difficult. You need to overcome many problems in serval fields in order to do it. And after you do it, it’s unlikely that you will let anyone use it.

    But we’re different. We will let our subscribers use our algorithm for free, just to have a sense of how it works.

    Subscribe now to get more information about artificial intelligence in the financial markets and to get informed once our algorithm is ready for outside users.

    Our software will let you choose which assets you want to buy, and when – and it will tell you when to get out. Simple, yet important.

    By the way, the answers to the question before are:

    1.       One billion seconds are 32 years
    2.       It will take 830 years to gain one billion dollars if your salary is 100K per month

    Was that your intuition?

    Sign up below to our newsletter for a free test drive on our trading algorithm! Find more about artificial intelligence.

    Top Image Credit: Photo : iStock/MF3d


  • Capitulation of Bitcoin?

    Capitulation of Bitcoin?

    2 min read

    BITCOIN MINING EXPLAINED: HOW IT WORKS, HOW MUCH ENERGY IT USES AND WHAT NEEDS TO BE FIXED
    The bear market has seen the price of bitcoin decline more than 75% from all-time highs set in January. It is defined as a period of depressed activity and sentiment. A total of $60 billion has been erased from the value of all cryptocurrencies over the last week. That’s why many are wondering if the ongoing bear market for the asset class has finally come to an end.

    Bitcoin makes up more than 50% of the entire cryptocurrencies market, in terms of total capitalization. Our prediction is that the bear market may end when bitcoin bulls refuse to cede more ground.

    In the same period, traditional assets were down too. DOW had worst Thanksgiving week since 2011, oil is down 30% in 7 weeks, FAANGs (Facebook, Apple, Amazon, Netflix, and Google) is down almost 40%.

    But somehow, for many people, FAANGs get more attractive as they fall and Bitcoin gets less.

    Markets reverse

    Markets can be reversed in three ways: by the following capitulation, by following a strong trend-setting upwards break, by slowly rolling over reversal which is the hardest.

    Alex KrĂŒger, economist and trader tweeted:

    ”Bitcoin crashed hard in the last month, yet the market has not seen capitulation yet. Market direction is uncertain.

    Trying to figure where will the market stops falling, its bottom, is beyond fruitless. Those charting and calling bottoms are best ignored.

    Capitulation of Bitcoin?
    BTC has extremely well-defined resistance areas.

    Books are so empty and volume so low that a whale can make a >5% pop/drop within a few hours.

    I’d expect more 2-way action now and still lower lows eventually.

    Wouldn’t be surprised to see 8200 within weeks.

    A $BTC ETF will launch, making crypto go viral again.

    Security tokens will go mainstream.”

    What is capitulation in the market?

    Capitulation is marked by extreme panic selling, consisting of extreme selling over a short time period. It is backed by high volume that builds momentum until an eventual “bottom” is found. The bottom is a price level where the asset looks too cheap or undervalued to investors for them to allow it to fall any further. In order for a true bottom to be found, many claim a capitulation needs to take the place because it is traditionally the last stage of a prolonged bear market. It’s difficult to consider something to have officially capitulated until after it has occurred. By looking at previous capitulation stages and market bottoms for bitcoin, there are a few similar signs traders and investors can watch out for. That may refer to an official market bottom. 

    Market conditions aren’t the same as they have been in past years. Bitcoin’s 2017 boom has brought new attention. Traders and investors who are left wondering if the asset can ever return to its former glory.

    Such an event can be measured and understood in real-time. But in order to predict bitcoin’s future, taking a look at its price history is perhaps the best place to start.

    It’s not an exact science, and there’s no guaranty history will ever repeat. That said, observing the bitcoin’s past price action yields three possibilities for potential market reversal worth of being discussed and considered.

    If there’s no bitcoin ETF approval, one could argue there’s no reason for bitcoin to resume its bullish uptrend until a market bottom occurs like it did in 2014-2015.

    Bitcoin falls under $4,000

    After days of stagnating at the $4,200 price level, on Saturday afternoon (EST), Bitcoin (BTC) suddenly fell under $4,000, a highly-touted level of support for the cryosphere’s foremost asset. It wasn’t clear why this bout of selling pressure occurred.  But within minutes, sell-side orders pushed BTC (on Coinbase) under $4,200, then $4,100, then $4,000, all the way to $3,800, where the digital asset is situated at the time of writing. Of course, this is worrying. It seems that a temporary floor has been found at $3,800. Crypto traders mentioned this key level before. It is unclear whether there was a catalyst that triggered this sudden loss of support, sending BTC plummeting into its third freefall in a week’s time.

    This rapid 10% loss can be caused by a number of supposed catalysts: the aftermath of the Bitcoin Cash’s November 15th fork, an influx of institutional selling orders, the Bakkt Bitcoin futures vehicle delay, regulatory measures from the SEC, and, arguably the most convincing, the final bout of capitulation from crypto’s “weak hands”.

    Many traders exclaimed that they didn’t expect to see BTC foray under $4,000 ever again.

    The fact of this most recent move downward is that many believe crypto’s bear market isn’t done yet. At least not until a bottom of $3,000 is reached, which is claimed by many traders, including Tone Vays, Anthony Pompliano, and other lesser-known yet knowledgeable industry analysts. That could mean that the $3,000 zone would be a good time to start accumulating.

    The bottom line

    If the current ascending trend line breaks, the price may not find its “bottom” until reaching the high of the prior “mega” bull run, which in this case lies in the $1,200 area. If prices fall to this level, the last hope will be to find new rising support for the entire “bull cycle” to repeat.

    Risk Disclosure (read carefully!)

  • Bitcoin Mining, Is It Profitable At All?

    Bitcoin Mining, Is It Profitable At All?

    Bitcoin mining, is it profitableBitcoin mining is a legit job, but initial investments and cost of mining are very big.

    By Guy Avtalyon

    Is Bitcoin mining profitable these days? When the price of gold drops, miners are losing. It is the same story in the world of cryptocurrencies.

    According to CoinMarketCap data, the prices of Bitcoin have tumbled nearly 30% in the past week and hit a 14-month low of about $3,800. The total market value of cryptocurrencies has slumped to $148bil, which is less than one-fifth of its worth during the market’s peak in January. Hong Kong-based cryptocurrency exchange OKEx forced an early settlement of Bitcoin cash futures contracts on its platform the day before. Widely thought is that it has triggered the sell-off. 

    Miners position

    The price drop has left miners in a weak position. They claim it has become unprofitable for them to run at least four models of bitcoin mining machines. According to the latest estimates of Beijing-based F2Pool, if they spend power at a rate of $0,06 per kWh it is clear that mining becomes unprofitable. F2Pool is one of the world’s biggest bitcoin mining pools.

    Cryptocurrency mining has developed from a bedroom activity to mass-scale production. Later, it was undertaken by enterprises that use specialized equipment with application-specific integrated laps. The crypto miners combine their computing power in mining pools to increase their odds of winning new digital currency. They are counting various factors, the total amount of computing power in the network, and costs. Coasts are electricity and rental fees. That determines which coins to mine and where to house their devices. The cryptocurrency dropdowns have forced miners to remove at least four models of bitcoin mining machines. Some of them have become too expensive to operate under present market conditions, estimates F2Pool. These models are Antminer S7 and Antminer S9 from Bitmain Technologies as well as Canaan Creative’s AvalonMiner 741.

    Is Bitcoin mining profitable now?

    A group of Chinese cryptocurrency miners said they have already shut down 20,000 rigs, or about 10% of the total number of machines they operate. They declined to be named for fear of government reprisal.

    But their struggles are an opportunity for others.

    One miner bought about 50,000 used mining rigs that were put up for sale in the market over the past few days. He intends to send these used rigs to countries with lower electricity prices. He is thinking about Russia and Venezuela. In this way, he can turn a profit selling them there.

    Correlation between mining and Bitcoin price

    Mining Bitcoins takes time and resources. Let’s say, it’s not an easy thing to do in the first place. It requires high-powered machinery to make Bitcoin mining profitable. If you lack the resources, you will lose the potential earning and have to pay a huge sum of money for your electric bills.

    According to CNBC, in March, the miner’s profits have roughly halved compared to their earnings in December due to the surge of interest. So, we can say Bitcoin mining is no longer profitable today. Over the past days, Bitcoin’s range had tightened up and seemed like another wild move will take place. We are not quite sure in which direction. From one side, the market is eager and deserves a correction back to the $5K+ area. But on the other hand, there is still a lot of panic selling, and Bitcoin looks like has to go lower.

    There are several profitability calculators that miners can use to analyze the cost/profit equation of Bitcoin mining. Calculators vary as they have different levels of complexity and variables that can be inputted.

    Trading Bitcoin

    Bitcoin currently trades essentially at the break-even cost of mining it.

    To answer if Bitcoin mining is still profitable you have to figure out if you are willing to invest the necessary initial capital for the hardware. And you have to predict Bitcoin’s value in the future as well as its mining difficulties. When both prices and mining difficulties fall, it usually means less miners, but more Bitcoin to mine. When the opposite happens, more miners are competing for fewer Bitcoins. Bitcoin is a real business, so you may accept mining bitcoin as a legit business. There are people working in this business, also have revenues, profits, earnings, plant, and equipment. It’s almost the same, there is no difference between mining bitcoin or coal. Except, mining bitcoin is all math. And there’s no scam.

  • Bitcoin price fall – new yearly lows

    Bitcoin price fall – new yearly lows

    2 min read

    Anniversary to Bitcoin!

    Bitcoin price fall again. ‘Bitcoin Black Friday is a one-day event that brings together bitcoin merchants and bitcoin users.

    Merchants simply list their bitcoin exclusive deals, and users can check out all the deals in one place. This year, we’re focused on quality merchants that care about the bitcoin community states the Bitcoin Black Friday website. It says it will publish all the best deals from merchants on Friday, 23 November. 

    Bitcoin price fall by around $2,000 over the last week. It marks the big losses in this year for the world’s leading cryptocurrency.

    The falling price of bitcoin in past days has led to some cryptocurrency analysts joking that bitcoin has gone on sale. Just in time for Black Friday.

    But it is an opportunity for savvy investors. They understand that digital currencies are the future of money. They will be capitalizing on the lower prices in order to build their portfolios and shore-up their positions

    “Prices might fall further over the next few days, but we can expect a long-term upward trajectory for the crypto sector”, said Nigel Green, founder, and CEO of financial services firm deVere Group.

    The future of Bitcoin

    The cryptocurrency market has slowed over the past few months. However, Robert Sluymer and Tom Lee, both from market analysis firm, Fundstrat, also believe that this will change very shortly.

    Tom Lee is one of the most prominent cryptocurrency bulls out in the space right now. We all can see him on mainstream media sources covering topics related to the cryptocurrency industry.

    On Wednesday, Lee doubled down on his $25,000 prediction. He didn’t sound skeptical in his belief one bit.

    He noted: ‘The fully loaded cost of (to mine) Bitcoin next year, is going to be like $14,000, reflecting the difficulty’.

    Why he is holding strong on this prediction?

    He believes that traditional institutions, like banks, will begin to stack as they see “lucrative” business opportunities arise. Lee also believes that the regulatory climate around cryptocurrencies will only improve as cryptocurrencies reach higher levels of institutional and retail adoption.

    Robert Sluymer, also from Fundstrat, sees bitcoin bottoming.

    Sluymer pointed out the series of higher lows which the price of Bitcoin should hold at if the market stays in a bearish state.

    ‘We think Bitcoin is starting to bottom off some very key support around $7,000 and we think it’s going to start a recovery process here.’

    He repeated that he believes that Bitcoin is about to “challenge its downtrend,” with Bitcoin’s price movement possibly turning to the upside if it breaks through the current downtrend levels.

    Bitcoin price is sitting at quite a low level.

    And it is similar to the levels seen before previous temporary movements to the upside seen earlier this year.

    Truth is that what we need is to see is the bitcoin actually breakout and move through the key levels. Sluymer noted that one of these key levels is at $7800, with Bitcoin struggling to surpass that level.

    Over the past days, Bitcoin’s range had tightened up and seemed like another wild move will take place. We are not quite sure in which direction. From one side, the market is eager and deserves a correction back to the $5K+ area. But on the other hand, there is still a lot of panic selling, and Bitcoin look like has to go lower.

    Some bitcoin exchanges are even offering bitcoin giveaways in an effort to entice people to their platforms.

    Crash but still hope

    Bitcoin has experienced five major corrections to date, and the recent bear market of 2018 is the smallest major correction to date.

    As seen in a table shared by a renowned trader and technical analyst Peter Brandt, bitcoin price fall of 79.7 percent in the past eleven months as its price declined from $19,500 to $4,035.

    Bitcoin price fall - new yearly lows
    In 2011, 2013, and 2015, Bitcoin recorded drops in the range of 82.6 percent to 94.3 percent, declining by 85.3 percent on average. For BTC to record an 85 percent loss from its all-time high, it would have to drop to $2,950. But, there still is strong support at the $4,000 support level. Even if BTC drops to $2,950, an 85 percent drop from its all-time high is only the average loss BTC recorded in the past four major corrections.

    The 79% decline in the price of bitcoin from $19,500 is mainly caused by a lack of liquidity in Bitcoin markets. Trading giant Susquehanna executive Bart Smith noted that there are no viable investment vehicles for a regular retail trader. That means it is still difficult to invest in the cryptocurrency market.

    The short-term price trend of cryptocurrencies does not accurately portray the last eleven months of positive developments in the cryptocurrency sector. For that reason, high profile investors like billionaire Tim Draper, Mike Novogratz, and Susquehanna executive Bart Smith are optimistic in the long-term trend of Bitcoin.

    It is too early to confirm that the cryptocurrency market has achieved a bottom and that bitcoin has stabilized in the low price range of $4,000 to $4,500.

    Depending on the short-term price trend of bitcoin throughout November, could trigger an accumulation period throughout the first quarter of 2019.

    Risk Disclosure (read carefully!)

  • How to Use Stop Loss Order?

    How to Use Stop Loss Order?

    Stop Loss Order and How to Use It
    Use stop-loss orders whenever you enter a trade to limit the risk and avoid a potentially great loss

    By Guy Avtalyon

    A stop loss order is an order to sell a security when it reaches a given price. Put simply, the stop-loss sell order is designed to limit an investor’s loss on a particular stock. Stop-loss orders appear in four classes. But some brokers may offer products that vary in their structure and complexity. Some classes are more commonly used than others and dealers do not typically offer all classes of stop-loss orders.

    To some degree, each type of this order poises protection against the risk of “slippage” and the risk of an early exit from the position. Slippage points to the difference between the order level and the current trade price. It may be increased or decreased depending on the type of stop-loss order trader uses. All of these definitions fit the normal market conditions. Counterparties should ensure that they have an independent understanding of the parameters of normal market conditions. It is important for each currency market to effectively recognize risks during the abnormal market condition

    Why use Stop Loss Order

    When trading on an asset, investors are exposed to potentially high risk if the price moves towards a direction which is the opposite of the one they had anticipated. This could result in considerable losses in the investment unless action is taken to exit the non-profitable position as soon as possible. When the price moves in a direction that provides the current position profitable, a trader might want to close the position in the profits earned so far. But, the possibility of turning winning trades into losing positions is always present. Also, it could lead to abnormal losses. Stop Loss usually involving the prices at which a position was opened, and are frequently used by traders, as well as automated trading systems. Trading is almost exclusively conducted electronically through a computer.

    In addition to that, investors have replaced the broker with a platform for automated trading called algorithmic trading. There is a lot of proof that can confirm the increased algorithmic trades can decrease wrong price choices and reduce the balance of offer risk over different price levels of an asset correlated with the trades. These results show that algorithmic trading lowers the cost of trades and enhances the informativeness of quotes. Today more and more brokers use electronic trading platforms, and more individual investors opt for algorithmic trading. So this order is calculated for every trade in a few seconds.

    Take Profit

    Returns can be either absolute or relative. The price is within the price range x ∈ (L, b × L), or the investor, if x is the entering price, can simply set a constant I (proportional to the fluctuation we add), where x−I is the stop-loss price.

    The returns change over seasons and periods, according to the influences an asset undergoes as a result of outside or inside factors. The orders with stop loss and take profit, when activated, oppose the market trend (take profit) or intensify the movement (stop loss). They have great influence even over the liquidity during a flash crash. The use of stop-loss orders and take profit orders and the range of these orders reflect the risk-taking desire of the investor. Taking profit and stop-loss functions display the flexibility of profitability adjusted on each asset.

    The Stop Loss order protects the trader from holding a position that is not profitable for a long time. Contrary, that could result in big losses of capital. On the other hand, there is a distinction between the profits’ enhancement and risk reduction. The Stop Loss order has an influence on the fall of prices. In forex, the variance in exchange rates is faster when the prices hit levels at which Stop Loss order is usually set. Secondly, the influence of the Stop Loss order is bigger than the effect of the take profit order. It also helps the fast changes in prices by creating an opposite trend. Thirdly, the impact of stop-loss orders has an extended duration than that of the take profit orders.

    How Stop Loss order works

    Stop-loss orders work based on a trigger price. We can recognize two types of stop-loss orders: stop-loss limit (SL) and stop-loss market (SLM) orders.

    SL orders consist of a price plus trigger price. When the trigger price is reached, your Stop Loss order is triggered and a limit order is will be sent to the market. The limit order executes between your price and trigger price range only.

    For example, you buy a stock at $100 and place a sell stop-loss order with the price at $98 and trigger a price of $98.50. When the price of the stock reaches or goes below $98.50, your stop-loss order is triggered. A sell limit order with a limit price of $98 is sent to the exchange order queue. Since a limit order is executed at the best available price. If the price of the stock is at $98 or above, your sell limit order of price $98 will execute.

    Is possible a stop-loss order not work?

    Of course, it is possible.

    A sell limit order is sent to the exchange only when the sell stop-loss order is triggered. When the price of $98.50 is triggered, a sell limit order with a price of $98 is sent to the exchange order queue. But if the price of the stock falls below $98 before your order reaches the queue? The sell limit order will stay open and your stop-loss order will not be executed yet. This possible scenario can be overcome by a stop loss market order.

    The stop-loss market order consists of a trigger price. When the trigger price is touched or passed, your stop-loss market order is triggered and a market order is sent to the exchange. The market order is executed at the market price.

    For example, you buy a stock at $100 and place a sell stop loss market order with a trigger price of $98.50. When the price of the stock reaches or goes below $98.50, your stop loss market order is triggered. A sell market order is sent to the exchange order queue and will execute at whatever is the available market price. The point is that a market order always goes through and your stop-loss order will be executed at any moment happens.

    Stop Los orders do they work?

    These orders can also be used to lock in a profit. It’s important to understand that stop-loss orders are different from limit orders. Limit orders can be executed if you can buy, for example, stock at a specified price or more beneficial. What will happen when the markets are fast-moving. In that case, your stop-loss orders may not be filled precisely at the specified stop price level. But it will be filled reasonably close to the specified stop price. Traders should understand that in some extreme cases stop-loss orders may not provide much protection.

    The main goals of this order are to low the risk exposure and to make trading easier. Traders are urged to always use them whenever they enter a trade, in order to limit their risk and avoid a potentially catastrophic loss. Stop-loss orders help to make trading less risky when limiting the amount of capital at risk on any trade.


  • Cryptocurrency Market – How It Works

    Cryptocurrency Market – How It Works

    Cryptocurrency Market
    This market is in permanent growth, its volatility and unpredictable liquidity are a reality.

    By Guy Avtalyon

    The cryptocurrency market has been segmented into mining and transaction, based on the process. In the mining process, there is a greater necessity for hardware than it is a case in the transaction process. Therefore, the market for hardware for the mining process is larger than that for software. Furthermore, a miner can take part in this process with a small investment.

    Cryptocurrency is used for various applications, such as trading, remittance, and payment. These applications drive the market for cryptocurrencies.

    Trading the cryptocurrency market

    Cryptocurrency trading cover exchanging fiat currency with crypto. Also, it refers to exchanging, buying, and selling of cryptocurrencies. It meets some similarities of foreign exchange or forex wherein fiat currencies we can trade 24 hours a day. The number of cryptocurrencies has increased exponentially; currently, there are more than 1,500 cryptocurrencies available. Some of these coins can only be vested using major cryptocurrencies such as Bitcoin or Ethereum. To contribute to initial coin offerings (ICOs), one needs to perform trades or use a blockchain company’s services.

    A large number of players are investing in developing payment gateways and platforms for the payment process of their currencies. When a customer makes a purchase using a cryptocurrency as payment, the transaction often goes through the payment gateway at a fixed exchange rate. It automatically converts to traditionally recognized fiat currency so the merchant can avoid the volatility of the cryptocurrency markets. The payment through cryptocurrency has several advantages. Enhanced transactional security, protection from fraud, decentralized system, low fees, quick international transfers.

    Why invest in the cryptocurrency market?

    Volatility and unpredictable liquidity are a reality of the cryptocurrencies market. You could have made tons of money if you had invested in bitcoin earlier but you would’ve lost a lot of money if you had started investing in the last few months. Because when investing in cryptocurrencies, many traditional assumptions fall flat. Managing risk in financial markets is a well-established discipline. Whether investing in equities, bonds, or currencies usually practices protect market practitioners when they are buying, selling, or intimidating. Risks are typically aligned into different categories. Market risk, credit risk, and operational risk, and complex formula are used to determine how much capital should be kept in reserve to absorb losses. The historical progress in bitcoin has increased risk appetite both for existing and newer traders. It comes with the realization that even a small exposure to cryptocurrencies could turn out to be lucrative.


    The cryptocurrencies market is still developing. There are concerns about the potential for fraud and market manipulation. So, investors must take the necessary precautions. These individual risks are much more difficult to measure and manage when investing in cryptocurrencies.

    Institutional demand for digital currencies 

    So far, most institutional investors, including banks, insurance companies, pensions, and hedge funds, have avoided cryptocurrencies. But, that attitude is beginning to change and institutional investors will soon be entering the market in a major way.

    This year (2018) has been challenging for crypto investors. Global market capitalization fell amidst worries over fraud risk, escalating token issuance, and ever-shifting cyber-security threats. Accusations of market manipulation and concerns around potential naked short selling are also doing little to lessen institutional investors’ concerns about cryptocurrencies.

    The effect in the market

    Every big trader can exploit market illiquidity and shifting margin rules and contract limits at inexperienced cryptocurrencies exchanges. This causes a domino effect in the market and institutional investors rather stay away. The complexities and shy institutional uptake for the new cash-settled bitcoin futures products demonstrate that. But the industry must move towards a futures contract that is settled with proper warehousing standards.

    Counterparty risk and custody provisions are even bigger worries for institutional investors. Although cryptocurrency exchanges are significant new platforms, they have been largely designed by the younger generation of developers. Financial institutions care more about the return of capital rather than return on capital. They are wary of the professional indemnity behind these platforms. We believe that now’s the right time for institutional investors to look seriously at making investments into cryptocurrencies. They should take part in the cryptocurrencies market.

    Cryptocurrency market – potentially unlimited upside

    The unpredictability of risk and the potential for high returns is the main characteristic of cryptocurrencies market. The most intelligent approach for new investors might be to hold a very small proportion of their portfolio in cryptocurrencies. This would give some exposure without excessive risk as the market continues to mature.

    By the end of 2017, a lot of portfolio managers had to explain to their clients why they had only achieved single-digit returns in traditional asset classes. At the same time, some crypto funds had earned up to 2,000 percent from volatility. This shows, there is a little downside from investing 1% of the portfolio in cryptocurrencies, but the potential upside is almost unlimited.

    The cryptocurrency market continues to attract new participants and liquidity should improve. This will take the time that’s the truth. Within a couple of years, cryptocurrencies will become a standard part of a diversified portfolio.

    The stock market has a rich and mature history. It has seen many bubbles, market crashes, and economic recoveries. The growth of the cryptocurrencies market continues. If traditional stock exchanges continue to keep away from cryptocurrencies, they’ll miss out on a growing and profitable market.

    Finally, the financial crisis of 2008  actually gave birth to Bitcoin.

  • Bitcoin Price Hits a New Low Level

    Bitcoin Price Hits a New Low Level

    2 min read

     Bitcoin Hits New Low Value

    • Bitcoin is currently sitting in the volatility of the market, though it is hard to predict how investors will react to the recent events.

    The aggressive dump can be a result of panic selling caused by the breakout from the $5600. Many interpreted this as “the bottom”. Since the price went below what many thought to be the bottom a panic selling would have triggered. The bitcoin’s lowest price in bear markets has been $5600.

    Right now the price of bitcoin is around $4,600, but yesterday BTC stumbled down to $4,237. Over the past 24 hours, the price of Bitcoin fell from $4,900 to $4,280, by more than 12.5% for the first time in 2018. Ripple (XRP) markets have been doing better than most but had dipped to a low of $0.41 per XRP. The XRP token was down 6.6%, and over 13.4% over the last seven days. XRP is now back up to $0.46 per token according to the most recent data. Ethereum (ETH) now commands the third position among the top 10 cryptos market capitalizations and is down 35% for the week. Currently, ETH is trading for $144 per coin and holds $14.8 billion market valuation. Lastly, stellar (XLM) has been pushed back to the fifth position and is trading for $0.21 this Tuesday. Stellar markets are down 23% for the week but briefly managed to take the fourth position among the top 10 market caps.

    Bitcoin Price Hits New Low Level

    Some media reported that the low trading volume of BTC in a period of an intense sell-off and free fall suggests a further decline to the low $4,000 region is likely, especially if the volume of BTC begins to increase in the days to come.

    Is bitcoin going to hit new low price?

    It is really possible the volume on Bitcoin could lead to a decline to a low range at $4,000. But what does it mean?

    The sell-off continues in the crypto universe as the main cryptocurrencies set new minimums.

    Economist Nouriel Roubini is known as “Dr. Doom” declares that the main central banks’ initiative to launch their blockchain based currencies will compromise the future of the current cryptocurrencies.

    The argument is reasonable from the perspective of the current situation but he forgets to put all the elements on the balances.

    Tomas Salles from fxstreet.com asked one very important question and gave the answer: ‘If someday the current financial system collapses in the face of unpayable debt, what security does it provide that the instrument is digital, reliable and decentralized? If that day arrives, I will prefer to get my paycheck in Bitcoins than in a currency that is worth less every day while the central banks raise rates in despair.’

    Will bitcoin recover?

    Bitcoin is currently sitting in the volatility of the market, though it is hard to predict how investors will react to the recent events.

    Analysts have suggested that 2018 will be the year of cryptocurrencies. Wall Street hedge fund firm Fundstrat’s CEO Tom Lee has regularly predicted bitcoin to exceed expectations in 2018, with prices pushing past $25,000. Bitcoin’s famous volatility makes it impossible to predict, that’s the truth. And there are numerous factors that have an influence on the cryptocurrency market.

    The values of Bitcoin, Ripple, and other cryptocurrencies have been crashing lately, but one analyst is predicting a huge rise ahead for Bitcoin with a forecast for it to reach as high as $100,000 in 2018.

    Kay Van-Petersen, an analyst at Saxo Bank, said in December 2016 that bitcoin would reach $2,000 in 2017, a feat achieved in May. He now says bitcoin will be driven by a larger uptake of institutional investors and futures contracts.

    Bitcoin Price Hits New Low Level 2

    That might seem unlikely. But the analyst predicting Bitcoin’s 2018 surge has been right before. Toward the end of 2016, the Danish firm Saxo Bank released its annual list of “Outrageous Predictions” for the year ahead. In it, the bank’s analysts said that Bitcoin could easily triple in value in 2017. That prediction came true by the spring of 2017. Bitcoin went on to increase from around $9,000 to $18,000 in the course of the year.

    Why Bitcoin is swinging up and down?

    In 2017, Bitcoin’s value soared from $1,000 to just under $20,000. And was dropping down to around $13,000 by the end of the year. Since then, it’s value has risen and dropped sporadically from day to day.  And smaller cryptocurrencies like Ether and Ripple along with it too.

    If you’re new to cryptocurrencies, this kind of volatility can be strange. But if you take a closer look it starts to make sense.

    Individual owners have less power over the price of Bitcoin, and it creates stability since more people have a stake in the cryptocurrency. The other possibility is that government regulation could help stabilize Bitcoin. In the short term, that could cause its value to drop drastically as it happened in China and South Korea. But in the future, it could help calm down the speculation. Furthermore, regulation could dislodge the types of dark Bitcoin-related business that jeopardize the entire concept of cryptocurrencies.

    Cryptocurrency price will rise despite fears of a collapse

    Bitcoin has been the top-performing currency in the world in six of the past seven years.

    Bitcoin’s price will rise again, after the digital currency and its rivals saw values plummet. Crypto investors suggest cryptocurrencies could surge. Bitcoin is now tested and proven to the market. People now understand the blockchain’s abilities from outside issues. Bitcoin is gaining more confidence from users. The upside for bitcoin is virtually limitless.
    Or as someone twitted

    Ignore the noise, trust the code.

    Risk Disclosure (read carefully!)

  • Momentum trading

    Momentum trading

    3 min read

    Momentum trading

    • Momentum stocks are among the most exciting stocks to trade.

    Momentum trading refers to the tendency of stock prices to continue moving in the same direction for several months after an initial impulse. The most basic form of momentum is price momentum, where the initial impulse is simply a change in the price itself.

    Momentum has been defined as a force that sustains the movement and increases the strength of that movement. This two-fold nature of momentum is seen in what traders and investors call “momentum stocks”. A momentum stock is a stock that is trading in a sustained trend, either up or down, the strength of which is expected to increase over the near term.

    Momentum stocks are among the most exciting stocks to trade.

    Momentum trading is inherently challenging to explain within a traditional asset pricing model. Such a model requires that high average returns are simply compensation for some form of risk. But stocks that have risen recently, or have had positive earnings surprises. Hence, typically seem to have lower risk, not higher risk as would be required for risk to explain momentum.

    What is momentum trading?

    Momentum trading is a technique in which traders buy and sell according to the strength of recent price trends. Price momentum is similar to momentum in physics. The mass multiplied by velocity determines the likelihood that an object will continue on its path. In financial markets, however, momentum is determined by other factors.  Like trading volume and the rate of price changes. Momentum traders bet that an asset price that is moving strongly in a given direction. And it will continue to move in that direction until the trend loses strength.

    British economist and investor David Ricardo used momentum-based strategies successfully in trading. He was well known in this field. How he did it? He bought stocks with strong performing price trends. And then sold stocks whose prices were performing poorly. He characterized the method with the phrase: “Cut short your losses; let your profits run on.”

    Momentum trading can be classified into two categories:

    Relative momentum and absolute momentum.

    The Relative momentum strategy is where the performance of different securities within a particular asset class are compared against one another. Investors will favor buying strong performing securities and selling weak performing securities.

    The Absolute momentum strategy is where the behavior of the price of a security is compared against its previous performance in a historical time series.

    In currency trading, either relative or absolute momentum can be used. But you have to know that momentum trading strategies are more frequently associated with absolute momentum.

    How to employ momentum strategy?

    Momentum can be determined over longer periods of weeks or months, or within day-trading time frames of minutes or hours.

    The first step traders usually take is to regulate the direction of the trend in which they want to trade. The trader can use one of several momentum indicators. Then such trader may establish an entry point to buy (or sell) the asset they are trading. After that trader has to determine a profitable and reasonable exit point for a trade. The trade must be based on the projections. And previously observed levels of support and resistance within the market.

    Momentum trading 1
    Besides that, it is highly recommended to set stop-loss orders above or below their trade entry point. That depends on the direction of the trade. This is in order to avoid the possibility of an unexpected price-trend reversal and undesired losses.

    Momentum indicators

    A momentum indicator is a tool used for determining the momentum of a particular asset. They are graphics devices. Often in the form of oscillators. That can show how rapidly the price of a given asset is moving in a particular direction. Also to whether the price movement is probably to continue on its course.

    The idea behind the tool is that as an asset is traded, the rate of the price movement reaches a maximum. In the moment when the entrance of new investors or money into a particular trade nears its maximum. When there is less new investment available, the tendency after the maximum is for the price trend to devastate or reverse direction.

    Momentum trading 2
    The trader can determine the direction of momentum. The trader has to subtract a previous price out of a current price. That’s all. A positive result is a signal of positive momentum. The negative result is a signal of negative momentum.

    Momentum tools typically appear as rate-of-change (ROC) indicators, which divide the momentum result by an earlier price. Multiplying this total by 100, traders can find a percentage ROC to plot highs and lows in trends on a chart. Say the ROC approaches one of these extremes. You can see an increasing chance the price trend will weaken and reverse directions.

    Other momentum tools

    Here are a few of the technical indicator tools that traders commonly use to track momentum. They may provide you to know whether it’s a good time to enter or exit a trade within a trend.

    Moving average: It can help to identify overall price trends and momentum. How to calculate the moving average? The trader should add the closing prices over a certain number of periods. And by dividing the result by the number of periods considered.

    Relative strength index (RSI): It measures the strength of the current price movement over recent periods. The aim is to show the probability if the current trend is strong. Of course, in comparison to previous performance.

    Stochastic oscillator: It compares the current price of an asset with its range over a defined period of time. What we can see when the trend lines in the oscillator reach oversold conditions? They indicate an upward price momentum is at hand. And when they reach overbought conditions they indicate that sinking price momentum is ahead.

    Moving average convergence divergence (MACD): It is an indicator that reveals both price momentum and possible price trend reversal points. When the lines are farther apart, momentum is strong. Therefore, when they are converging, momentum is slowing. That means the price is likely moving toward a reversal.

    There are also other indicators like the commodity channel index (CCI), on balance volume (OBV), stochastic momentum index (SMI), average directional index (ADX), building block.

    Is momentum trading risky?

    Like any style of trading, momentum trading is risky. It’s normal to be successful when prices follow on a trend. But the problem is that momentum traders can be caught off guard. It is happening when trends go into unexpected reversals. Hence, traders should remember a few things and adopt them:

    Technical analysis bases its projections of the probability of price movements on past price trends.

    Prices in the market can move in an unforeseen manner at any time due to unexpected news events. Moreover, because of fears and changes in sentiment in the market.

    The bottom line

    Momentum is a key concept that has proven valuable for determining the chances of a profitable trade. The trader may use measurements of momentum in the short and long term. They are useful in all types of trading strategies. Several technical trading tools are available to reveal the strength of trends. Also, whether a trade on a particular asset may be a good bet.

    Traders should know that momentum projections are calculated using measurements of past price trends. Actual momentum and price can change at any moment. So, it’s important to take preventative measures, such as setting stop-losses.

    Risk Disclosure (read carefully!)

  • Bitcoin is the evil spawn?

    Bitcoin is the evil spawn?

    1 min read

    Bitcoin is the evil spawn?

    According to a report in the Financial Times,  Benoit CƓurĂ©, a member of the Executive Board of the European Central Bank (ECB), has become one more member of the banking old guard to discredit Bitcoin.

    The executive spoke in Basel, Switzerland, yesterday.

    “Lightning may strike me for saying this in the Tower of Basel — but Bitcoin was an extremely clever idea. Sadly, not every clever idea is a good idea.”

    CƓurĂ© repeated the opinion of Mexican economist AgustĂ­n Carstens who said that Bitcoin shared characteristics with speculative bubbles, and Ponzi schemes, along with being a pending environmental catastrophe waiting to happen. Also, CƓurĂ© dismissed the importance of a decentralized monetary system by stating that such thinking was “evil spawn of the financial crisis.”

    How he recognized Bitcoin?

    He correctly recognized that the Bitcoin appeared following the 2008 financial crisis. But he avoided saying how an honest effort to free the world of the bad effects of a corrupt central banking system can be evil.

    EU statement on ‘ bitcoin the evil spawn’ came after Lagarde’s declaration for CBs to adopt Digital currencies!
    So, we can ask a few questions.

    Are they scared and trying to encourage themselves? If Bitcoin is evil spawn and worthless, why do central banks even care? Who caused the last few recession?

    In a way, he accepted that “Central Banks are the devil”.

    Why?

    The French economist underlines that it’s unlikely a central bank will issue a digital currency within the next decade.

    The ECB official’s stance is at odds with remarks from International Monetary Fund (IMF) managing director Christine Lagarde. Speaking at the Singapore Fintech Festival Nov. 14, Lagarde urged the international community to “consider” endorsing central bank-issued digital currencies (CBDC). She claimed they “could satisfy public policy goals,” specifically “financial inclusion.”

    Coeure’s argument is also directly contrary to that of Stanley Yong, Chief Technical Officer (CTO) of IBM’s Blockchain for Financial Services. He stated this week that CBDCs are “the only way” to reduce the “kinds of risks that came about during the Lehman crisis of 2008,” and could prevent a settlement system freeze and failure that affected financial systems across multiple countries during the Lehman fallout.

    Of course, it is understandable for leading bankers to reject Bitcoin publicly.

    CƓuré’s “evil spawn” is one in the line of those who are against the cryptocurrency.  Do you remember what JPMorgan CEO Jamie Dimon’s said: famous “fraud” blast! Investing legend Warren Buffett ’s said “rat poison squared”, and Buffett’s buddy Charlie Munger’s screamed cryptocurrency is “scum-ball activity”.

    What is their goal?

    They want this cryptocurrency thing to disappear. And they want us not thinking quite so critically about money and the way the banking system works.

    That’s the point!

    However, the true is that Bitcoin appeared and continues to function as intended.

    Or we may ask bankers about their history of using inflation to increase the inequality discrepancy.

    Risk Disclosure (read carefully!)

  • Margin Trading Definition

    Margin Trading Definition

    2 min read

    Margin Trading Definition
    Margin trading isn’t without risks involved, so pay more attention to it

    Margin trading is simply the process where investors buy more stocks than they can afford to. It also refers to intraday trading in India and various stockbrokers provide this service. It can increase your profits on the upside, but also expand your losses on the downside. Margin trading means buying and selling stocks or some other assets in one single session. This process requires a trader to guess the stock change in a particular session. It is an easy way of making a fast buck. It is now accessible to even small traders.

    What is margin trading?

    Margin trading is also called buying on margin. It is a method of buying shares that involves borrowing a part of the sum needed from the broker executing the transaction. The collateral for the loan is normally securities in the investor’s account. The trader has to deposit an initial amount of cash or securities into a margin account with the broker. And has to keep a minimum amount of cash or securities in the account as collateral. If the balance of a margin account falls below the minimum maintenance amount, the broker makes a margin call to the trader for the funds needed. Margin balances can be adapted to follow market values by adding or subtracting variation margins.

    What is buying on margin?

    Buying on margin gives the investor leverage as any capital appreciation or dividend income is on the total amount purchased. Even after the amount borrowed has been repaid to the broker, with interest, the investor could still be better off than if he/she had personally financed the purchase of a smaller amount of shares. That depends on how much the shares gain and how much they yield. There are some risks with margin trading – if the shares fall in value, the investor suffers a capital loss while also facing potential margin calls from the broker.

    An example of margin trading

    Margin trading is meant for traders who are looking for a simple way to increase their earnings. And also, they have a reasonable level of risk appetite but do not have enough capital.
    Let’s say you are 100% bullish for the big company and believe the stock is going to pick up.  You want to buy 1000 shares of that company and each share is priced at $200. You would need a capital amount of $200,000 to enter that position.
    Assuming you have $150,000 and want to borrow the rest of the capital. With margin trading, your broker can help you with the rest of the funds while charging you a specific interest percentage.

    How does margin trading work?

    The whole process is quite simple. Margin trading is legal buying stocks or other securities, but instead of your own money, you borrow it from your broker.
    Think about buying stock on margin as buying a house with a mortgage. A margin account provides you the financial support to buy more stocks than you can currently afford. For this purpose, the broker will lend you money to buy shares and keep some amount as collateral.
    If a trader wants to trade with a margin account, the first requirement will be to request a broker to open a margin account. This requires paying a specified amount of money upfront and in cash. That is so-called the minimum margin. If a trader has a losing bet and ends in losses, and fail to pay the debt, the broker will get it out from the margin account.
    When you open the margin account, you’ll have to pay an initial. This is a specific percentage of the total traded value and pre-determined by the broker. Before you start margin trading, you need to keep in mind these important steps.
    First, you need to secure the minimum margin (MM) through the trading session. The reason behind this: if the stock is very volatile, the price can fall more than you had expected.
    Second, the broker has the right to ask you to increase the amount of capital you have in your margin account. Also, the broker has the right to sell any of your securities if feels its own funds are at risk. The broker can even sue you if you don’t fulfill a margin call or if you are carrying a negative balance in your margin account.

    Margin trading if the stock price goes up

    This is the best outcome for you.  Let’s do some math (I adore math).

    Say you bought 100 shares for $4000. But you had $2000 and broker loans $2000. If the price goes to $50 per share, your investment will be worth $5,000. Your outstanding margin loan will be $2,000. If you sell, the total proceeds will pay off the loan and leave you with $3,000. Because your initial investment was $2,000, your profit is a solid 50%. Your $2,000 principal amount generated a $1,000 profit. However, if you pay the entire $4,000 upfront without the margin loan your $4,000 investment will generate a profit of $1,000, or 25 percent. By using a margin, you could double the returns.

    The stock price fails to rise

    If the stock stays at the same price, you still have to pay interest on that margin loan. You are in a better situation if the stock pays dividends because that money can pay some of the costs of the margin loan if not all. In other words, dividends can help you pay off what you borrow from the broker.

    Margin Trading 1
    When the stock doesn’t change in price it is a neutral situation, but you’ll pay interest on your margin loan for each day. Margin trading can be a good plan for traditional investors if the stock pays a high dividend. Many times, a high-payed dividend, for example, $5,000 worth stock, can exceed the margin interest you have to pay. For example, if you had $2.500 and you borrowed the other $2,500, which is 50% of stock’s value. But you expect to receive $3.000 as a dividend, so you’re safe.

    Margin trading when the stock price goes down

    If the stock price drops, buying on margin could work against you. What if the price in our example goes to $38 per share?
    The market value of 100 shares will be $3.800. So, your capital will shrink to just $1,800 because you have to pay your $2,000 margin loan to your broker. This isn’t real trouble at this point, but you should be cautious. The margin loan is 50% of your investment. If it goes lower, you may get the margin call. The broker will demand you to keep the ratio between the margin loan and the value of the securities the same as it was when he lends you money. That’s why margin trading can be very dangerous.

    How to maintain the balance in margin trading?

    When you buy stock on margin, you must maintain a balanced ratio of margin debt to equity of at least 50 percent. If the debt portion exceeds this limit,  you’ll be required to restore that ratio by depositing either more stock or more cash into your brokerage account. The additional stock you deposit can be from another account. If you can’t come up with more stock, other securities, or cash, you have to sell stock from the account and pay off the margin loan. For any trader, it means having a capital loss. For you also, because you lost money on your investment.

    The bottom line

    As you can see,  the margin can increase your profits on the upside but also increase your losses on the downside. If your stock drops drastically, you can end up with a margin loan that exceeds the market value of the stock you used the loan to buy. In the bear market of 2000, for example, many people realized stock losses. The majority of these losses came as a consequence because traders did not manage properly the obligations associated with margin trading. To avoid this kind of problems you must have sufficient reserves of cash or marginable securities in your account.
    For example, buying dividend yields that exceed the margin interest rate could be the right choice so the stock could pay for its own margin loan. Just keep in mind to set up your stop-loss orders. Your goal is to make money, and paying interest could eat your profits.