
2 min read
February 18, 2019
The Swedish krona is the worst-performing significant currency this year. It faced volatility on Swedish inflation data Tuesday. It looks the markets may be underestimating the risk for a surprise.
According to SEB AB January is the month of the year with the most volatile inflation data. But a check of one-week price fluctuations in the euro-krona exchange rate implies traders are relatively satisfied.
One-week implied volatility in the cross is trading around 50 basis points below its one-year average. The relative premium to own exposure to short-term risks stands below par. That suggests investors can hedge themselves through insignificantly under-priced option plays.
The Swedish krona has been damaged this year by doubt that the country’s central bank can stick to a plan to hike interest rates in the second half of the year. Karl Steiner, a strategist at SEB said that Inflation is the second-biggest driver for the krona among Swedish data and events, after Riksbank policy announcements.
“Stars seem to be aligning for out-sized moves in the krona considering the event risks that lie ahead,’’ said Fredrik Lockne, an options specialist at SEB. “Implicit volatility looks rather cheap, in particular over the two-week tenor which captures both inflation and growth data.’’
January data has the obvious inclination for downside surprises in headline inflation, at 71 percent of the time over the past seven years, SEB said. Swedish consumer prices are forecast to have dropped 0.7 percent in January on a monthly basis, from a 0.4 percent rise in December, as many stores cut prices after Christmas holidays. Inflation is forecast at 2.2 percent in annual terms, versus 2.0 percent in December.
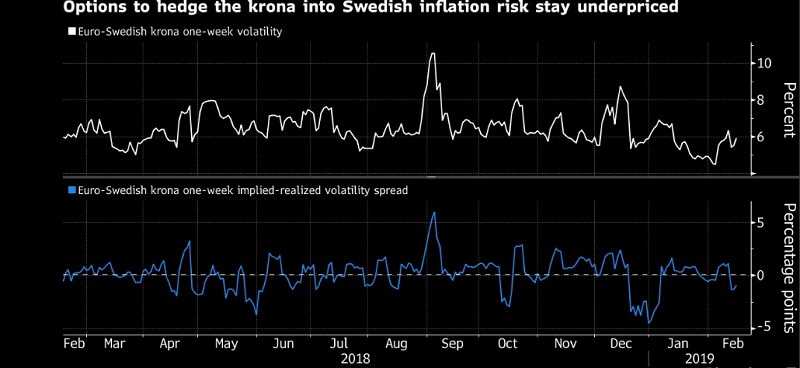
Image source Bloomberg: Swedish krona
Best Exchange Rate: 10.6955 on 29/08/2018
Worst Exchange Rate: 0 on 18/02/2019
Mid Exchange Rate: 10.3044 on 17/07/2018
Other currencies:
EUR/USD
The trend is bearish in the 1-hour chart. Intraday resistance is at 1.1341 price level. This means, as long as the price stays below 1.1341 resistance level, you should look for sell trades. If bullish candlestick closes above 1.1341 critical resistance level, then down trend is going to end.
GBP/USD
The trend is bearish in the 1-hour chart. Intraday resistance is at 1.2995 price level. As long as the price stays below 1.2995 resistance level, you should look for sell trades. If bullish candlestick closes above 1.2995 resistance level, which stands as critical, then down trend is going to end.
USD/JPY
The trend is bullish in the 1-hour chart. Intraday support is at 110.08 price level. As long as the price stays above 110.08 support level, you should look for buy trades. If bearish candlestick closes below 110.08 critical support level, then up trend is going to end.
USD/CAD
The trend is bullish in the 1-hour chart. Intraday support is at 1.3195 price level. So, as long as the price stays above 1.3195 support level, look for buy trades. If bearish candlestick closes below 1.3195 critical support level, then up trend is going to end.
USD/CHF
The trend is bearish in the 1-hour chart. Intraday resistance is present at 1.0110 price level. So, as long as the price stays below 1.0110 resistance level, look for sell trades. If bullish candlestick closes above 1.0110 critical resistance level, then down trend is going to end.
Leave a Reply