Tag: Stock

All stock related articles are found here. Educative, informative and written clearly.

  • Stock Market Bottom And How To Recognize It

    Stock Market Bottom And How To Recognize It

    Stock Market Bottom And How To Recognize It
    Nobody can with certainty predict a stock market bottom. Still, it’s worth at least thinking about different entry points to let your money work for you.

    By Guy Avtalyon

    The questions for the past several weeks mainly were all about the stock market bottom. Did the stock market hit the bottom? Will the stock prices stop dropping? Have stocks reached support levels? When will prices stop falling? 

    Stock traders have so many questions these days and weeks. But do they really know where to look? 

    Maybe one of the most terrifying jobs related to investing is about the stock market bottom and how to recognize it. The idea to predict when a given stock will hit the bottom is old as much as investing and trading. The point is to recognize the point where the stock will no longer drop. The rule of thumb is: buy low, sell high. The problem arises when we have some unpredictable events in the market such as this one, coronavirus pandemic. That has an influence on the global economy, almost all economic and political events, and decisions. So, with a high level of certainty, we can say finding the stock market bottom can be a discouraging job.

    Well, this kind of question traders ask almost every day but are they looking in the right place to find the answer? For example, investors are looking at Dow Jones. Is it the right place? We are afraid that the value of DJIA isn’t able to alarm you when the stock market hits the bottom. Okay, it will tell you but after it happened. 

    So what to do? 

    How to recognize the stock market bottom? 

    If you want to find it, you’ll need some indicators. Indicators can tell you when is the stock market going to hit a bottom but also when it is going to recover. By using indicators you’ll not miss the beginning of the wave. When buying a stock you want to do so at the lowest possible price but you wouldn’t like to hold falling stocks. You would like them to start rising after you bought them, right? That’s why it is so important to recognize the stock market bottom. The point where the stock can find support.

    That knowledge can give you huge profits and prevent huge losses. So, how can we know with certainty that a stock has touched a low point? To be honest, no one can do that with 100% certainty and consistency, but traders and investors have some tools, fundamental and technical trends, and indicators. They arise in stocks when they are about to tap the bottom.

    The indicators of stock market bottoms

    Some indicators can help us determine when the stock market is going to form a bottom. What we really need to have are indicators of the health of a global economy and what the main participants in the market are doing with their money. But keep in mind, there is no such thing as a magic indicator to identify a stock market bottom. We have to look at several indicators to have an idea of the economy’s and stock market’s health.

    Second, we have to look at history because it will tell us that the average bear market persists about 17 months. Also, it corrects around 35% from the maximum. But keep in mind that you cannot find the two bear markets alike 100%. All we can do is to suppose that the next will be similar. 

    Further, we have to understand the valuation. For example, the S&P 500 has a P/E ratio and earnings. The P/E ratio will move up and down depending on the market period. It will be up when we have good earnings growth, all ratios including the P/E ratio will go up. But when the circumstances are changed, with rising pessimism the valuation is likely to go down. 

    For example, when the S&P Index was above 2.500 the P/E ratio was at 19.

    Also, the higher the VIX is, the chances for the stock market to hit the bottom are growing. These first two days in April this year, VIX traded between 54 and 57. If we take a look at historical data we can see that in 2008, the VIX was somewhere between 70 and 95. During the March this year, VIX traded over 75.

    Other indicators of the stock market bottom 

    The stock market fell over 25% in 3 weeks. This is the sharpest drop in history. The biggest decline occurred on March 12th, the biggest since the market crash in 1987. Many investors thought that a stock market hit a bottom. 

    If you want to recognize when the stock market bottom is, check out your emotions. Did you feel fear at that time? If yes, you were one of the millions with the same emotion. Fear was so obvious in the middle of March. To be honest, almost all were panicked.

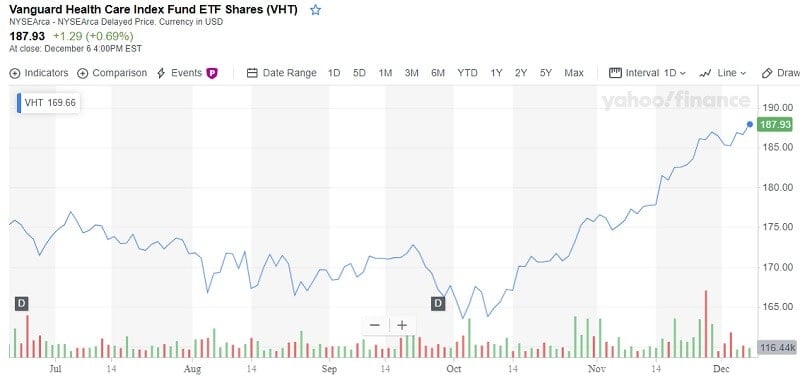
    But we have to try to be reasonable. Just take a look at the charts and the technical levels for those days. Can you notice the major pivot? Do you notice a bottoming tail and a huge volume? 

    Okay! A major pivot, bottoming tail, and a huge volume on the same day and combined with a market 3-weeks decline of 25%, are indicators there was some at least short-term bottom.

    What to do when the stock market is near the bottom?

    The most intelligent investors started to buy those days. Small chunks, nothing big. Smart investors are doing such a thing to accumulate their full positions. The point is to buy 25% or 30% even 50% of the total position. That will keep your potential stress down and provide you an all in all a better average. But remember, don’t buy some small-cap, go for the brands. 

    Where is the market bottom now? 

    That is the most frequently asked question since coronavirus appeared. 

    Market experts like to say that it’s impossible to time the market. Well, it isn’t the truth. If we can see the market tops, why shouldn’t we see the market bottoms? Institutional investors know that. Follow what they are doing. Their actions could be the key bottoming signal. Follow-through has been noticed at almost every stock market bottom. This signal is extremely important because it can provide you profits when the early stages of a new market uptrend is confirmed.

    The quest for a stock market bottom

    This signal works quite simply. When there is a sustained stock market downturn, the first rising day from the index low is most important. That could be the beginning of a rally attempt. No matter which index you are using S&P 500, Dow Jones or Nasdaq. 

    According to some experts, the gain expressed in percentages isn’t important at this point. Also, don’t pay attention to the trading volume. What you have to look at is a down session and the moment when the index bounces after a great drop and closes close to session highs. Some experts deem that closing in the top half of the day’s trading range is adequate also.

    Further, find a bigger percentage gain in higher volume than the prior session several days in the rally attempt. This time period is making it possible for short covering to resolve and for a rally attempt to gain ground. The rally will be halted in place only if the index reaches a new low.

    How will the market react after the pandemic?

    It is good if the market supports the new buyings, but if it doesn’t, just be patient. Sometimes, breakouts are visible on the charts after a few weeks. This market crash caused by the coronavirus outbreak has a large supply of stocks making the new base. But a lot of them have yet to bottom.

    If an index suffers a decline in higher volume shortly after the follow-through day, the signal will fail in most cases. If close below the low of the follow-through day, it is almost the same. It is more the sign to start selling the stocks you bought recently.

    These signals don’t mean you should rashly jump into the market since they tend to fail after indexes have dropped clearly in a short time. That happened with the stock market correction in February. The more suitable is to buy a few stocks, maybe one or two, and test how they will work. If there is a real uptrend your stocks will rise.

    Every investor wants to know when trends are going to make a significant change. Will they reach tops or bottoms. The truth is no one knows that for sure. Only the big volume spikes, and staying stick to the chosen sector, will give you some clue if the stock has reached the lowest level from which it will not decline more. We pointed just one of the numerous scenarios. There are many others. 

  • Risk Management Strategy For Buying Stocks

    Risk Management Strategy For Buying Stocks

    Risk Management Strategy For Buying Stocks
    Risk management is the most important thing that you can learn if you want to trade stocks. That will provide you with staying in the game.

    By Guy Avtalyon

    A risk management strategy for buying stocks means you have a plan. It seems a bit fishy to suggest that you can simply search for  “high yield” and “low risk” and find trading opportunities that will beat the odds in the stock market for sure and do it with minimum risk. If it is so simple, why do we have losing trades? How is it possible that no one is doing that?  What forces you to choose low yield stock with high risk? Must we really be a genius to be able to find a risk management strategy for buying stocks?

    To be honest, smart trading or investing isn’t that simple. In other words, buying stocks requires a risk management strategy among other things. 

    Risk management for some unknown reasons is low placed on the list of the priorities for the majority of stock traders. Every single trader would rather seek the best indicator than to create a risk management strategy for buying stocks. There is no reason to put this very important issue so low. It is the opposite. 

    A risk management strategy for buying stocks has to be on the top of a stock trader’s priorities. Without knowledge about risk management, no one can be a profitable trader. As a trader, you must understand how to manage your risk, how to size your position, how to set the orders accurately. 

    Of course, only if you want to be a profitable trader. In case you don’t stop reading this. For those who want, here is a risk management strategy for buying stocks. Actually, several suggestions. 

    What is a risk management strategy for buying stocks?

    A risk management strategy for buying stocks helps to lower losses. If you have a risk management strategy or you improve it, you’ll avoid most of the problems that can arise and cause you to lose money.

    One of the tips is, determine where you will set your stop loss and take profit order but before you enter the position. At the same moment when you find a good entry point, you have to decide where you’d set these important levels: stop loss and take profit points.

    When you have recognized the right price levels for your orders, you have to measure the risk/reward ratio. If it doesn’t match your goals, stay away from the trade. Never try to stretch your take profit order or squeeze your stop loss to reach a higher risk/reward ratio. Keep in mind that the reward is always potential, it isn’t 100%-sure. What you can control for sure is a risk. 

    Yes, we know very well some beginners in stock trading who do this thing totally opposite. They think it is possible to randomly find a risk/reward ratio and then adjust stop loss and take profit orders to reach the desirable ratio. Well, it is possible but what really you’ll get is a losing trade.

    Can a trader who has made solid profits waste it all in one bad trade?

    Yes, it is particularly true if you don’t have a proper risk management strategy for buying stocks. 

    Failed traders enter a trade without having any idea of break-even stops or what does it mean at all. Somewhere and somehow they picked that phrase and wanted to implement. Please, avoid it. First of all, if you move the stop loss to the level of your entry wanting to create a trade without losses you are entering one of the most dangerous trades. Moreover, such a trade will often end up as unprofitable. Yes, you have to protect your position but this tactic is going to put you into various problems. It is particularly true if you base your trades on technical analysis. How is that possible? Your entry point is very often evident for other traders too. So many of them will have the same or similar entry point. And what can happen? Well, the elite traders will eat you. 

    For example, you enter a short trade when support breaks, and the stop loss point is above the support level. But you move your stop loss to a break-even point in order to protect your trade. What happened? The price goes back into support and takes out your stop loss. Support held but you miss profits. Yes, support validated your trading idea but your risk or, in this case, stop loss management fired you out. You moved too soon. That’s a possible danger which amateurs almost never notice. One bad trade and you lost all your money.

    Set stop-loss points more effectively

    You can do this by using technical analysis, but fundamental analysis can help in timing. For example, you are holding a stock ahead of earnings and drama grows. But you may want to sell before expectations become too high. Use the moving average. For experienced traders, it is maybe the most popular method to set stop loss and take profit points. It’s easy to calculate. Main averages are 5-days, 9-days, 20-days, 50-days, 100-days, and 200-days moving averages. Just apply them to your chart and check how the stock price reacted to them previously, both as support or as a resistance level.

    Also, you can set stop-loss or take-profit levels on support or resistance trend lines. Just connect the prior highs or lows that befell above-average volume. The point is to find the levels at which the stock price responded to the trend lines and on volume. For more volatile stocks use a long-term moving average. This will minimize the possibility of an unimportant price move to execute your stop-loss order before it’s time. 

    Also, you have to adjust moving averages to your target price. For long targets use longer averages. In this way, you’ll reduce the number of generated signals. This will reduce the noise too. If the stock price is changing too much it is the sign of high volatility, set a stop loss adjusted to the market’s volatility. The great help is to know when some major event may occur. For example, earnings reports can be a good time to be in or out of the trade because the volatility can arise.

    Pay attention to extremely low P/E stocks as a risk management strategy for buying stocks

    Don’t think that playing the stock market is easy. Beating it is more difficult. All you need is to find a stock that is trading at fantastic bargain levels. Well, how to find such opportunities?

    One way is to use the P/E ratio. Calculate it by dividing the share price by the number of earnings per share. If the stock is making a high-profit but its share price is low, the stock is undervalued. Beginners may think it is a good opportunity but if they never calculate the P/E ratio they could increase their risk.

    A trick of finding low-priced stocks

    For example, the stock made $4 per share of profit last year. But this stock is still cheap, its share price is $8 and the P/E ratio is, for example, 4. The average P/E ratio for the industry is, let’s say, 16. And you may think this stock should be trading at least over 4 times higher based on this ratio. But remember, that is just one single ratio. 

    This stock doesn’t have such a low P/E ratio without the reason. For example, the earnings are unsteady and the company may have problems paying a debt. So, the stock can be cheap if you look at the P/E ratio as a sole metric but traders noticed an increased risk and volatile stock. That affected its share price and the stock is trading at a lower price with the possible high risk involved.

    So, you’ll need to analyze other earning ratios or numbers. For example, compare the company’s share price to its cash flow per share. Find the industry average.  Only than you’ll if the stock is fairly valued. One note more, if the company boasts a low P/E ratio, be cautious. There is an added risk.  

    Traders-Paradise wants to show you how to do smart trading. A risk management strategy for buying stocks is one of the most important parts of trading. As far as you learn this, the more successful your trades will be. 

  • Adjusted Closing Price – Find a Stock Return By Using It

    Adjusted Closing Price – Find a Stock Return By Using It

    A basic mistake is considering the closing prices of stocks for analysis instead of Adjusted closing price. 

    If you’re a beginner in investing, you probably already noticed the expression like “closing price” or “adjusted closing price.” These two phrases refer to different ways of valuing stocks. While with the term “closing price” everything is clear when it comes to the term “adjusted closing price” things are more complex. 

    When we say closing price it refers to the stock price at the close of the trading day. But to understand the adjusted closing price you will need to take the closing price as a starting but you’ll have to take into account some other factors too to determine the value of the stock. Factors like stock split, dividends, stock offerings can change the closing price. So we can say that the adjusted closing price gives us more exact the value of the stock.

    What is Adjusted Closing Price

    Adjusted closing price changes a stock’s closing price to correctly reveal that stock’s value after accounting for every action of some company. So, it is recognized as the accurate price of the stock. It is necessary when you want to examine historical returns.

    Let’s say this way, the closing price is just the amount of cash paid in the last transaction before the closing bell. But the adjusted closing price will take into account anything that might have an influence on the stock price after the closing bell. When we say anything it is literally anything: demand, supply, company’s actions, dividends distribution, stock splits, etc. So, you will need adjustments to unveil the true value of the stock.

    It is particularly helpful when examining historical returns. Let’s do that on an example of dividend adjustment calculation.

    Adjusted Closing Price
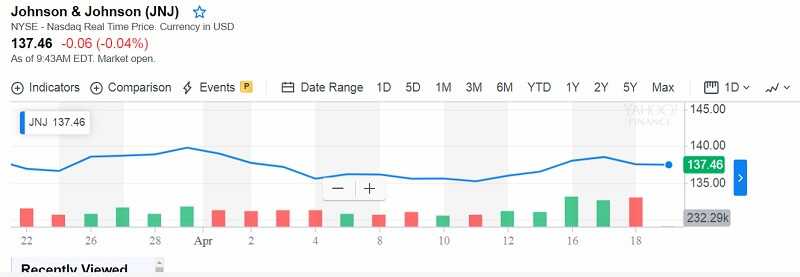
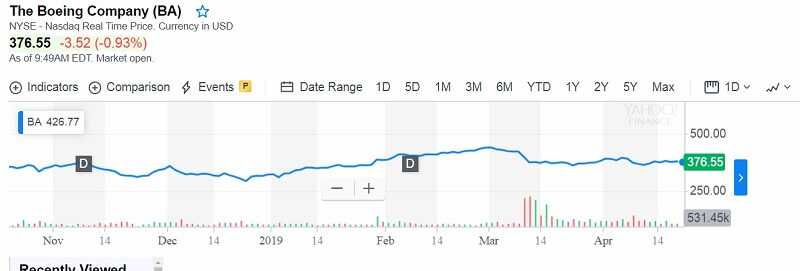
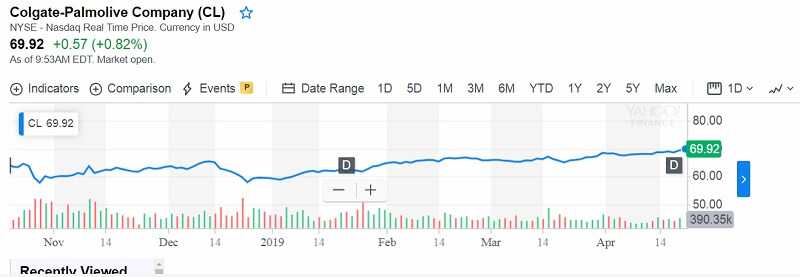
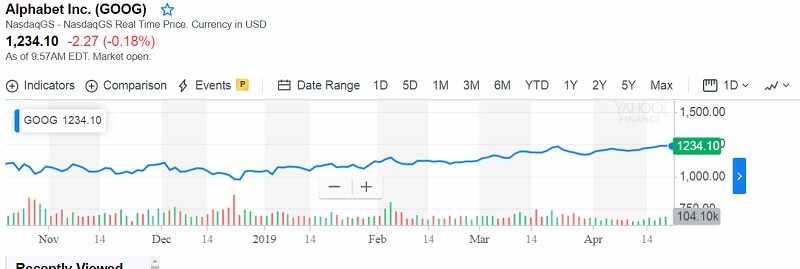
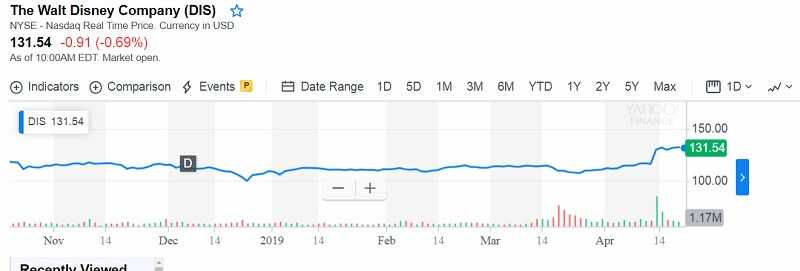
The adjusted closing price for dividends

    When a stock increases in value, the company may reward stockholders with a dividend. It can be in cash or as an added percentage of shares. Whatever, a dividend will decrease the stock’s value since the company will get rid of the part of its value when paying out the dividends. So, the adjusted closing price is important because it shows the stock’s value after dividends are posted.

    Subtract the amount of dividend from the previous day’s price. Divide this result by the same day’s price. Finally, multiply historical prices by this last figure.

    For example, the prior trading day was Tuesday and a stock closing price was $50. The day after, on Wednesday,  it starts trading at a last price minus dividend, for example, trading ex-dividend based on a $4, so the stock will be trading on Wednesday at $46. If we don’t adjust the last price the data, for example, the charts will show a $4 gap.

    What do we have to do?

    We have to calculate the adjustment factor,

    So, by following already described we have to subtract the $4 dividend from the closing stock price on Tuesday (in our case)

    $50 – $4 = $46

    Further, we have to divide 46.00 by 50.00 to determine the dividend adjustment in percentages. 

    46.00 / 50.00 = 0.92

    The result is 0.92.

    Let’s see how to adjust the historical price.

    The next step is to multiply all historical prices preceding the dividend by this factor of 0.80. This will alter the historical prices proportionately and they will stay logically adjusted with current prices.

    After stock splits

    Stocks split occurs when the price of individual shares is too high. So, the company may decide to split stocks into shares. When the company increases the number of shares, the logical consequence is the value of each share will decrease due to the fact that each share factors a smaller percentage.

    In our example, if the company splits each $50 share into two $25 shares, the adjusted closing price from the day prior to the split is $25. The adjustment reveals the stock split, not a 50% decline in the share price.

    New Offerings

    For example, the company decided to offer extra shares to boost capital. This means the company issues new shares of stock in a rights offering. The right offering means that the shareholders have the chance to buy the new shares at lessened prices.

    But what happens when new shares come to the market? The price of the shares, of the same company, that are already on the market will drop. How is that possible? Well, think! The number of shares is increased and each of them now cost less. It’s almost the same with a stock split.

    The adjusted closing price values the new offerings and the devaluation of each individual stock.

    Find a stock return 

    A stock’s adjusted closing price provides you all the info you need to watch closely to your stock. You can use some other methods to calculate returns, but adjusted closing prices will spare you time. As we see in the text above, adjusted closing prices are already adjusted. The dividends are posted, the stock’s splits are done, the rights offerings also. So we can make a more realistic return calculation. The adjusted closing prices can be an excellent tool that can help us improve our strategies. Moreover, we can do that in a short time since the adjusted closing price already took into account almost all factors that directly impact the overall return. For example, just compare the adjusted price for a particular stock over some given period and you will find its return.

    It’s easy to find historical price data, just download it. Further, mark the column of dates and a matching column for adjusted closing prices and set up in descending order. For example, you want to examine a period from March to October. On the top, you should have data for March and below data for April and so. 

    Let’s find the return

    Firstly, compare the closing price in one month to the closing price from the prior month. To unveil the percentage of return you have to divide the chosen month’s price by the previous month’s price. Subtract the number 1 from that result, then this new result you have to multiply by 100 to turn it from decimal to percentage form.
    It should look like this:
    In March stock price was $50, in April it was $55, so the return was 10%

    ((55/50)-1)x100 = 10

    Since you have to do this calculation for each month add the column for return if you are working in a spreadsheet.

    To calculate the average return for the given period, from March to October, just sum each return for all months you observe and divide the result by the number of months.

    Simple as that.

    Bottom line

    The adjusted closing price is a stock’s closing price on any chosen trading day but altered to cover dividends posted and the company’s actions like split shares and the rights offerings that happened at any time former to the next day’s open.

    So, you can see that for serious analysis, the closing price will never reveal the real value of the stock, the stock’s value after considering any company’s actions. So it is always suggested to use the adjusted closing price if you want reliable analysis.


    You might also like:

    >>> Best Trading Strategy Without Indicators In Forex

    >>> How to Use Technical Indicators to Analyze Stocks?

    >>> MACD Indicator – Moving Average Convergence Divergence

    >>> Indicator Trading And How To Use It

    >>> P/E Ratio An Quick Method to Value a Stock

  • Is Coca Cola Overvalued – Trick Or Treat

    Is Coca Cola Overvalued – Trick Or Treat

    Is Coca Cola Overvalued
    Coca-Cola has performed very well in 2019. The stock isn’t cheap but also, not overvalued. The increasing margin and investors seeking yield couldn’t be a problem for the company to continue great performing. 

    The question Is Coca Cola overvalued could be a trick. Why do we think so? If we take a cash flow at a consideration we can see that Coca Cola is trading at 24.4 times operating cash flow and 31.3 times earnings. Further, the forward price-to-earnings ratio is at 24.6%. and the latest price is $54.69 (data from January 3th, source Yahoo Finance). Although, the company is not expensive. 

    Further, if you have in your mind that most government bonds are trading under 0% yield, the negative interest rate in the EU, currently inflation is low, KO that provides a 2.9% yield, you must understand that it isn’t expensive.

    Of course, it will be better if the stock can provide a higher yield but for that, we have to wait for additional dividend increases. On April 9, the stock traded at $55.77, the current price is at $54.69 but we all have to admit it isn’t a sharp decline in the stock price. Coca Cola management may reinvest the company’s operating cash in capital expenditures (CapEx) to get, improve, and keep the property, improve technology, or equipment. Further, the company can reinvest in development such as innovation to improve the product portfolio, marketing or M&A to maintain the business like it was in the past 20 years or more.

    Also, Coca Cola can use the operating cash to further improve profitability. That would influence its P/E ratio.
    Having all these indicators in mind it is easy to conclude that Coca Cola isn’t overvalued stock.

    It has a high debt

    Coca Cola has raised debt levels. The company has a slightly low liquidity position as the current ratio is at 0.92. The sustainable level should be 1.00 but the current debt levels are not something to be worried about. Boosted debt came from the fast increase of long-term debt and falling sales. But as we said, the company plans to improve sales and operating cash flow will likely grow. That could easily cover the debt. Moreover, the company’s bonds are doing very well. 

    Why do some investors think that Coca Cola is overvalued?

    Some investors avoided this stock due to its valuation. But try to be honest, it isn’t expensive. The company is paying a stable dividend yield and, according to its statements, it plans to have strong sales in the future. Coca Cola isn’t in the phase of low operating cash flow. Experts’ opinion is the stock hasn’t sell signal. It is contrary, with 31.3 earnings it has “hold” or even “buy” signal. Moreover, some estimations and predictions show that stock may hit over $60 (close to $65) this year. Well, Coca-Cola is a solid dividend-paying stock and it will likely continue to produce stable profit for its shareholders.

    The profitability of the company

    Let’s see is Coca Cola overvalued. Over the last four years, the company had a total revenue drop of $10 billion to $34.3 billion. Operating margin was improved by 560 points up to almost 29% and income dropped to about $10 billion which is a difference of just $400 million. The good sign is that the company increased cash by almost $10 billion from its operations while dividend payments hit a new record of $6.74 billion. 

    This year, Coca Cola has got back $3.4 billion through dividends and distributed stock worth $233 million. Yes, it is lower than for the same period last year due to several factors and the dividend increase of 3% may not be so visible. But the stock has had a great play in 2019 with a return of over 16%. So, what do you think, is Coca Cola overvalued? We think it isn’t. The company has a great product portfolio that could boost sales. So, KO could be one of the best investments in the next year since, as we can see, there is still a lot of potentials. Maybe the better question could be is Coca Cola undervalued rather that is Coca Cola overvalued stock. 

    Coca Cola through the history

    After 133 years of existing Coca Cola isn’t a woman-body-shaped-bottle. More about the company you can find in its fresh statements updated for Q3 earnings result for 2019. 

    The Coca-Cola Company is an American corporation established in 1892. It is primarily recognized as a producer of a sweetened carbonated beverage. It is a global brand not only the US trademark. The company is also focused on producing and sells soft and citrus drinks. Its product portfolio consists of more than 2,800 products available all over the world. That makes it one of the largest beverage producer and seller in the world and, also, one of the biggest corporations in the US. The company is headquartered in Atlanta, Georgia.

    Almost 55% of its sales come from carbonated soft drinks. The rest 45% goes to juice, dairy, tea, coffee, etc. The interesting part is that Coca Cola is a market leader in almost all of these areas selling its products through over 28 million customer stores.

    Speaking about its stock, Coca Cola could be everything but not overvalued. Moreover, it is a growing brand after 133 years. And the company still has great ambitions to meet consumers’ demands. Respect.

    And don’t be worried if this famous producer is able to meet them. Despite the increasing competition, the company has transformed into an asset-light company. It manages to improve supply chains and modernize its packagings, the concentration of sugar and modern tastes. 

    Don’t ask is Coca Cola overvalued. It isn’t.

    Bottom line

    Coca Cola is consumer staples stocks. It provides goods that people need on a daily basis. That fact makes it an excellent investment in practically every economic condition exceptionally winning during economic slowdowns. People will always need these products no matter what economic or financial status is or if there is inflation or market downturns. The whole industry’s total return in 2019 was 27.3%. Compare this data with the 12-year average annual return of 10.4% and you will understand why it is still a good investment choice. Yes, it is 3% points below the S&P 500. Nevertheless, if the market gets rough, and especially if we will face the market correction, this industry will shine.

    In the face of this context, Coca Cola is one of the best consumer staples stocks to buy in 2020. This pick should be proficient if the market is turbulence in 2020.

    So, KO could be a good addition to investors’ portfolios.

  • Vanguard Health Care Index Fund ETF Shares (VHT)

    Vanguard Health Care Index Fund ETF Shares (VHT)

    Vanguard Health Care Index Fund ETF
    Healthcare ETF is good for investors with less risk tolerance
    Vanguard Health Care Index Fund ETF is one of the largest in the stock market

    Vanguard Health Care Index Fund ETF is focused on stocks in the U.S. health care sector. It is managed by Vanguard and is covering health care stocks in the U.S. stock market. It is a big fund that holds shares of 388 companies. The Fund owns shares of Pfizer Inc, Merck & Co, AbbVie Inc., Johnson & Johnson, UnitedHealth Group Inc., and Abbott Labs. Its 10 top holdings account for almost 45% of the portfolio. But the fund has an extremely good diversified portfolio. It has holdings in pharmaceuticals, biotechnology, health care equipment, health care, supplies, facilities, services, technology, distributors, and life sciences tools and services.

    Healthcare stocks are hot

    Everyone needs health care and everywhere. But the main source comes from boomers. We have nothing against them, but the truth is that as people are aging, they need more health care. Correlated with this is the increased demand for medical products. But this isn’t the whole truth. 

    Also, there is great progress in new technologies that are likely to create great growth for companies in this industry. 

    For example, pharmaceuticals. You can see drugmakers that are developing new procedures, new methods, and drugs. Today we have personalized therapy, based on personal genetic data for each patient individually. This is especially important for cancer treatment, for example.

    Today, biotechs and pharmaceutical companies are practicing gene editing as the treatment for rare genetic diseases.

    The healthcare field is huge and connected. For instance, for early diagnosis of cancer, the liquid biopsy is very popular today and accurate. But someone had to develop it. The same is with AIs and robotics, medical device companies are developing new types of high-tech equipment. So many companies are involved to improve healthcare services. Look at the telehealth, it is adopted broadly. We have robots as surgeons. Monitoring patients with chronic diseases out of hospitals is easier than ever.  

    These products are not aimed at older populations only. Also, we have great progress in aesthetics, skincare, body care, hygiene, etc. 

    Can you see now why healthcare is a hot zone of interest for investors?

    Vanguard Health Care Index Fund ETF Shares 

    Vanguard discovered the ETFs. 

    It tracks the performance of the MSCI U.S. Investable Market Index (IMI)/Health Care 25/50.  

    This ETF has delivered an average annual return of 9.47% since it started in 2004. It has generated average annual returns of 9.78% over the last three years and 9.2% over the last five years.

    The Fund’s dividend yield is of 2,1%, the expense ratio 0.10% which is one of the lowest among ETFs.

    Vanguard Health Care Index Fund ETF

    Vanguard Health Care gives wide exposure. VHT stock is cheap to hold. Its liquidity is strong. The problem is the same as with other Vanguard funds. It is restricted transparency since the holdings are published monthly with 2 weeks delay.

    Still, for the long- term investors a reduction of transparency shouldn’t so much important. VHT fell by -0.13% on Thursday, December 5, but rose for 0,69% on Friday, December 6. The current price is $187.93, $1.29 more than the previous one. Daily fluctuation of stock was 0.79%, a day high was $188.50, a day low was $187.02.

    During the last 2 weeks, the stock price was shifting up and down but still, the 2-weeks gain was 2.78%.
    Since the volume has increased by 47 673 shares on falling prices, you should take this as an early sign of increasing risk in the next several days. Anyway, the price is dropping so it is time to buy it.

    According to analysts, the stock is in the upper line of a rising trend in the short term. This can be a very good selling chance for the short-term traders because the move towards the lower band of the trend can be expected.
    If the price breaks up the top trend line at $188.45 it is expected to increase by 11.09% in the next 3 months with a price between $195 and $210 at the end of this period.

    Bottom line

    Investing in a healthcare ETF decreases the risks for investors thanks to a diversified portfolio across various stocks.
    Moreover, ETFs can modify their holdings when it is necessary. Also, healthcare ETFs can resist during economic downturns because we will all need medical care no matter if it a crisis or not. But keep in mind, ETFs can drop during the crisis or recession too. They are not immune. But as the lesson from 2008, when some ETFs dropped by two-digit percentages, they had been rising again and did it fast.
    For trading stocks use our FREE Trading Exit Strategy, to calculate and optimize the numberless exit strategies, an app that you have for the first time in history.

    Featured image credit: *Total Shape*

  • Square Stock – Buy Before It Grows

    Square Stock – Buy Before It Grows

    Square Stock - Buy Before It Grows
    Square, the fintech company has the same chief executive as Twitter, Jack Dorsey. Does SQ stock have another big run in store for investors? 

    By Guy Avtalyon

    The Square stock had a big drop back in August and it isn’t recovered yet. And as always it happened, traders who panicked started to sell, that caused individual investors to sell too. Since the drop in August and also, after the Q2 announcement the Square stock price held steady.

    This was a rocky year for Square stock. At the beginning of this year, the price grew, but the last quarter was disappointing for investors. The Square stock fell 25% during the past 3 months. But as far as we know, it could be a great opportunity to buy them.
    That decision depends on personal estimation on whether the stock is a chance today or it is at the risk of further dropping.

    The quarterly result expected to be released in November could be very important. The expectations among investors are lower this time but Square is still under pressure to reach its corrected estimates. If the company show increasing earnings that would be helpful for stock to rise. Analysts are expecting $597.5 million in Q3 revenue. Could they be wrong?

    Square’s revenue in the second quarter was higher by 46%. The company was generating $1.17 billion in revenue. So, we can say that this company is making money. 

    Surprisingly low guidance is what pulled the Square stock price down in the last quarter. So, the Q3 report could be a nice surprise in a positive meaning. Well, you have to know that sometimes the companies depress expectations to provide a space for recovery.

    Why to by Square stock

    Square shares are currently traded at $58.36 (the closing price on Wednesday, October, 23) which is a depressed price. The coming earnings announcement easily could put the stock price higher. 

    So, what we know from the past is – buy low, sell high. Having this in mind, this is the right time to buy Square stocks.

    The field in which Square could happen future extension is in the cannabis industry. Square’s service is open for companies selling hemp-derived CBD products legalized under the Farm Bill. As we know the cannabis industry will grow more and more. So, that is a great potential for the company and investors too. 

    Only the U.S. market is worth as much as $6 billion by 2025.

    Also, there is the company’s Cash App. Over the past 3 months, they had a great increase in users and activities. So big that the company had sales growth of 44%. This phone Cash App is a great potential for getting more customers and gain more profit. 

    Someone may say that the stock is too expensive. Yes, $58.36 isn’t cheap but it is lower than previously. But this is a fast-growing high-tech company. Keep in mind that Square’s extension isn’t done. There is still a lot of potential for developing. For long-term investors, it is a good choice. At least, it is always better to buy now before its recovery and watch how it is growing in the future. Square stock ranks among the top 10 fintech companies. It’s not unusual for big winners like SQ stock to improve more than 50% after scoring a huge run

  • Stocks To Buy To The End Of The Year

    Stocks To Buy To The End Of The Year

    4 min read

    Stocks To Buy To The End Of The Year

    Would like to know where to invest in the second half of this year? What stocks to buy to the end of 2019? Yes, we know that the market circumstances are not so good. Uncertainty comes from trading war, this bull market has lasted almost eleven years and the matter of moment when the disturbing calculation will arise.

    What we, in Traders-Paradise, want is to offer you a closer insight into some stocks to buy to the end of this year.

    We have several suggestions about the stocks to buy to the end of 2019. We picked some that are paying a dividend, some utilities, but you will see. The main criteria were to find low-rates because these stocks are able to produce profits when rates climb.

    Dominion Energy (D)

    Yield: 4.7% 

    Revenues: $13.8 billion

    Market Cap: $62.1 billion 

    12-Month Range: $67.41-$79.47

    Why this company from Virginia, US? They have about 7,5 million clients, users of its electricity and natural gas. This company is one of the major producers and suppliers of energy in the US. 

    It has approximately $100 billion of assets.

    Its stock grows at approx 6% from the beginning of this year. Last year Dominion had cash dividend growth of 10% and it is up 10% this year. Domino reported first-quarter net operating income of $873 million which is less for 17,8% in comparison with last year. But, as we said billion times, everything may influence the revenue or stock price, in one word the market. This time it was unusually warm and sunny weather. That decreased this utility’s earnings by approximately $0.06 per share. But its stock is qualified at the 15%-20% rate. Don’t pay more than $85 for them.

    Citigroup (C)

    Stocks To Buy To The End Of The Year

    Yield: 2.8% 

    Revenues : $72.6 billion

    Market Cap: $161.2 billion 

    12-Month Range: $48.42-$75.24

    Some investors believe that this is the best time for the main banks. Citigroup is one of them but it is the sole bank that continues 30%  under its pre-financial crisis top market value. Its stock is much lower than the other three of the four main banks. The global big four are JPMorgan Chase, Bank of America, Wells Fargo, and Citigroup.

    Citigroup improved and develop good relations with its clients, increase client support by digital developing, and has enough capital to invest in the franchise.  It is very possible the share buybacks can double Earnings Per Share which is a guarantee that share price can be doubled too. That sounds good. Buy up to $75.

    Amazon (AMZN)

    Yield: 1,21% 

    Revenues : $59.7 billion 

    Market Cap: $977,589 billion 

    12-Month Range: $1812,97-$1985.63

    Amazon reported earnings for the first fiscal quarter of this year: the revenue $59.7 billion, net income $3.6 billion, and earnings per share  $7.09. Its international sales increased 9% to $16.2 billion. That was much over analysts expectations. Amazon revealed second-quarter revenue direction in the range of $59.5 billion and $63.5 billion. Its current price is $1985.63 in July this year.

    Amazon Web Services is growing 41% in sales to $7.7 billion. It is about 13% of its total revenue. There is a possibility to raise more. Pay up to $1990,00, after that price it will raise more, above $2,000,00, so you could make a good return.

    Vici Properties (VICI)

    Stocks To Buy To The End Of The Year

    Yield: 5.2% Revenues: $893.7 million

    Market Cap: $10.0 billion

    12-Month Range: $17.64-$23.27

    Vici Properties is a spinoff from Caesars Entertainment Operating Co. Vici controls 22 gaming businesses over the U.S. Also, Vici holds almost 15,000 hotel rooms in Las Vegas, Lake Tahoe, and Atlantic City and 4 golf fields. There is also some land but undeveloped for now. The last ownership is great potential.

    Leasing revenue for the first quarter of this year, was $206.7 million, a 6.4% increment related to first-quarter 2018. Net income increased 34% to $150.8 million. Last year it was $112.1 million.

    Its adjusted funds from operations increased 21.6% to $151.5 million from 2018. Current price is $21.60. The yield is well-covered and Traders-Paradise expects future dividend hikes. Buy up to $22,00. The predictions are that the price could easily hit $ 23.804 to the end of the year.

    Kraft Heinz Company (KHC)

    Yield: 5.2% 

    Revenues: $26.3 billion

    Market Cap: $38.5 billion 

    12-Month Range: $26.96-$64.99

    Kraft Heinz is one of the largest packaged food companies in the world.

    The cheese (Kraft) and ketchup (Heinz), bring this company to the portfolio of over 200 brands internationally sale. Revenues remain stable (if not growing), backed by still-popular brands and products. Its profit margins generate important cash flow. It had some problems in the US market, but foreign effects were better.

    The $0.40 per share quarterly dividend is covered and provides a 5,2% yield. In order to stimulate its debt paydown, Kraft Heinz Company could cut the yield.

    KHC’s stock price could provide significant gains. Current price is $31,63. The target price is $45. Buy up to $42.

    Bottom line

    The trade wars, real wars, elementary catastrophes, all around the globe.

    So, it isn’t so hard to recognize possible risks that could turn over the bullish trend. It is possible for the long-interest rates to go higher even they went down from the beginning of this year.  

    What you have to follow in order to choose stocks to buy to the end of this year?

    The indicator of industrial production.

    It is usually presented as an index in volume terms. The annual difference is shown in percentage and reveals the change in the volume of industrial output in comparison with the prior year.

    Why is this matter?

    Annual variation in industrial production presents the status of the economy in one country. If you notice the decreasing in production of consumer durables and capital goods you can be sure that the economic downturn is here.

    The indicator of industrial production is a principal symbol of GDP growth. It is incredibly sensitive to consumer demand and interest rates.

  • The stock market trading for beginners – It Shouldn’t Fright You

    The stock market trading for beginners – It Shouldn’t Fright You

    stock market trading for beginnersIf you’re afraid to start trading stocks, here are some sure ways on how to do that

    By Guy Avtalyon

    The stock market trading for beginners can appear somewhat terrifying. Trust me, I know that.

    Before you begin to trade stocks you need to know the costs. Invest the money you can cover if failed. The tricky part of the stock markets is that you can’t expect any guarantee you will get big returns.

    But there is a big advantage when trading stocks. It gives you an opportunity to preserve your savings in circumstances of rising inflation. If you work smart and catch the experienced traders’ performances, you may have the chance to hit big returns.

    How to start trading stocks?

    As first, you have to pick a broker. That broker must be licensed and regulated. This matter is crucial for all stock market trading beginners.

    The chosen broker will provide you access to its trading platform. For instance, you would like to join the stock market.  You have to know better what are you dealing with. If you want to become friendly with the platform you prefer, the general advice is: begin with small sums of money.

    You are a fresh participant in the arena of online stock market trading.

    You have to read the financial news. That is helpful when it comes to which stock to buy. News is very important for stock market trading for beginners. Also, you can participate in a number of forums. There you can find some advice.

    Truly, you can get a lot of helpful free data in public places for stock market trading for beginners. And study a business you prefer before you stock market trading.

    The reasons to start the stock market trading

    Say, you got some stock. And the time goes by as always. Assume that after several months the price of the stock goes up. So, you may trade your stock, sell them, and earn a profit. Of course, you can wait longer. If you were smart enough and done well research you picked a worthy company and your stock will rise more.

    The stock market trading for beginners is full of chances. But here we come to the importance of news. The value of your stock depends on a large variety of circumstances. As you are a beginner in the stock market trading, you have to know that socioeconomic impacts, geopolitical topics, inflation, and so many others may have an influence on the value of your stock.

    You have to know that all the time, all of them, are acting cooperatively. Sometimes they are operating in reverse courses, but they are working. And all of them may have influenced the price of the stock. That is necessary to know for stock market trading for beginners.

    But possibly the highest influence on stock prices create the people. If there is a crowd that assumes the price is going up, the price will go up. It will take some time to learn how to trade stock but it worth your effort.

    Stock trading strategies for beginners

    When you start a stock trading and you are beginners one central question appears. Which trading strategies for beginners to implement?

    This question isn’t without purpose.

    Some stock trading strategies are very complicated. You should not implement those as the best stock trading strategies for beginners. As a beginner, you should rise with simple strategies. With something smooth and comfortable. This rule fits every novice. It is very important to understand how markets work, so it is highly recommended to follow the trends.

    Following the trend is an excellent strategy for stock trading for beginners. Just set it and open the position in the course of the trends. There are various ways created to identify when a trend begins and finishes. An easy stock trading strategy for beginners has simple rules. Follow trends and you can gain large profits.  But there are also some disadvantages. Actually, large trends develop rarely.

    This strategy can generate losing trades. “The trend is your friend, UNTIL THE END,” said some very smart and experienced once. The end is when the trend sinks.

    It is very important for stock trading strategies for beginners to be executed with risk management. Find more about stock trading and investing in stocks with a little money HERE

    Don’t waste your money!

  • Top Stocks to Buy And Hold Forever

    Top Stocks to Buy And Hold Forever

    4 min read

    Top Stocks to buy 2019 and Hold Forever
    So many people asked us what are the top stocks to buy in 2019.

    It is on a daily base.

    So, we will try to answer. This to all of you want to know and don’t have time to evaluate them.
    We don’t want your one-time appearance here, we would like to build a real relationship and confidence.

    This the article for you who want to enter the stock market this year.

    Well, you know, Warren Buffett’s personal holding season is “forever” and look how is he.

    Having that on our minds, here’s a summary of 5 stocks to buy and hold forever.

    We understand, investing is difficult. Developing a portfolio of top stocks to buy is tricky even for economic experts.

    There are still stocks to buy, don’t be worried. Moreover, they can give you really nice returns.

    • Johnson & Johnson (JNJ)

    Top Stocks to buy 2019 and Hold Forever 1Image Johnson & Johnson (JNJ) chart: source Yahoo Finance

    Everyone needs their products. They will forever have something to sell,  to us or the rest of the world. So why we, while buying their product, wouldn’t have an income?

    List of Johnson & Johnson brands is so long.

    J&J is a company with a long history.  All can identify their best brands. For example, Johnson’s Baby Shampoo or Baby Powder.

    It is founded the 1800s in New Jersey and since then Johnson & Johnson has extended its brands. Today,  you can find Johnson & Johnson brands all over the world. From your bathrooms to your doctor cabinet.

    The medicines, surgical products or healthcare solutions will never disappear. J&J has a really big portfolio.

    No one should think even a second when it comes to investing in such a company. They have products, for example, cancer drugs that will produce good growth now and in the future.

    The company is investing the robotic surgical opportunities gravely, in February announced that it’s buying robotic surgery firm Auris Health for $3.4 billion.

    J&J annual yield on the dividend is 2.60% and has an 8.46% gain per year.

    It is really among top stocks.

    • Boeing Company (BA)

    Top Stocks to buy 2019 and Hold Forever 2

    Image Boeing company chart: source Yahoo Finance

    This company had hard March this year. After the fatal crash of Ethiopian Airlines, its shares fell down.

    The company took the problems with their jet seriously and experts are working on new software.

    On the beginning of the March this year their shares were worth $446, but now they are about $400. The stock could jump when their 737 Max types are on the sky again.

    It is a very steady company. Their F-15 fighters are extremely valued.

    Boeing arranged a selling of those fighters with US Air Force over the next 5 years for $8 billion.

    The company raises the quarterly dividend yield for 2.6%.

    Boeing announced a quarterly dividend of $2.055 per share which is $8.22 per year. This is a 20.2% rise from the previous dividend of $1.71.

    The annual yield on the dividend is 2.6%.

    • Colgate-Palmolive (CL)

    Top Stocks to buy 2019 and Hold Forever 3

    Image Colgate-Palmolive chart: source Yahoo Finance

    Why do we add Colgate here while everyone knows that this company recorded some suspicious inclinations in spending? Yes, we know that shareholders didn’t like that. That’s is changed as the company decided to make an important decrease in the costs. The advantages of that effort could last decades.

    Their brands are among most buying products. For example, their toothpaste, or soap (of course Palmolive soaps), and manual toothbrush, and other pharmaceutical products for dentists.

    The company is selling its products in more than 200 countries. Colgate-Palmolive includes two product sections:

    ersonal, oral, and home care is one; and the second is pet nutrition.

    It is a leader in the global oral care market.

    Also, it is a leader in pet nutrition products for dogs and cats.

    They’re all made by Colgate-Palmolive Company.

    The company declared a dividend yield on 2.50% and the year-to-date gain of 16%.

    Well, some can say Colgate is high-risk stock but with the big potential returns.

    • Alphabet (GOOGL, GOOG)

    Google

    Image Alphabet Inc. chart: source Yahoo Finance

    Alphabet Inc declared $12.77 per share for the last quartal.

    It looks that Alphabet is the revenue growth provider. Revenue grew 21.5% to $39.28 billion in the fourth quartal.

    It is for sure one of the stocks which you have to buy and hold forever.

    This tech titan is Google parent company.

    Alphabet Class A and C shares have grown 15.5% and 15.4%, over the one-year period April 18. The S&P 500, including dividends, is up 9.4% over the same time frame.

    Yes, the quarter’s reported earnings will be negatively influenced by a 1.5 billion euro (about $1.7 billion) penalty required by the European Commission in March.

    The European Commission claimed that Google demonstrated anticompetitive methods linked to deals it had with Adsense for Search associates.

    Well, the company is prepared to appeal, so investors may be sure that the penalty will be lower.

    Google’s revenue grew quick.

    The cost of sales would increase in the fourth quarter, forced by higher sales and projected content purchase costs at YouTube.

    There are also, Fiber high-speed internet industry, and its Verily life science.

    We all can see the changes because Alphabet’s self-driving vehicle tech branch Waymo recently start being monetized.

    • The Walt Disney Company (DIS)

    Disney

    Image The Walt Disney Company (DIS) chart: source Yahoo Finance

    Disney is the globe’s greatest media. They have movie studios, television networks.

    Assets controlled by Disney add Disney Animation Studios, Pixar, Marvel, Star Wars, the ABC network, the Disney Channel.

    Disney is close to finalizing an arrangement to take 21st Century Fox. That will combine the 20th Century Fox film studio, National Geographic, and a mixture of other media assets. But not the Fox News.

    Disney has Disney Plus streaming service.

    In the first half of April,  it revealed the price, shows, and movies. Everything planned to overcome Netflix as a rival.

    In 2018, Disney launched ESPN+, their streaming service, and in the time frame of five months had more than a million subscribers.

    And don’t forget, Disney owns Hulu. Disney plans for its three platforms to be separate subscriptions, but it’s likely to connect them at a discount.

    In the moment of writing this article, we are two days out from the release of Avengers: Endgame.

    Predictions about how much money it will bring to Disney are fantastic.

    THR – the range of $200-$250 million.

    Deadline – passing $260 million, and maybe $300 million marks. ComicBook.com – prediction gathered from 3 analytics, $300 million.

    Impressive.

    Disney’s stock has jumped 13.6% in just five trading days in April. They will not look back now. Disney is a market sweetheart.

    Not bad for an old player.

    It is a good investment and one of the top stocks for sure.

    Don’t waste your money!

     risk disclosure


  • Trade Crypto And Stocks / Forex – How To Do That

    Trade Crypto And Stocks / Forex – How To Do That

    4 min read

    Trade Crypto And Stocks / Forex - How To Do That

    • If you understand how the financial markets are structured you can use the same skill and experience to profit in all three.

    At first, we have to define the difference between crypto and Forex/Stock trading because you have to have theoretical knowledge.

    Crypto trading, or cryptocurrency trading, is simply the exchange of cryptocurrencies. Like in Forex, you can also buy and sell a cryptocurrency for another, like Bitcoin or altcoin for USD and Euro.

    The foreign exchange market (Forex, FX, or currency market) is a global decentralized or over-the-counter (OTC) market for the trading of currencies. This includes all aspects of buying, selling and exchanging currencies at current or determined prices.

    Stocks trading is the buying and selling of company stock – or derivative products based on company stock – in the hope of making a profit.

    Let’s go further!

    HOW TO TRADE CRYPTO

    Crypto shows bigger growth than stocks or forex. Honestly, all of these types of investment are risky.

    While Bitcoin is not the only digital currency on the market, it is indeed the first and most popular one and stands as the digital gold within the industry. The technology behind cryptocurrency holds a large part of its value. The secure way to identify a transaction and the way to transfer funds.

    If you want to trade cryptocurrency you need:
    1) A cryptocurrency wallet (or two).
    2) A cryptocurrency exchange (or two) to trade on.

    There are only a few things to know about trading cryptocurrency.

    Trading cryptocurrency is simple to start. Yeah, it’s easy

    But there are some essential aspects to understand before you start trading. And this is basic friendly advice to mull over. This not professional investment advice.

    Bitcoin mining, is it profitable

    I’ll explain on the example of Bitcoin.

    There are three ways you can trade Bitcoin:

    1 Buy the underlying from an exchange or online cryptocurrency broker

    For those who are willing to actively safeguard their Bitcoin, owning the underlying is clearly the way to go.

    But prudent steps must be taken to mitigate the risk of Bitcoin theft or loss of private keys.

    Diversifying holdings across wallet types, using two-factor authentication and strong passphrases, can be helpful.

    Trade (buy/sell) a CFD (Contract for Difference) derivative and hold cash margin with an online forex broker or multi-asset broker.

    Active traders looking to speculate on Bitcoin over the short or medium term can count that using an online forex broker will provide them with 24-hour trading. And potentially lower margin, and the ability to go either long or short.

    So, it is good!

    Because of counterparty risk, choosing a broker is just as important as finding one with the best trading tools or commission rates.

    Buy a publicly listed security related to Bitcoin and hold shares with an online stockbroker.

    For stock market investors, investing in Bitcoin indirectly through a listed security such as an ETF, ETP, or trust may be suitable for those looking at taking a passive position.

    Active traders might find the limited trading hours and potential lack of volume a limiting factor that could hinder their trading.

    Overall, using listed securities that invest, track, or hold Bitcoin can be a viable alternative to diversify away from the risks of margin trading. Or safeguarding private keys when buying the underlying.

    HOW TO TRADE FOREX

    Forex, also known as foreign exchange, FX or currency trading, is a decentralized global market where all the world’s currencies trade.

    You can trade currency based on what you think its value is. Like, for instance, you think a currency will increase in value, you can buy it. But, if you think it will decrease, you can sell it

    Trade Crypto And Stocks / Forex - How To Do That 2
    All forex trades involve two currencies because you’re betting on the value of a currency against another. Think of EUR/USD, the most-traded currency pair in the world.

    EUR, the first currency in the pair, is the base, and USD, the second, is the counter.

    When you see a price quoted on your platform, that price is how much one euro is worth in US dollars. You always see two prices because one is the buy price and one is the sell.

    The difference between the two is the spread. When you click to buy or sell, you are buying or selling the first currency in the pair.

    Since the euro is first, and you think it will go up, you buy EUR/USD. If you think the euro will drop in value against the US dollar, you sell EUR/USD.

    If prices are quoted to the hundredths of cents, how can you see any return on your investment when you trade forex? Leverage!

    When you trade forex you’re borrowing the first currency in the pair to buy or sell the second currency.

    To trade with leverage, you simply set aside the required margin for your trade size. If you’re trading 200:1 leverage, for example, you can trade $2,000 in the market while only setting aside $10 in the margin in your trading account.

    However, leverage doesn’t just increase your profit potential. It can also increase your losses. If you are new to forex, you should always start trading with lower leverage ratios, until you feel comfortable in the market.

    HOW TO TRADE STOCKS

    Stock markets are places where buyers and sellers of shares meet and decide on a price to trade.

    It is important to know that the corporations listed on stock markets do not buy and sell their own shares on a regular basis. When you buy a share of stock on the stock market, you are not buying it from the company, you are buying it from some other existing shareholder.

    There are many stock exchanges, many of which are linked together electronically which means markets are more efficient.

    The prices of shares on a stock market can be set in a number of ways, but most the most common way is through an auction process where buyers and sellers place bids and offer to buy or sell.

    A bid is a price at which somebody wishes to buy, and an offer (or ask) is the price at which somebody wishes to sell. When the bid and ask coincide, a trade is made.

    If there are many buyers and sellers at sequentially higher and lower prices, the market is said to have good depth.

    Stocks are quoted by their ticker symbol, represented by between one and four capital letters. They are often loosely representative of the company name.

    Let’s break down what is the market order!

    A market order is simply an order that instructs the broker to buy or sell shares at the best available price. The market order does not guarantee the price you will get. But it does guarantee that you will get the number of shares that you want.

    When an order is completed, it is said to be filled.

    Stop orders are contingent on a certain price level being attained to activate the trade and your trade will be executed only when what you want to buy or sell reaches a particular price.

    If you understand how the financial markets are structured you can use the same skill and experience to profit in all three.

    In all three you have to buy low and sell high against the crowd.

    There is no difference.

    Risk Disclosure (read carefully!)