Tag: investing

All investing related articles are found here. Educative, informative and written clearly.

  • Crocs Clogs Of Two Digits

    Crocs Clogs Of Two Digits

    Crocs Clogs Of Two Digits
    Crocs have sold more than 300 million pairs of shoes in more than 90 countries.
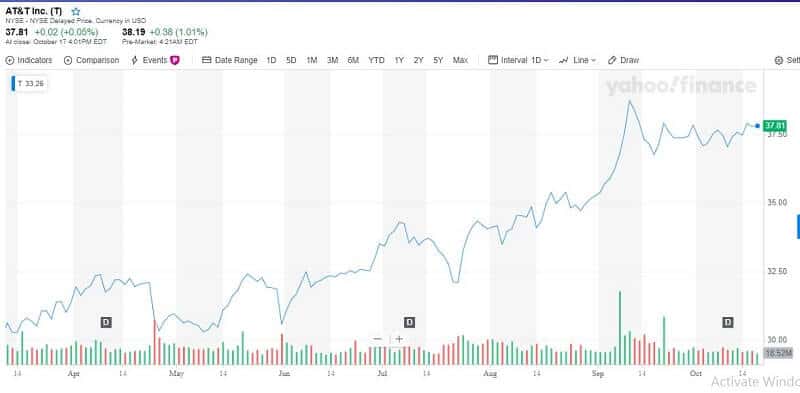
    Crocs is traded on the NASDAQ stock market under the ticker symbol CROX. Market Cap:  $2.44 B Current Price: $35.51

    Crocs reported Q3 on October, 30. The company reported revenues of $313 million, which represents the new third-quarter record for Crocs or an increase of 20% – 21%. It also reported reducing revenues due to currencies of $3.0 million and reduced revenues of $4.0 million due to closing stores. But the wholesale revenues increased by 25.4%, e-commerce sales rose 28.2%, and retail comparable store sales increased by 12.5%. Gross margin was 52.4%, in the same period last year it was 53.3%. Adjusted gross margin increased 30 basis points compared to last year’s third quarter. 

    Crocs had, according to the Q3 report, adjusted earnings per share of 57 cents. The experts’ estimation was 40 cents. The company’s shares were up more than 10% to nearly $37 after reporting. The current price is $35.51. CEO Andrew Rees said, “Our Americas business delivered exceptional growth, driven in part by another highly successful back-to-school season.”
    The great results produced a tendency for Crocs to boost its full-year guidance to 11%–12% revenue growth over 2018.


    “The Crocs brand momentum continues to gain pace, and for 2020 we anticipate revenue growth over 2019 of 12% to 14%,” said Rees.

    Crocs have closed more than 150 stores over the past several years. The competition was very strong. It has also focused its works on its Classic clog, profiting from the shift toward more casual and comfortable footwear. 

    Is Crocs a good investment?

    The investors should be enthusiastic about the Crocs (NASDAQ: CROX).
    Crocs is in the center of a strong increasing trend in the short term. The stock is assumed to increase 54.16% in the next 3 months and, so the price to climb between $52.32 and $62.85, expect experts. Moreover, they are seeing only positive signals for this company and strong buy signals from the short and long-term moving averages.
    A general buy signal is supported by the relationship of those two, the short-term average is above the long-term average.

    Where the problem may arise?

    The support level is between $35.42 and $32.45. If the price falls under these levels it will be a sell signal. For now, it is a strong buy signal and an indication of additional gains. The consideration may occur because the volume fell on November, 12 notwithstanding growing prices. This shows a divergence between volume and price and it may be an unexpected warning. 

    But some experts see a great potential of holding this stock in the long run. Their estimations show a possible fantastic 152% profit in 18 months. The investment analysts think the Crocs stock is good to buy. 

    Important info about Crocs

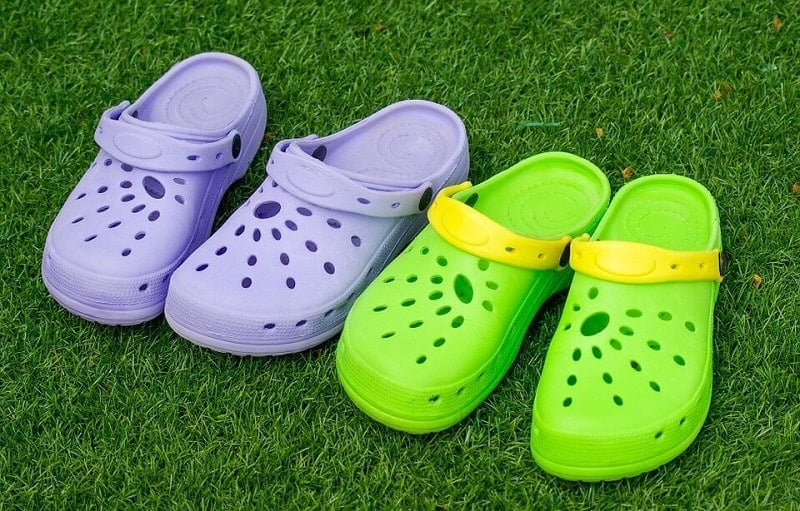
    Crocs, Inc. is a worldwide recognized as a leading producer of casual footwear with a broad portfolio of all-season colorful pairs of shoes. Crocs were first exposed at the 2002 Fort Lauderdale Boat Show.

    Famous clogs were originally developed as boat shoes produced by a Canadian Company, Foam Creations, Inc. The new shoes were molded into the shape of a human foot. Just a few years later they have become practical footwear in households and professions. The ugly trend overflowed the world. You cannot love Crocs because of its aesthetics. These ugly clogs made a trap for the brand. The producer claimed that only one pair will last a lifetime. The fashion industry surviving thanks to many and frequent shifts and this kind of thinking was so far from the industry. But that has never slowed Crocs down. The slippers wipe-clean and non-slip build sent them straight to kitchens, hospitals, everywhere the workers have to stay on their feet for a long time. 

    It went public in 2006

    The company had already adopted Crocs, Inc. In its presentation to investors, the company announced plans that requested for new footwear models, developed distribution in the US and over the world. 

    As investors’ interest in Crocs expanded, the company was able to increase its asking price and the number of shares on the market. Firstly, the plan was to sell 9.9 million shares at $13 to $15 per share. Crocs managed to add a bit more than a million shares and hit its asking price to the $19 to $20 range. Investors liked the company since the Crocs had extraordinary growth and a product that had a global appeal.

    Today nothing has changed. Crocs is one of the most popular producers of slippers. But that isn’t the only product they have: clogs, boots, other kinds of footwear, but with a common characteristic: comfortable, long-last, colorful and funny.
    The stock should be watched closely, it can produce a great profit.


  • How to Find Big Opportunities in Investing

    How to Find Big Opportunities in Investing

    How to Find Big Opportunities in Investing

    Everyone would like to know how to find big opportunities in investing. That’s the point, right? One of the best ways is to notify where traders are overreacting to the news.

    By Guy Avtalyon

    To find big opportunities in investing, other traders’ extreme fears will help you. For example, traders reacted to news that brokers were cutting their fees. But did you notice a massive rise in their stock price? During the past few weeks, online brokerage stock took hits.

    Let’s go step by step. When Charles Schwab announced it would cut all commissions for all trading, E-Trade, Interactive Brokers and TD Ameritrade fell. This news sent brokerage stocks lower because the traders overreacted.

    In that period, for example, TD Ameritrade (AMTD) dropped from $48 to $33. The other brokerages experienced a decline in stock price too. Interactive Brokers (IBKR) fell from nearly $54 to almost $45, Charles Schwab Corp. (SCHW) dropped from $43 to $35, etc.

    The traders responded to news that brokers are cutting their fees. They had fears about brokerage future without that income and started to sell. But the point is to overcome the fears and recognize the opportunity. When you recognize the bottom in some stocks you actually can see great returns. And let’s take a look at our example again.

    What happened with these stocks a bit more after?

    Charles Schwab moved from $35 to $42, TD Ameritrade moved from $33 to $39, Interactive Brokers stock rose from $45 to $48, etc. How did this happen? There are no tricks. When some stock becomes oversold and gets stretched in one direction too quickly, too far, you will notice bounce back. That is exactly the time when you have to buy the stock. So, you are profiting while others are feeling fears. 

    It is simple to recognize when the stock dropped on extreme fears. How to find those big opportunities in investing?

    Key technical pivot points 

    Bollinger Bands

    Let’s say you noticed that traders picked a moving average of 20 with two regular deviations up and under that average. When a stock reaches or enters the lower zone, you can be sure the stock is oversold.

    RSI and W%R

    Use RSI to confirm the indicators that are higher. The oversold condition will appear when RSI goes to or below its 30-line, also when W%R (Williams’ %R) comes to or up the -80-line the stock is considered to be oversold.

    MACD

    Moving Average Convergence-Divergence is helpful and simple. It helps to confirm the info we get from previously mentioned indicators. MACD is calculated by subtracting the 26-period EMA from the 12-period EMA (Exponential Moving Average). 

    How to identify investment opportunities?

    You will need a bit of magic to find big opportunities in investing.

    These four indicators must be matched with one another if you want this to work. They have to be aligned. And moreover, you don’t want to rely on one indicator. You must have all four.
    So, what we had with brokerages in October this year? Just to be said, we can use other examples, but this is fresh. We saw the stock dropped due to the fees-pricing fight. Though, we saw the precise time of extreme fear and, at the same time opportunity.

    When you see the stock dropped to its lower Bollinger Band, it is a sign that the stock is oversold. Use historical data for that stock and you will find that whenever the lower Bollinger Band is reached or entered the stock turned and bounced back higher from that point.

    Use RSI to find big opportunities in investing

    But you have to check RSI also. Find the confirmation on what Bollinger tells you. If the RSI is a below-set line the stock is oversold. That the confirmation of Bollinger Band’s story. Check this info in historical data to have a sense of how the stock was performing in case it had lower RSI and if the stock moved to its lower Band.
    If you see the stock bounced back higher quickly that is the confirmation and you should buy. 

    And as we mentioned before MACD and Williams’ %R have to confirm the described condition to be sure you can trade with 85% of success.

    Examples of how to find big opportunities in investing

    The list is really endless. Big investments may come fro different fields, different companies. For example, some small but developing company can be a better choice than a famous brand.
    In case you don’t believe this, let’s see what stats tell us. Small companies are the spine of any national economy. That’s the fact. Small companies employ many people, actually the majority. So, it is easy to conclude that the can be a big opportunity to invest in.
    Just keep in mind before you invest in one of them to examine its potential for growth, financial strength. When you go through this process try to find out how passionate management is about business, sometimes that will tell how serious they are about future growth and the company’s future. Especially if you want to invest in some startup.

    Big opportunities in investing can be detected in up to 85% of cases.
    Put all these indicators together with extreme traders’ fears based on news, and you will see how to find big opportunities in investing.

  • Fiat Chrysler and Peugeot Merger

    Fiat Chrysler and Peugeot Merger

    Fiat Chrysler and Peugeot Merger

    Fiat Chrysler Automobiles will merge with PSA Groupe, owner of Peugeot automobiles

    Fiat Chrysler (FCA) and Groupe PSA (Peugeot is the largest PSA brand), have agreed to continue a merger. That would form the fourth-largest carmaker in the world. Their boards are working together on a new relationship. The Wall Street Journal reported the companies are moving forward with a merger. Both companies confirmed this news.

    The merger will give shareholders of each group equal ownership in the new entity.

    On Thursday morning both companies stated that their boards have a mandate to finalize the negotiations in the next few weeks, which means FCA will not tie-up with Renault as was thought this summer.

    The merger would create a company with revenues of €170bn, with an operating profit of over €11bn and vehicle sales of 8.7m. That would lead them ahead of General Motors and Hyundai-Kia in sales. The new potential entity would have a market value of between €45-50bn.

    The model of the merger is a 50-50 all-stock.

    PSA is listed on the Euronext Paris stock exchange.

     Fiat Chrysler and Peugeot Merger

    Since 2014, FCA is officially listed on the NYSE.


    After the Fiat Chrysler and Peugeot Merger 

    When the two companies do a merger, PSA chief executive Carlos Tavares is assumed to lead that new group while John Elkann, Fiat Chrysler’s chairman will hold the same position at the new entity.
    Despite this speed, a final agreement of merger needs time and regulatory scrutiny.

    According to Reuters, a merger between FCA and PSA could build a “$50-billion giant better placed to tackle a host of costly technological and regulatory challenges facing the global auto industry.” Details were not published, but some aspects have known.

    For example, the Journal published that the new company would be “legally domiciled in the Netherlands,” with “operational headquarters in the U.S., France, and Italy.”
    Further details and any influence on employment are not yet transparent. The known fact is that FCA has plans to add nearly 5,000 jobs to the Detroit factory to build SUVs. So, the obvious conclusion is that a merger would eventually help FCA in Detroit.

    It isn’t a secret that the Peugeot Group has plans to re-enter the U.S. market. The merger with FCA would provide it through the Chrysler/Dodge/Jeep/Ram dealer network.
    To adjust the value of the two companies, the PSA shareholders should get about a €3bn dividend from the sale of the 46% stake in parts carmaker Faurecia.
    FCA shareholders will receive a €5.5bn ($6.12 billion) cash payout and incomes from the sale of its robot-making Comau unit, estimated at between €200m to €300m.

    New headquarters

    The new group will be based in the Netherlands, a neutral location, where FCA is domiciled and listed in Paris, Milan and New York. The Financial Times reported the FCA will “continue to maintain a significant presence in the current operating head-office locations in France, Italy and the US.”

    Around €3.7bn in predicted annual run-rate synergies are targeted, 80% during the first 4 years. The total one-time cost of achieving the synergies is estimated at €2.8bn, the two companies revealed in the statement.

    Bottom line

    Carmakers are facing large investments in electric cars. That is the reason behind the merge. Costs. This merger would create one of the biggest carmakers groups in the world with well-known brands Citroen, Jeep, Opel, Alfa Romeo, Peugeot, and Vauxhall. This has the potential to be a true rival to Volkswagen, Toyota and the Renault-Nissan Alliance.

    The merger of those two companies looks as wise given the global competition, capital power, and industry complexity from autonomous technologies.

    This could create a global automotive leader.

  • Real Return On Investment

    Real Return On Investment

    Return On Investment

    Return on Investment or ROI, measures the profitability of an investment, for every amount you put in, what profit can you expect.

    Return on investment is a measure practiced to estimate the efficiency of your investment. Also, you can use it to compare the efficiency of different investments. ROI seeks to measure the volume of return on investment in comparison to the costs. So, to calculate ROI, you have to divide the return of your investment by the cost. The result will be displayed in a percentage or a ratio.

    How to Calculate Return On Investment

    ROI formula is:

    ROI = (Current value of investment – the cost of investment)/cost of investment

    Compounding interest sounds like alchemy for many new investors, but ROI is true magic. Particularly when your money rises each year.
    Let’s say you invest $2,000 at 5% interest. You’ll have $3,500 in interest after 15 years. Your initial capital would be grown by $1,500 of interest. But if you invest at a 5% annual compound interest, you will have about $4,158.

    But where is the magic?
    The magic comes now. What if you can earn a higher rate of return?

    What if you invest at 8% or 10%? This can be really important because it is your money and you would like to watch it grow.

    True magic lies in math.

    Let’s say you have an investment goal and also, you know how long you want to hold your investment. For example, you would like to sell some of your stocks after 2 years. Assume you invested $2,000 in the stock. And you did that. You sold your stock for, let’s say, $3,000. Great! You made $1,000 in profit. That is 50% of return which is amazing if you want to calculate it quick and dirty,  and incorrectly. But, you need to factor in your liabilities and annual inflation rate to calculate the real return on investment. Okay, you have to pay a capital gain taxes, for example, it is $150, so you ended at $2,850 which is still good. Yes, your return will not be 50% it is 42.5% after you pay capital gain taxes. Oh, wait! Where is the inflation? Yes, you have to calculate the inflation over those two years. Let’s say the inflation rate is 2.5%.

    $2,850/(1.025×1.025) = $2,713

    Your real value return will be 35.65%.  It is less than 50% of return what you may be expected but it’s still good.
    It was a bit complicated but correct, which is the most important. And it is for two years. Do your own math for longer periods.

    Several things you have to keep in mind.

    A good return on stocks has to surpass inflation, taxes, and fees. Only in that way, you’ll be able to build your wealth.
    Use ROI to compare investments even if they’re not related. It isn’t the same if you are buying blue-chip stock or small-cap. In short, everything is different. But, if you compare only ROI may provide you a clear insight into where you want to direct.

    ROI can be used in combination with the rate of return, which takes into account the time frame, which we did. You can use a net present value or NPV, which we did to calculate the real rate of return.
    The usual return on investment for the majority of investors is about 2-3%. It isn’t great. But if you keep your money in a bank account you will have a negative return, after you factor and pay all taxes and inflation. 

    A  good return on investment is 10-12% per year

    You can beat the market. That is everyone’s goal, right?
    But if you expect to earn 15% or 20% – it’s not going to happen. Or it will happen very rare. Don’t believe in false promises, they are counting on your lack of experience. If you build your financial security on bad premises you will end in a risky field. You may lose all your capital. If you have a more conservative approach to investments you will have a less stressful experience. Investing should give you certainty.

    Bottom line

    ROI is a popular measure due to its simplicity and versatility. Typically, use ROI as a simple measure of your investment’s profitability. Use the ROI on a stock investment. The calculation isn’t difficult. It is easy to understand. If your investment’s ROI is net positive, it is good. Avoid negative ROI, it is a signal of a net loss.

  • When to Sell Option Call?

    When to Sell Option Call?

    If the trade is going in your favor or for the trade that is going against you – don’t wait until expiration to see what happens. Sell before.

    Fresh traders, particularly those with a little amount on the account, like to buy options. But do they understand all the rules? The vast of them somehow skip selling prior to the expiration date. The truth is that the call option could be sold at any time. Call options give you the right to buy some assets, you already know that. To know when to sell the option call, pay attention to several situations.

    Let’s say you own calls and you decide to let them expire worthlessly. That’s okay. Your decision. But if you forgot and the stock closes on the expiration date the options will automatically be exercised whenever it is “in-the-money” when the market closes.

    And it will be a problem when the next day comes. The next day, the day after the expiration date, the margin call will come. Where is the problem? When you buy an option call, you are buying the right to buy a stock. Did you know that? If you are new in the options trading it is likely you didn’t. And what happens? When margin call comes you have to pay for shares and you’ll be forced to sell your call options. So, it is better for you to sell your options calls before the expiration date.

    So, you have to close your trade before the expiration date.

    When you opened your position your aim was to make a profit, right? So, don’t wait for options to get too close to the expiration date because they will lose the value. As the expiry date is closer, the value is going down. To make a profit it is better to sell your options and close the trade. Of course, you may take a loss too but if you wait longer and as you are approaching the expiration date, the chances to avoid loss are almost zero.

    Avoid margin call

    Lett’s say you bought one call option. How to know when to sell option call? Don’t forget that one option controls 100 shares of stock. And let’s say the strike price is $30. If the stock closes at $30,03 your options will be automatically exercised and you’ll be the owner of 100 shares of stock. Further, your broker will send you a margin call if you don’t have a sufficient amount on your account to pay that stock. And what you have to do? You will be forced to sell the stock to close out your trade. More often, you will sell it below the exercise price. But it isn’t necessary to be your case. You can avoid this unpleasant situation. Just close out your open position before the expiration day. Before the market closes, of course.

    For a strike price, you can calculate the cost to buy a call option and the cost to use it. You can find plenty of websites with options quotes. All you have to do is to type a stock’s ticker symbol and get a quote. You will see a column with months arranged and with the options expiring that particular month. Remember, you can trade the option until the third Friday of the expiration month.

    Calculate options for a strike price

    Find your wanted strike price in the “strike” column. Strike prices are ordered from cheaper than the stock price to higher than the stock price. Suppose the stock’s price is $50 and the strike prices ranging from $20 to $70 in a $2 increase. And you want to calculate an option with a $60 strike price. And suppose you want to buy a call option with a $2 “ask” price.

    To calculate the whole price to buy one option contract you have to multiply the ask price by 100. In our example, it is $2 x 100 which is $200. No, it doesn’t amount to buying the stock, this amount of money you have to pay for the right to buy the stock

    Let’s go further. The next thing to do is to multiply the strike price by 100. That is an added amount you have to pay to use the option.

    $60 x 100 = $6,000

    This means you can buy 100 shares of stock for $6,000 before the expiration date.

    Use volatility forecast

    In general, volatility is extremely important when buying or selling options. Since “returning towards the mean” is especially noticeable on volatility, you can somehow easily forecast the volatility as it goes above a certain point or less than a certain point – it will, most likely, return towards the average volatility.

    You can check the VIX to measure market volatility. Learn here how to do it.

    Bottom line

    Don’t buy call options with the aim to own the stock when the options expire. Your goal has to be to buy a call option and profit when the stock price grows.  If call options expire in the money, you will end up paying a bigger amount to buy the stock. Much bigger than what you would have paid if you had bought the stock. If you want to hold the stock, buy it. Don’t play games with options. 

    And finally, one important note when it comes to questioning when to sell option call.

    The European-style options expire on the third Thursday of the month. The American options expire on the third Friday. Don’t forget about this time difference. This could result in huge financial losses for you.

    Forecast volatility, that’s a key ingredient in profiting from option trading.

  • Is PEG Ratio Really Useful?

    Is PEG Ratio Really Useful?

    Is PEG Ratio Really Useful?

    The PEG ratio is one of the most popular metrics. It is so easy to calculate it. It never takes more than 10 secs even if you are not good at math. 

    But, what do you think, is this extremely simple metric, this PEG ratio really useful?

    Let’s see. Let’s examine it a bit more on some examples.

    First of all, the PEG ratio or the price/earnings to growth ratio is a stock valuation measure. Investors use it to evaluate a company’s performance and investment risk. It is a measure, so it can be calculated. 

    When the PEG ratio value is 1 we can say there is an excellent bond between the company’s market value and its expected earnings growth. If the PEG ratio is higher than 1, the stock is overvalued. But when the PEG ratio is lower than 1, the stock is undervalued.

    The formula for PEG ratio is:

    PE Ratio (Price/Earnings) / Expected Growth Rate = PEG Ratio

    Assume we are examining two stocks with different characteristics

    Stock A company: 

    price – $20/share
    earnings – $4/share
    expected EPS growth – 5%

    Stock B company: 

    price – $40/share
    earnings – $4/share
    expected EPS growth = 20%

    For stock A company

    P/E ratio = $20/$4 = 5
    PEG ratio = 5/5 = 1

    For stock B company

    P/E ratio = $40/$4 = 10
    PEG ratio = 10/20 = 0.5

    If we study the P/E ratio for valuation plans, we will discover that the stock B company has an advantage because it has a P/E ratio that is 50% less than that stock A company has. But if you find that company A is going to improve its earnings 5 times faster than company B, you may modify your opinion. If you use the price to earnings growth, you will see that the stock A company trades at a lower PEG ratio than stock B company. So, what can we conclude? Company A stock may give a better value.


    But is that really true?

    Well, there are some weaknesses connected to the PEG ratio. Earnings growth is not an isolated thing in the market minds. To get a whole picture of the stock value you have to take care of many factors such as cash flow, dividends, revenue growth, etc.

    Further, when it comes to “growth” in the phrase “price/earnings to growth ratio” you will be faced with one problem when you are trying to value a company. You actually don’t know the rate of earnings growth. In the best case, you can guess or rely on Wall Street analysts. Having thin in mind, your PEG will be as good as your data is.

    Well, something is good with the PEG ratio. It is very useful for smaller companies but for large companies (for example Disney or Ford) where the growth isn’t so important to total returns, it can cheat.


    So, is the PEG ratio really useful?

    You have to keep in mind that it isn’t a mathematical result. The method is as good as its inputs. The future growth rate could be the main problem in this PEG formula. When you or any analyst make forecasts about the future it can be wrong.

    To make it clear, it is easy to calculate the PEG ratio for companies with weak growth. But, mature companies with excellent earnings and great dividends, have a slow growth rate. So, such companies will never have a PEG ratio of 1 or less. Right?

    It is almost the same for companies with fast growth.

    For instance, a company growing in a surplus of 30% per year will be incapable to maintain such a growth rate. Can you see how the PEG ratio is as good as its inputs? A huge amount of failures in the future earnings growth rises from a too optimistic or too pessimistic viewpoint for the company or industry. Getting an exact PEG ratio depends on what factors you use in the calculation. You may find that the PEG ratio is incorrect if you use historical growth rates. This one especially can lead to mistakes when future growth varies from the past.

    Bottom line

    Traders-Paradise wants to give some spotlight on the pros and cons of using the PEG ratio. As the answer to a question Is PEG ratio really useful, we can say: the PEG ratio is useful but only when you use it to improve a more precise discounted cash flow analysis or relative valuation.


  • NuVim Inc – Marijuana Penny Stock Under The Radar

    NuVim Inc – Marijuana Penny Stock Under The Radar

    NuVim Inc - Marijuana Penny Stock Under The Radar

    By Gorica Gligorijevic

    This company has two subsidiaries Stolle Milk Biologics, Inc., NuVim Powder, LLC. and stock price under one dollar

    Maybe you still didn’t notice this stock. But don’t worry, many didn’t. NuVim Inc stock is currently very cheap as penny stocks. It was traded at $0.0133 at the close of trading on October 21. But it is a stock worth looking out.

    Market cap $299,468
    Current price $0,0133

    NuVim Inc is a company from New Jersey. Actually, it was established in 1999 and is based in Lewes, Delaware. It sells vitamins and dietary supplement drinks. Why this particular stock is interesting to watch?

    Well, its current CEO Rick Kundrat was VP at Unilever’s Thomas J. Lipton Inc and managed the merger with Pepsi in 1991. This deserves to be noticed because of the fast-expanding cannabidiol (CBD) market global. Rick Kundrat has talked about a possible merger for NuVim merger partners. If the company moves into CBD-infused drinks it could be huge progress and stocks could be a goldmine.

    Cannabidiol is used for pain reduction. Moreover, it speeds up healing muscles and joints when have been weakened from hard exercise. But maybe the most important effect is in the field of arthritis or similar illnesses where it can help to reduce chronic pain. 

    NuVim, Inc. produces, distributes and sells beverage products

    The NuVim is a dietary supplement accessible in the refrigerated juice sections of elite supermarkets and fitness stores. You can find it in three flavors: chocolate, vanilla, and strawberry.  It helps to sustain the immune system, improves calcium absorption and digestion. NuVim contains a clinically proven natural prebiotic fiber. 

    NuVim INc is a small company with only 3 full-time employees, according to data from Yahoo Finance. From everything we know about this company, it falls into the packaged foods industry. The Company covers a range of user needs, like joint pain, muscle flexibility, wellness, weight control, nutrient supplement, and muscle recovery.

    When we put this company under the phrase “under the radar” we didn’t have its unrecognition among the investors in mind. The lack of information is obvious. It is very hard to find full information about them. The last info came from the short report:

    “During the second quarter of 2019, the company sold 1,000,000 shares of stock to Derek Spence for $10,000.”

    This was really cheap.

    As Traders-Paradise found, Derek R. Spence is Vi3’s CEO and Chairman of the Board. He joined Vi3 as an investor in 2012 and became a board member in 2014.

    Bottom line

    But what we all can see from its 3-months chart is the stock is doing well.
    Yes, it is a very low float stock that is actively seeking and interviewing merger partners. The merger could send this stock very high. Grab this stock while it is cheap and wait for it to grow.
    It isn’t expensive, honestly, it is very cheap. But this company has interesting potential. As support for this opinion, let’s repeat where is its focus. It is cannabidiol that is fast-expanding and becoming part of medicines, supplements, drinks. This company wants success and seeking for partnership telling us a lot. Grab it.


  • How To Know If a Stock is Worth Buying

    How To Know If a Stock is Worth Buying

    How To Know If a Stock is Worth Buying
    How to recognize if a stock is worth investing in?
    What causes a stock to be good or bad?
    What things to consider?

    By Guy Avtalyon

    How to know if a stock is worth buying? Let’s assume you are new in this field and how you can decide what stock to buy. For some investors, it is a tricky part. To be honest, it is hard for everyone. The risk is involved, the volatility of stock or market, the investment goal. Everything is on the table. But if you follow some rules connected to the estimation you can figure out how to know if the stock is worth buying. Yes, many people will tell you stock investing is like a wheel of fortune. And they are wrong. Investing is like solving the problem. Everyone has its own way, own style, but the goal is the same: solving a problem.

    Prudent investors must enter the stock investing as if they have to solve a problem. Step by step. 

    Buying stock isn’t like buying a new sofa and when you find it isn’t for your room you can take it back. When you buy stocks, you have to be convinced they will hold their value, increase in value, and you will gain profit when you sell or deliver to you notable dividends over time. The main point is to know when a stock is worth buying. 

    Look at the price

    When you have to decide if some stock is worth buying the first thing you will find is its price. You have to figure out how much the ownership of shares in some companies will cost you.

    The amount of money you have in your hands will determine how many shares you can buy but the most important is to know historical data about particular stock prices. If you find the stock has steadily increased over time you will know that you can expect a good value in the future. 

    Pay attention to revenue growth

    Share prices will grow if a company is growing. A company is growing when rising its revenue. Increasing revenue will show you if the company is strong. We can say it is a major indicator often called top line. The important part is not looking at revenue isolated. You have to observe all rise and drops in each quarter and year. And here is the tricky part. The positive trendline is good for the stock price but the revenue may be dropping or be flat and it is important to understand why that is.

    You should check the company’s current holdings, projections for future operations and stability. If you hear or read some news, no matter if they are local or even rumors that the company is doing bad, it is better to step back. You wouldn’t like to hold stocks with so much stress. Your money is involved and you could lose everything invested. So, check the company’s revenue, it is easy since almost all companies have their official websites where you can find all this info. 

    But keep one thing in mind. If it is a temporary situation and historical data shows its stock was good in price that can be good for you to buy a stock at a low price and wait for it to rebound over time.

    Some stocks may temporarily drop in price and it can be a good deal to buy them now because they have the potential to recover.

    What is the company’s earnings per share

    This info is important and you can easily count it. Just divide the leftover amount at the end of each quarter by the number of shares the company has sold, and you get the earnings per share. For example, if a company made $100 million in profits in the prior year and has 52 million shares, the earnings per share is $1.92. As an investor, you should pay attention to this since the higher earnings per share (EPS) shows you that the company is in good shape. And the tricky part again arises. Some companies can manipulate with EPS. The process is simple. They do it by buying back their shares. In that way, they are boosting EPS but not increasing profits.

    Use the technical and fundamental analysis to know if a stock is worth buying

    You will have some idea about stock’s quality if you check the prices over the past 200 days, for example. And you will see the trends. Trends are repeating. 

    Analysts think that by observing the movement over a determined period, you can define the baseline, the point where the stock should recover. Here the advice, don’t buy the stock at its highs, wait to come close to the baseline or to hit it. Some may ask how is good stock if hits the baseline. Well, when the stock hits the peak it is expensive, the price is increased, and the stock has no more space to run so the only possible scenario is to go down. If you buy a stock at its peak you will lose your money. So, it isn’t a good time to buy a stock.

    Also, perform fundamental analysis. That will show the current and projected financial aspect. Use that info to discover now’s value. Use the company’s statement and balance sheet to determine the business strength. It isn’t a 100% indicator,  but it is enough good sign of what you can expect from the company in the foreseeable future.

    How to know if a stock is worth buying

    One thing is sure and you must have that in mind when you are trying to know if a stock is worth buying.

    A company can’t manage every single thing that might affect the business. The general economy can influence the health of a company and its stock play. For example, consumer prices, the changes to interest rates can affect how a company is doing. That is not in connection with its own business. But, the stable economy produces companies’ wealth and share increases come with that. And opposite, share prices can stumble during times of economic uncertainty.

    You will find many analysts that issue reports and tips about individual stocks. These tips appear with “buy” or “sell” ratings. But analysts often disagree, so it isn’t recommended to depend on one report. Always compare several to know if a stock is worth buying.

  • Shefa Gems Mining Company Stock

    Shefa Gems Mining Company Stock

    Shefa Gems Mining Company Stock
    Shefa Gems is an Israeli company, a miner concentrated on precious stones.

    By Guy Avtalyon

    Shefa Gems projects are taken in Northern Israel. It is the explorer of globally recognized Carmeltazite. It is from Israel and listed on the London Stock Exchange.

    Market Cap £8.6mln
    Price: 5 GBX

    Updated: October 29, 2019

    Shefa Gems Ltd (LON:SEFA) Death of Director Abraham Ben Leah (Avi)
    Shefa Gems announced that Avi Taub, Chief Executive Officer of the Company, has passed away following a short illness.
    Vered Toledo, Chief Operating Officer said: “We all stayed with Avi vision and we have a mission to fulfill now – open the first alluvial gems mine in the Kishon Mid Reach northern Israel – I’m sure that with the help of God we will do it all for Abraham Ben Leah blessed memory.”
    Our condolences to his family and the Shafa team.

    Is Shefa Gems publicly listed

    Shefa Gems is listed on the London Stock Exchange (LSE) under the ticker: SEFA

    In the USA trading in the Shefa Gems Shares is available via brokers such as Fidelity or Charles Schwab

    Shefa Gems Ltd (LON: SEFA) is an Israel-based exploration mining company with its operations orientated to the north of the country.

    Shefa Gems Mining Company Stock


    About Shefa Gems Ltd.

    Shefa Gems, formerly known as Shefa Yamim, is essentially a precious stone miner. It discovered rubies, sapphires, Carmel sapphires, and diamonds.
    Shefa Gems’ focus is on exploration targets that it believes to have the highest upside and can be taken into production at an almost low cost. The company offers its services in Israel where founded in 1999.

    Shefa Gems is a pioneer in precious stones exploration in Israel.

    We found on its official website: “The first and only company in Israel focusing exclusively in mining exploration of precious stones in the North of the holy land.”
    Shefa Gems Ltd (LON: SEFA) has delivered the highest grade results to date from Zone 2 of its Kishon Mid-Reach project in Northern Israel.
    Shefa Gems (LSE: SEFA) is currently moving towards trial mining and revenue generation at its Kishon Mid-Reach project in the Mount Carmel region of Northern Israel. Besides regulatory and operational works to reach the result, the company is developing an intelligent marketing strategy. They are creating a jewelry collection in cooperation with the internationally acclaimed designers.

    The company is a multi-commodity explorer and the Kishon Mid-Reach is its primary asset. It a 4.5km-long and 150m-wide ground. The company has separated this field into three zones. Every zone is at different stages of exploration and development. Currently, most of the work is in Zone 1

    Shefa Gems finished an independent technical-economic evaluation on Zone 1 in February 2019 and found that the first mine should be able to process 1.5Mts of gravel over 11 years. This capacity can probably be doubled, showed the result of the evaluation, by halving unit operating costs to $10.15/t.

    The Possibilities

    The company owns two prospectings and one exploration permit in northern Israel, covering a total area of 614 square kilometers. The main exploration spots are the primary volcanic sources on Mount Carmel and the secondary sources of valley-filled sediment deposits everywhere the Kishon River.

    At Mount Carmel, the company has permission for 4 sources: Rakefet Magmatic Complex, Muhraka, Har Alon, and Beit Oren.

    To date, most of the exploration work has been carried out on the Rakefet Magmatic Complex. The geological mapping and rock and soil sampling are completed. The gems and industrial minerals are found.

    At Kishon, the main exploration target is the Kishon Mid-Reach. There is the company’s most high-level exploration project and open-ended exploration activities are being initiated to determine a SAMREC compliant Mineral Resource. 

    In October this year, the company performed its highest degree results to date from Zone 2 of its Kishon Mid-Reach project in Northern Israel. A sample yielding resulted in a mineral collection grade of 467 carats per 100 tonnes.

    The company renewed its license for Zone 1 in August this year for added 12 months.

    Shefa Yamim, today Shefa Gems Ltd. is listed on the London Stock Exchange in December 2017 after a placing and subscription at 110p per ordinary share. The company’s initial market capitalization was approximately £15.3mln. The company was 75% in the ownership of the subsidiary of Shefa Yamim Ltd, listed on the Tel Aviv Stock Exchange. After the London entry, the shareholding of Shefa Yamim Ltd has reduced to 48.9%. Traders-Paradise’s opinion is that investing this stock can have potential in the future.


  • AT&T – This Stock Can Beat Any Recession

    AT&T – This Stock Can Beat Any Recession

    AT&T - This Stock Can Beat Any Recession
    Why this stock is a good choice

    By Guy Avtalyon

    Could AT&T really beat a recession? According to historical data, it is a company with very good performances, a true winner. But let’s go a bit deeper.

    The high dividend yield of more than 6% is awesome
    35 years of continuously increasing
    More than 100 million customers in the US and Latin America 

    AT&T Ticker symbol T (NYSE)
    Market Cap $276.278B

    AT&T - This Stock Can Beat Any Recession

    AT&T Inc. has a great history, actually, it is the history of modern civilization. When 1874 Alexander Graham Bell invented the telephone. Two financial backers found the company that became AT&T. One year later the Bell Telephone Company, the first forerunner company to AT&T, is set up and issues stock to the seven principal shareowners. In 1946 AT&T started offering pre-cellular mobile telephone service. With only three channels available for operation, it was able to provide12 to 20 simultaneous calls in a whole area. But still…

    Next year AT&T develops the theory of cellular telephony. At that time, the technology to realize the theory did not yet exist. Actually, AT&T pioneered almost everything in telephony and communications. 

    A century and a half long history, visions, development, continuously ups, beating the crisis, and becoming greater and greater. 

    AT&T stock today

    Today, AT&T Inc. is one of the best investments you can imagine. The company offers various services like cable, wireless, satellite TV, and broadband telecommunications. This means the company has an extremely well-diversified portfolio. Revenue at more than $170 billion was up by 18% in the most recent quarter. In the same period earnings per share expanding 1.2%. 

    The company’s important $85 billion investment in Time Warner will provide AT&T access to mass-media brands such as HBO, CNN, TBS,  and TNT. Additional competitive edge comes from programming from the NBA, the NFL, MLB. Also, its acquisition of DirecTV in 2015, constituted it among the world’s biggest media companies. The management’s expectations are that this will produce earnings per share of $3.60 by the end of the fiscal year.

    AT&T dividends

    The annual ongoing dividend makes it a top pick for income investors.

    Those businesses give AT&T a wide moat, but it still has gaps. The company’s long term debt is about $158 billion, reported last quarter. The company is maybe too large scope and its wireless growth is a bit slow, the news about the number of its pay-TV customers is not good. 

    Moreover, the activists are forcing AT&T to consider some new opportunities for streamlining its stretched out business. First on the list is a spin-off of DirecTV. 

    Several weeks ago Elliott Management revealed its stake in AT&T and pushed the company to lower costs and make management reforms. One of them is to boost the stock price. Elliott stated its programs, which incorporate an important study of assets that could be traded or spun off, could raise the stock by at least 60% by the end of 2021.

    Relationship with Elliott Management 

    On Thursday, 17/10/19,  AT&T shares rose 0.74% in premarket trading to $38.09. The stock has increased 32.48% year to date and 16.34% during the past 52 weeks.
    The agreement could be reached very soon, maybe by the end of this month. But there are possibilities for agreement to fall apart, also. We will see.

    Nevertheless, analysts anticipate AT&T’s revenue to stay approximately the same next year and that earnings could rise just 2%. Those increase rates look weak, but the stock pays a yield of 5.5%. It’s also boosted its dividend annually for over 35 years.
    The company spent just 50% of its free cash flow on its dividend over the past 12 months. It expects to produce over $28 billion in free cash flow this year. That will be up from $22.4 billion in 2018. 

    AT&T and 5G 

    That could have an important influence on the company’s outlook and earnings next year. AT&T already started deploying 5G in 2018. In April this year, 19 cities had access to the company’s 5G network.  AT&T says the network will be more broadly available across the country next year.

    Investing in AT&T is a great opportunity to grow and there is an extraordinary dividend too. Having its history in mind and its penchant for developing new technologies, AT&T is the obvious winner. Moreover, it is a company that can beat any recession.