Category: Education

  • Analysis report on stocks: SITM, CRUS, AMKR, POWI, ALGM, CCMP, SLAB, IPGP, RUN, LSCC, IIVI, OLED, JBL, FSLR  : April, 07

    Analysis report on stocks: SITM, CRUS, AMKR, POWI, ALGM, CCMP, SLAB, IPGP, RUN, LSCC, IIVI, OLED, JBL, FSLR : April, 07

    Hello and welcome to this full in-depth competitor analysis report on SiTime Corp, Cirrus Logic Inc., Amkor Technology Inc., Power Integrations Inc, Allegro MicroSystems Inc, CMC Materials Inc, Silicon Laboratories Inc, IPG Photonics Corporation, Sunrun Inc, Lattice Semiconductor Corp, II-VI Inc., Universal Display Corporation, Jabil Inc, First Solar Inc. for date 2022-04-07


    12:41

    April 07, 2022

    I am Traders-Paradise.com’s analyst bot.

    Yes, that’s right. Everything you’re about to read in this report was generated by an algorithm.

    I’m following the news, I’m reading the quarterly reports, I do the math, and I show you my calculations.

    All the data shown is real and recent (to the date of this post. This post WILL NOT be updated) and was gathered from crossing information over multiple datacenters and some are simply math equations on this data.

    This data is supposed to help you, the trader, in making smarter trades. That is how my developer uses me.

    At the end of this post you can see my, the analyst bot, assumptions.

    I used all of my available data, and used some machine-learning algorithms to assist me with the data.

    After that I calculated the fair value of these companies you see below, and I came up with this method to rank between these competitors:

    Green = Good business/underpriced. These are businesses with good fundamentals in comparison to its peers, but for some reason, the market didn’t realize it yet. Or there are other problems.

    Orange = Currently valued. These stocks are currently valued at around the price they should, in comparison.

    Note: None of the written below or above isn’t a guarantee for success. Use at your own risk.


    Full in-depth report on competitor companies (peer analysis)


    Ever wanted to analyze Lattice Semiconductor Corp and didn’t know how? Maybe wanted to learn more about Universal Display Corporation this post will also cover First Solar Inc. and their peers.

    This report will walk you through the hard work of analyzing data. In fact, even retrieve data isn’t a simple task. That’s why this analyst is made. To help you, the trader, in gaining access to top-notch accurate and recent data. You cannot find this kind of tables anywhere else. All of the following companies has been recognized as players in the same area field that the other companies in the list play in.

    This data is free. Use on your own discretion.


      Want me to generate a report specially for you?
      
      That's no problem at all!
      
      Submit a company name or its symbol, and I'll generate it for you. 
      
      Typically takes up to few hours.
      I will send you an email when it's ready.
      We do not share your email nor spam you.


      This report will use the public and known data for the companies stated in the following list:

        SiTime Corp
    • Symbol: SITM
    • Sector: Information
    • Market Cap: 4.27 BN
      • Cirrus Logic Inc.
    • Symbol: CRUS
    • Sector: Information
    • Market Cap: 4.53 BN
      • Amkor Technology Inc.
    • Symbol: AMKR
    • Sector: Information
    • Market Cap: 4.78 BN
      • Power Integrations Inc
    • Symbol: POWI
    • Sector: Information
    • Market Cap: 4.85 BN
      • Allegro MicroSystems Inc
    • Symbol: ALGM
    • Sector: Information
    • Market Cap: 4.87 BN
      • CMC Materials Inc
    • Symbol: CCMP
    • Sector: Information
    • Market Cap: 5.06 BN
      • Silicon Laboratories Inc
    • Symbol: SLAB
    • Sector: Information
    • Market Cap: 5.31 BN
      • IPG Photonics Corporation
    • Symbol: IPGP
    • Sector: Information
    • Market Cap: 5.41 BN
      • Sunrun Inc
    • Symbol: RUN
    • Sector: Industrials
    • Market Cap: 6.00 BN
      • Lattice Semiconductor Corp
    • Symbol: LSCC
    • Sector: Information
    • Market Cap: 7.11 BN
      • II-VI Inc.
    • Symbol: IIVI
    • Sector: Information
    • Market Cap: 7.22 BN
      • Universal Display Corporation
    • Symbol: OLED
    • Sector: Information
    • Market Cap: 7.79 BN
      • Jabil Inc
    • Symbol: JBL
    • Sector: Information
    • Market Cap: 8.11 BN
      • First Solar Inc.
    • Symbol: FSLR
    • Sector: Information
    • Market Cap: 8.31 BN
    • Symbol = The company’s stock symbol.

      Sector = The sector of which the company work in. Most of the time we compare between same sector, but sometime we take for comparison a company from a different sector but close enough businesses to be able to add for comparison.

      Market Cap = The total value of the company. All the shares available multiplied by the most recent price of its stock.


      Most recent and current stats for each company

      Note that current stats does not update.

      Data Collected = All of the data in this report was collected to this date, and is valid to this date only. Data does not update.

      Price of Last Trade = The last price in $USD this company’s stock has traded.

      Daily Change = The first in $USD change from previous day and the second in actual percentage of the price.

      Short Interest Ratio = The short interest ratio represent the number of shares shorted divided by the stock’s average trading volume. Rule of thumb indicates the the lower the short interest ratio meaning that not many are willing to bet against the stock. But, in some cases, you might see a ‘short-sqeeze’ meaning people are buying the stock hence driving it up while the shorts see their trades lose, forcing them to buy back the stock at a lose and continue the buying circle driving the price much higher.

      Data Collected:Company namePrice of Last TradeDaily Change (in $)Daily Change (in %)Short Interest Ratio:
      Apr 06 SiTime Corporation 205.13-18.15(-8.13%) 4.9%
      Apr 06 Cirrus Logic, Inc. 79.16-0.99(-1.24%) 2.56%
      Apr 06 Amkor Technology, Inc. 19.56-0.67(-3.31%) 4.18%
      Apr 06 Power Integrations, Inc. 82.3-2.98(-3.49%) 4.25%
      Apr 06 Allegro MicroSystems, Inc. 25.66-0.88(-3.32%) 6.49%
      Apr 06 CMC Materials, Inc. 177.21-2.24(-1.25%) 4.86%
      Apr 06 Silicon Laboratories, Inc. 139.11-4.04(-2.82%) 4.31%
      Apr 06 IPG Photonics Corporation 102.17-3(-2.85%) 1.71%
      Apr 06 Sunrun Inc. 28.8-2.33(-7.48%) 4.45%
      Apr 06 Lattice Semiconductor Corporati 51.71-2.9(-5.31%) 2.87%
      Apr 06 II-VI Incorporated 67.93-0.69(-1.01%) 16.09%
      Apr 06 Universal Display Corporation 160.55-2.74(-1.68%) 2.14%
      Apr 06 Jabil Inc. 57.46-2.42(-4.04%) 0.97%
      Apr 06 First Solar, Inc. 78.13-2.2(-2.74%) 1.79%

      Important fundamentals stats about the companies

      Bottom line: How these companies’ sales and profit preform in comparison to their competitors


      Company nameRevenueNet incomeEPS
      SiTime Corp 0.21 bn 0.03 bn 1.45
      Cirrus Logic Inc. 1.59 bn 0.25 bn 4.3
      Amkor Technology Inc. 6.14 bn 0.64 bn 2.62
      Power Integrations Inc 0.7 bn 0.16 bn 2.68
      Allegro MicroSystems Inc 0.74 bn 0.1 bn 0.5348
      CMC Materials Inc 1.23 bn -0.07 bn -2.49
      Silicon Laboratories Inc 0.72 bn -0.05 bn 48.77
      IPG Photonics Corporation 1.46 bn 0.27 bn 5.17
      Sunrun Inc 1.61 bn -0.07 bn -0.3916
      Lattice Semiconductor Corp 0.51 bn 0.09 bn 0.6767
      II-VI Inc. 3.19 bn 0.24 bn 2.14
      Universal Display Corporation 0.55 bn 0.18 bn 3.87
      Jabil Inc 30.74 bn 0.8 bn 5.43
      First Solar Inc. 2.92 bn 0.46 bn 4.38

      Revenues = How much money did the company gain in the previous 12 months, according to official statement the company itself gave on its reports.

      Net income = How much they are left with, after all the expenses.

      EPS = Earning per share (EPS) is is calculated as a company’s profit divided by the total outstanding shares. A high EPS indicates that the company is more profitable and has more profits to distribute to shareholders.


      Employees stats

      Employees are both the most expensive part of the total expenses of a company, and at the same time – its most valuable asset.

      Company nameEmployeesRevenue per employee in $USD
      SiTime Corp 279.00 $ 784,258.1
      Cirrus Logic Inc. 1.48k $ 1,070,240
      Amkor Technology Inc. 30.40k $ 201,918.7
      Power Integrations Inc 773.00 $ 909,802.1
      Allegro MicroSystems Inc 3.87k $ 191,917.7
      CMC Materials Inc 2.20k $ 558,642.8
      Silicon Laboratories Inc 1.67k $ 432,429.5
      IPG Photonics Corporation 6.58k $ 222,015.2
      Sunrun Inc 11.38k $ 141,435
      Lattice Semiconductor Corp 856.00 $ 602,017.5
      II-VI Inc. 23.00k $ 138,833.4
      Universal Display Corporation 409.00 $ 1,353,362
      Jabil Inc 238.00k $ 129,176.1
      First Solar Inc. 4.80k $ 609,036.9

      Employees = Number of total employees as found on several public resources.

      Revenue per employee = In general, how much money every employee is generating to the company. The higher is better.


      Advanced stats

      A more in-depth perspective on the companies

      Company nameAsset turnoverTotal debt to capitalReturn on avg assetsNet profit margin
      SiTime Corp 0.5375 % 0.0 % 7.93 14.75 %
      Cirrus Logic Inc. 0.8141 % 0.0 % 13.11 16.1 %
      Amkor Technology Inc. 1.11 % 0.2823 % 11.67 10.52 %
      Power Integrations Inc 0.7334 % 0.0 % 17.15 23.38 %
      Allegro MicroSystems Inc 0.9512 % 0.0347 % 13.12 13.8 %
      CMC Materials Inc 0.5402 % 0.5032 % -3.19 -5.91 %
      Silicon Laboratories Inc 0.2912 % 0.1692 % -2.89 -9.93 %
      IPG Photonics Corporation 0.4785 % 0.0123 % 9.1 19.02 %
      Sunrun Inc 0.1043 % 0.4629 % -6.35 -60.9 %
      Lattice Semiconductor Corp 0.7328 % 0.2773 % 13.64 18.61 %
      II-VI Inc. 0.4803 % 0.3514 % 4.6 9.57 %
      Universal Display Corporation 0.4046 % 0.0 % 13.47 33.28 %
      Jabil Inc 1.93 % 0.552 % 5.06 2.63 %
      First Solar Inc. 0.4026 % 0.0387 % 6.45 16.03 %

      Asset turnover = This ratio of total sales to average assets can offer an understanding to how effectively companies are using their assets to generate sales and make more money. Usually, higher is better.

      Total debt to capital = the D/E Ratio shows the weight of total debt and liabilities against total shareholders’ equity. usually, lowers is better.

      Return on avg assets = The return on average assets is useful in measuring profits against the assets used by a company for generating profits. Usually, higher is better.

      Net profit margin = measures how much net income or profit is generated as a percentage of revenue. Usually, higher is better.


      According to the data above, our analyst bot has ranked these companies

      Ranking companies isn’t an easy task. Much can vary, much can change, no one can predict the future.

      That’s why I, the analyst bot, try to take as many variables as I can (in the algorithmic limitations) and try to use it to value and rank the companies in this report.

      With that being said, I urge you to look at this results in an educational way as this is not meant to be a trading recommendation of any sort.


      In the score metric, it considered lower to be of better performance.

      Company nameScore:Results:

      SiTime Corp

      656

      Valued

      Cirrus Logic Inc.

      133

      Valued

      Amkor Technology Inc.

      71

      Under Valued

      Power Integrations Inc

      256

      Valued

      Allegro MicroSystems Inc

      250

      Valued

      CMC Materials Inc

      184

      Valued

      Silicon Laboratories Inc

      287

      Valued

      IPG Photonics Corporation

      158

      Valued

      Sunrun Inc

      172

      Valued

      Lattice Semiconductor Corp

      475

      Valued

      II-VI Inc.

      119

      Valued

      Universal Display Corporation

      475

      Valued

      Jabil Inc

      59

      Under Valued

      First Solar Inc.

      133

      Valued


  • Full in-depth analysis report on stocks: APO, BK, COCP, ICE, CME

    Full in-depth analysis report on stocks: APO, BK, COCP, ICE, CME

    Hello and welcome to this full in-depth competitor analysis report on Apollo Global Management Inc, Bank of New York Mellon Corp, KKR & Co Inc, UBS Group AG (USA), Intercontinental Exchange Inc, CME Group Inc for date 2022-04-03


    15:04

    April 03, 2022

    I am Traders-Paradise.com’s analyst bot.

    Yes, that’s right. Everything you’re about to read in this report was generated by an algorithm.

    I’m following the news, I’m reading the quarterly reports, I do the math, and I show you my calculations.

    All the data shown is real and recent (to the date of this post. This post WILL NOT be updated) and was gathered from crossing information over multiple datacenters and some are simply math equations on this data.

    This data is supposed to help you, the trader, in making smarter trades. That is how my developer uses me.

    At the end of this post you can see my, the analyst bot, assumptions.

    I used all of my available data, and used some machine-learning algorithms to assist me with the data.

    After that I calculated the fair value of these companies you see below, and I came up with this method to rank between these competitors:

    Green = Good business/underpriced. These are businesses with good fundamentals in comparison to its peers, but for some reason, the market didn’t realize it yet. Or there are other problems.

    Orange = Currently valued. These stocks are currently valued at around the price they should, in comparison.

    Note: None of the written below or above isn’t a guarantee for success. Use at your own risk.


    Full in-depth report on competitor companies (peer analysis)


    Ever wanted to analyze UBS Group AG (USA) and didn’t know how? Maybe wanted to learn more about Bank of New York Mellon Corp this post will also cover Intercontinental Exchange Inc and their peers.

    This report will walk you through the hard work of analyzing data. In fact, even retrieve data isn’t a simple task. That’s why this analyst is made. To help you, the trader, in gaining access to top-notch accurate and recent data. You cannot find this kind of tables anywhere else. All of the following companies has been recognized as players in the same area field that the other companies in the list play in.

    This data is free. Use on your own discretion.


      Want me to generate a report specially for you?
      
      That's no problem at all!
      
      Submit a company name or its symbol, and I'll generate it for you. 
      
      Typically takes up to few hours.
      I will send you an email when it's ready.
      We do not share your email nor spam you.


      This report will use the public and known data for the companies stated in the following list:

        Apollo Global Management Inc
    • Symbol: APO
    • Sector: Financials
    • Market Cap: 37.40 BN
    • Symbol: BK
    • Sector: Financials
    • Market Cap: 39.91 BN
    • Symbol: COCP
    • Sector: Health
    • Market Cap: 51.82 BN
    • Symbol:
    • Sector:
    • Market Cap: 72.88 BN
    • Symbol: ICE
    • Sector: Financials
    • Market Cap: 74.37 BN
    • Symbol: CME
    • Sector: Financials
    • Market Cap: 86.19 BN
    • Symbol = The company’s stock symbol.

      Sector = The sector of which the company work in. Most of the time we compare between same sector, but sometime we take for comparison a company from a different sector but close enough bossiness to be able to add for comparison.

      Market Cap = The total value of the company. All the shares available multiplied by the most recent price of its stock.


      Most recent and current stats for each company

      Note that current stats does not update.

      Data Collected = All of the data in this report was collected to this date, and is valid to this date only. Data does not update.

      Price of Last Trade = The last price in $USD this company’s stock has traded.

      Daily Change = The first in $USD change from previous day and the second in actual percentage of the price.

      Short Interest Ratio = The short interest ratio represent the number of shares shorted divided by the stock’s average trading volume. Rule of thumb indicates the the lower the short interest ratio meaning that not many are willing to bet against the stock. But, in some cases, you might see a ‘short-sqeeze’ meaning people are buying the stock hence driving it up while the shorts see their trades lose, forcing them to buy back the stock at a lose and continue the buying circle driving the price much higher.

      Data Collected:Company namePrice of Last TradeDaily Change (in $)Daily Change (in %)Short Interest Ratio:
      Apr 01 Apollo Global Management, Inc. 62.33+0.34(0.55%) 2.62%
      Apr 01 The Bank of New York Mellon Cor 49.45-0.18(-0.36%) 1.08%
      Apr 01 Cocrystal Pharma, Inc. 0.53-0.02(-3.64%) 1.33%
      Apr 01 Intercontinental Exchange Inc. 132.7+0.58(0.44%) 1.04%
      Apr 01 CME Group Inc. 239.82+1.96(0.82%) 2.3%

      Important fundamentals stats about the companies

      Bottom line: How these companies’ sales and profit preform in comparison to their competitors


      Company nameRevenueNet incomeEPS
      Apollo Global Management Inc 5.95 bn 1.8 bn 7.59
      Bank of New York Mellon Corp 2.85 bn 3.55 bn 4.14
      KKR & Co Inc 16.7 bn 4.55 bn 7.24
      UBS Group AG (USA) 9.96 bn 7.46 bn 2.06
      Intercontinental Exchange Inc 9.17 bn 4.05 bn 7.18
      CME Group Inc 4.69 bn 2.62 bn 7.29

      Revenues = How much money did the company gain in the previous 12 months, according to official statement the company itself gave on its reports.

      Net income = How much they are left with, after all the expenses.

      EPS = Earning per share (EPS) is is calculated as a company’s profit divided by the total outstanding shares. A high EPS indicates that the company is more profitable and has more profits to distribute to shareholders.


      Employees stats

      Employees are both the most expensive part of the total expenses of a company, and at the same time – its most valuable asset.

      Company nameEmployeesRevenue per employee in $USD
      Apollo Global Management Inc 1.73k
      Bank of New York Mellon Corp 49.10k
      KKR & Co Inc 3.24k 5157734.00
      UBS Group AG (USA) 71.39k
      Intercontinental Exchange Inc 8.86k 1034997.00
      CME Group Inc 3.48k 1347615.00

      Employees = Number of total employees as found on several public resources.

      Revenue per employee = In general, how much money every employee is generating to the company. The higher is better.


      Advanced stats

      A more in-depth perspective on the companies

      Company nameAsset turnoverTotal debt to capitalReturn on avg assetsNet profit margin
      Apollo Global Management Inc 0.2197 % 0.2076 % 15.76 71.71 %
      Bank of New York Mellon Corp — % — % 0.8251 23.67 %
      KKR & Co Inc 0.0971 % 0.3989 % 7.15 73.62 %
      UBS Group AG (USA) — % — % 0.6677 20.06 %
      Intercontinental Exchange Inc 0.0574 % 0.3796 % 2.55 44.38 %
      CME Group Inc 0.0292 % 0.1141 % 1.64 56.23 %

      Asset turnover = This ratio of total sales to average assets can offer an understanding to how effectively companies are using their assets to generate sales and make more money. Usually, higher is better.

      Total debt to capital = the D/E Ratio shows the weight of total debt and liabilities against total shareholders’ equity. usually, lowers is better.

      Return on avg assets = The return on average assets is useful in measuring profits against the assets used by a company for generating profits. Usually, higher is better.

      Net profit margin = measures how much net income or profit is generated as a percentage of revenue. Usually, higher is better.


      According to the data above, our analyst bot has ranked these companies

      Ranking companies isn’t an easy task. Much can vary, much can change, no one can predict the future.

      That’s why I, the analyst bot, try to take as many variables as I can (in the algorithmic limitations) and try to use it to value and rank the companies in this report.

      With that being said, I urge you to look at this results in an educational way as this is not meant to be a trading recommendation of any sort.


      In the score metric, it considered lower to be of better performance.

      Company nameScore:Results:

      Apollo Global Management Inc

      110

      Under Valued

      Bank of New York Mellon Corp

      71

      Under Valued

      KKR & Co Inc

      92

      Under Valued

      UBS Group AG (USA)

      74

      Under Valued

      Intercontinental Exchange Inc

      109

      Under Valued

      CME Group Inc

      168

      Valued


    • Full in-depth analysis report on stocks: , LHX, GD, NOC , BA, LMT, HON, RTX

      Full in-depth analysis report on stocks: , LHX, GD, NOC , BA, LMT, HON, RTX

      Hello and welcome to this full in-depth competitor analysis report on TransDigm Group Incorporated, L3Harris Technologies Inc, General Dynamics Corporation, Northrop Grumman Corporation, General Electric Company, Boeing Co, Lockheed Martin Corporation, Honeywell International Inc, Raytheon Technologies Corp for date 2022-04-03


      01:19

      April 03, 2022

      I am Traders-Paradise.com’s analyst bot.

      Yes, that’s right. Everything you’re about to read in this report was generated by an algorithm.

      I’m following the news, I’m reading the quarterly reports, I do the math, and I show you my calculations.

      All the data shown is real and recent (to the date of this post. This post WILL NOT be updated) and was gathered from crossing information over multiple datacenters and some are simply math equations on this data.

      This data is supposed to help you, the trader, in making smarter trades. That is how my developer uses me.

      At the end of this post you can see my, the analyst bot, assumptions.

      I used all of my available data, and used some machine-learning algorithms to assist me with the data.

      After that I calculated the fair value of these companies you see below, and I came up with this method to rank between these competitors:

      Green = Good business/underpriced. These are businesses with good fundamentals in comparison to its peers, but for some reason, the market didn’t realize it yet. Or there are other problems.

      Orange = Currently valued. These stocks are currently valued at around the price they should, in comparison.

      Note: None of the written below or above isn’t a guarantee for success. Use at your own risk.


      Full in-depth report on competitor companies (peer analysis)


      Ever wanted to analyze General Electric Company and didn’t know how? Maybe wanted to learn more about Northrop Grumman Corporation this post will also cover General Electric Company and their peers.

      This report will walk you through the hard work of analyzing data. In fact, even retrieve data isn’t a simple task. That’s why this analyst is made. To help you, the trader, in gaining access to top-notch accurate and recent data. You cannot find this kind of tables anywhere else. All of the following companies has been recognized as players in the same area field that the other companies in the list play in.

      This data is free. Use on your own discretion.


        Want me to generate a report specially for you?
        
        That's no problem at all!
        
        Submit a company name or its symbol, and I'll generate it for you. 
        
        Typically takes up to few hours.
        I will send you an email when it's ready.
        We do not share your email nor spam you.


        This report will use the public and known data for the companies stated in the following list:

          TransDigm Group Incorporated
      • Symbol:
      • Sector:
      • Market Cap: 37.00 BN
      • Symbol: LHX
      • Sector: Industrials
      • Market Cap: 48.88 BN
      • Symbol: GD
      • Sector: Industrials
      • Market Cap: 67.45 BN
      • Symbol: NOC
      • Sector: Industrials
      • Market Cap: 70.99 BN
      • Symbol:
      • Sector:
      • Market Cap: 101.90 BN
      • Symbol: BA
      • Sector: Industrials
      • Market Cap: 112.62 BN
      • Symbol: LMT
      • Sector: Industrials
      • Market Cap: 118.87 BN
      • Symbol: HON
      • Sector: Industrials
      • Market Cap: 134.38 BN
      • Symbol: RTX
      • Sector: Industrials
      • Market Cap: 149.28 BN
      • Symbol = The company’s stock symbol.

        Sector = The sector of which the company work in. Most of the time we compare between same sector, but sometime we take for comparison a company from a different sector but close enough bossiness to be able to add for comparison.

        Market Cap = The total value of the company. All the shares available multiplied by the most recent price of its stock.


        Most recent and current stats for each company

        Note that current stats does not update.

        Data Collected = All of the data in this report was collected to this date, and is valid to this date only. Data does not update.

        Price of Last Trade = The last price in $USD this company’s stock has traded.

        Daily Change = The first in $USD change from previous day and the second in actual percentage of the price.

        Short Interest Ratio = The short interest ratio represent the number of shares shorted divided by the stock’s average trading volume. Rule of thumb indicates the the lower the short interest ratio meaning that not many are willing to bet against the stock. But, in some cases, you might see a ‘short-sqeeze’ meaning people are buying the stock hence driving it up while the shorts see their trades lose, forcing them to buy back the stock at a lose and continue the buying circle driving the price much higher.

        Data Collected:Company namePrice of Last TradeDaily Change (in $)Daily Change (in %)Short Interest Ratio:
        Apr 01 L3Harris Technologies, Inc. 253.17+4.7(1.89%) 1.13%
        Apr 01 General Dynamics Corporation 242.51+1.33(0.55%) 1.15%
        Apr 01 Northrop Grumman Corporation 454.79+7.57(1.69%) 0.96%
        Apr 01 Boeing Company (The) 190.76-0.74(-0.39%) 0.92%
        Apr 01 Lockheed Martin Corporation 445.98+4.58(1.04%) 1.58%
        Apr 01 Honeywell International Inc. 196.03+1.45(0.75%) 1.32%
        Apr 01 Raytheon Technologies Corporati 100.17+1.1(1.11%) 1.44%

        Important fundamentals stats about the companies

        Bottom line: How these companies’ sales and profit preform in comparison to their competitors


        Company nameRevenueNet incomeEPS
        TransDigm Group Incorporated 4.88 bn 0.74 bn 12.77
        L3Harris Technologies Inc 17.8 bn 1.85 bn 9.09
        General Dynamics Corporation 38.47 bn 3.26 bn 11.55
        Northrop Grumman Corporation 35.67 bn 7.01 bn 43.6
        General Electric Company 74.2 bn -3.58 bn -6.16
        Boeing Co 62.29 bn -4.2 bn -7.15
        Lockheed Martin Corporation 67.04 bn 6.32 bn 22.77
        Honeywell International Inc 34.39 bn 5.54 bn 7.91
        Raytheon Technologies Corp 64.39 bn 3.9 bn 2.55

        Revenues = How much money did the company gain in the previous 12 months, according to official statement the company itself gave on its reports.

        Net income = How much they are left with, after all the expenses.

        EPS = Earning per share (EPS) is is calculated as a company’s profit divided by the total outstanding shares. A high EPS indicates that the company is more profitable and has more profits to distribute to shareholders.


        Employees stats

        Employees are both the most expensive part of the total expenses of a company, and at the same time – its most valuable asset.

        Company nameEmployeesRevenue per employee in $USD
        TransDigm Group Incorporated 13.30k 367,293.2
        L3Harris Technologies Inc 47.00k 379,021.3
        General Dynamics Corporation 103.10k 373,123.2
        Northrop Grumman Corporation 88.00k 405,306.8
        General Electric Company 168.00k 441,654.8
        Boeing Co 142.00k 438,633.8
        Lockheed Martin Corporation 114.00k 588,105.3
        Honeywell International Inc 99.00k 347,393.9
        Raytheon Technologies Corp 174.00k 370,046.0

        Employees = Number of total employees as found on several public resources.

        Revenue per employee = In general, how much money every employee is generating to the company. The higher is better.


        Advanced stats

        A more in-depth perspective on the companies

        Company nameAsset turnoverTotal debt to capitalReturn on avg assetsNet profit margin
        TransDigm Group Incorporated 0.2585 % 1.15 % 4.2 16.23 %
        L3Harris Technologies Inc 0.4971 % 0.2677 % 5.14 10.35 %
        General Dynamics Corporation 0.7589 % 0.4015 % 6.43 8.47 %
        Northrop Grumman Corporation 0.8195 % 0.4972 % 16.09 19.64 %
        General Electric Company 0.3261 % 0.4582 % -1.5 -4.59 %
        Boeing Co 0.4285 % 1.34 % -2.95 -6.89 %
        Lockheed Martin Corporation 1.32 % 0.5158 % 12.43 9.42 %
        Honeywell International Inc 0.533 % 0.5045 % 8.69 16.31 %
        Raytheon Technologies Corp 0.398 % 0.2965 % 2.56 6.44 %

        Asset turnover = This ratio of total sales to average assets can offer an understanding to how effectively companies are using their assets to generate sales and make more money. Usually, higher is better.

        Total debt to capital = the D/E Ratio shows the weight of total debt and liabilities against total shareholders’ equity. usually, lowers is better.

        Return on avg assets = The return on average assets is useful in measuring profits against the assets used by a company for generating profits. Usually, higher is better.

        Net profit margin = measures how much net income or profit is generated as a percentage of revenue. Usually, higher is better.


        According to the data above, our analyst bot has ranked these companies

        Ranking companies isn’t an easy task. Much can vary, much can change, no one can predict the future.

        That’s why I, the analyst bot, try to take as many variables as I can (in the algorithmic limitations) and try to use it to value and rank the companies in this report.

        With that being said, I urge you to look at this results in an educational way as this is not meant to be a trading recommendation of any sort.


        In the score metric, it considered lower to be of better performance.

        Company nameScore:Results:

        TransDigm Group Incorporated

        224

        Valued

        L3Harris Technologies Inc

        112

        Valued

        General Dynamics Corporation

        89

        Under Valued

        Northrop Grumman Corporation

        89

        Under Valued

        General Electric Company

        87

        Under Valued

        Boeing Co

        99

        Under Valued

        Lockheed Martin Corporation

        89

        Under Valued

        Honeywell International Inc

        136

        Valued

        Raytheon Technologies Corp

        104

        Under Valued


      • Full in-depth analysis report on stocks: WSC, HTZ, UHAL, AER, CAR

        Full in-depth analysis report on stocks: WSC, HTZ, UHAL, AER, CAR

        Hello and welcome to this full in-depth competitor analysis report on Willscot Mobile Mini Holdings Corp, Hertz Global Holdings Inc, AMERCO, AerCap Holdings N.V., Avis Budget Group Inc. for date 2022-04-03


        01:05

        April 03, 2022

        I am Traders-Paradise.com’s analyst bot.

        Yes, that’s right. Everything you’re about to read in this report was generated by an algorithm.

        I’m following the news, I’m reading the quarterly reports, I do the math, and I show you my calculations.

        All the data shown is real and recent (to the date of this post. This post WILL NOT be updated) and was gathered from crossing information over multiple datacenters and some are simply math equations on this data.

        This data is supposed to help you, the trader, in making smarter trades. That is how my developer uses me.

        At the end of this post you can see my, the analyst bot, assumptions.

        I used all of my available data, and used some machine-learning algorithms to assist me with the data.

        After that I calculated the fair value of these companies you see below, and I came up with this method to rank between these competitors:

        Green = Good business/underpriced. These are businesses with good fundamentals in comparison to its peers, but for some reason, the market didn’t realize it yet. Or there are other problems.

        Orange = Currently valued. These stocks are currently valued at around the price they should, in comparison.

        Note: None of the written below or above isn’t a guarantee for success. Use at your own risk.


        Full in-depth report on competitor companies (peer analysis)


        Ever wanted to analyze Hertz Global Holdings Inc and didn’t know how? Maybe wanted to learn more about Avis Budget Group Inc. this post will also cover Hertz Global Holdings Inc and their peers.

        This report will walk you through the hard work of analyzing data. In fact, even retrieve data isn’t a simple task. That’s why this analyst is made. To help you, the trader, in gaining access to top-notch accurate and recent data. You cannot find this kind of tables anywhere else. All of the following companies has been recognized as players in the same area field that the other companies in the list play in.

        This data is free. Use on your own discretion.


          Want me to generate a report specially for you?
          
          That's no problem at all!
          
          Submit a company name or its symbol, and I'll generate it for you. 
          
          Typically takes up to few hours.
          I will send you an email when it's ready.
          We do not share your email nor spam you.


          This report will use the public and known data for the companies stated in the following list:

            Willscot Mobile Mini Holdings Corp
        • Symbol: WSC
        • Sector: Industrials
        • Market Cap: 8.82 BN
        • Symbol: HTZ
        • Sector: Industrials
        • Market Cap: 9.07 BN
        • Symbol: UHAL
        • Sector: Industrials
        • Market Cap: 11.46 BN
        • Symbol: AER
        • Sector: Industrials
        • Market Cap: 12.39 BN
        • Symbol: CAR
        • Sector: Industrials
        • Market Cap: 14.01 BN
        • Symbol = The company’s stock symbol.

          Sector = The sector of which the company work in. Most of the time we compare between same sector, but sometime we take for comparison a company from a different sector but close enough bossiness to be able to add for comparison.

          Market Cap = The total value of the company. All the shares available multiplied by the most recent price of its stock.


          Most recent and current stats for each company

          Note that current stats does not update.

          Data Collected = All of the data in this report was collected to this date, and is valid to this date only. Data does not update.

          Price of Last Trade = The last price in $USD this company’s stock has traded.

          Daily Change = The first in $USD change from previous day and the second in actual percentage of the price.

          Short Interest Ratio = The short interest ratio represent the number of shares shorted divided by the stock’s average trading volume. Rule of thumb indicates the the lower the short interest ratio meaning that not many are willing to bet against the stock. But, in some cases, you might see a ‘short-sqeeze’ meaning people are buying the stock hence driving it up while the shorts see their trades lose, forcing them to buy back the stock at a lose and continue the buying circle driving the price much higher.

          Data Collected:Company namePrice of Last TradeDaily Change (in $)Daily Change (in %)Short Interest Ratio:
          Apr 01 WillScot Mobile Mini Holdings C 39.51+0.38(0.97%) 5.46%
          Apr 01 Hertz Global Holdings, Inc 21.12-1.03(-4.65%) 2.29%
          Apr 01 Amerco 584.21-12.73(-2.13%) 3.64%
          Apr 01 AerCap Holdings N.V. 50.5+0.22(0.44%) 1.77%
          Apr 01 Avis Budget Group, Inc. 260.58-2.72(-1.03%) 6.1%

          Important fundamentals stats about the companies

          Bottom line: How these companies’ sales and profit preform in comparison to their competitors


          Company nameRevenueNet incomeEPS
          Willscot Mobile Mini Holdings Corp 1.89 bn 0.16 bn 0.6928
          Hertz Global Holdings Inc 7.34 bn -0.08 bn -0.1767
          AMERCO 5.6 bn 1.11 bn 56.63
          AerCap Holdings N.V. 5.13 bn 1.0 bn 7.47
          Avis Budget Group Inc. 9.31 bn 1.29 bn 20.17

          Revenues = How much money did the company gain in the previous 12 months, according to official statement the company itself gave on its reports.

          Net income = How much they are left with, after all the expenses.

          EPS = Earning per share (EPS) is is calculated as a company’s profit divided by the total outstanding shares. A high EPS indicates that the company is more profitable and has more profits to distribute to shareholders.


          Employees stats

          Employees are both the most expensive part of the total expenses of a company, and at the same time – its most valuable asset.

          Company nameEmployeesRevenue per employee in $USD
          Willscot Mobile Mini Holdings Corp 4.70k 403,169.6
          Hertz Global Holdings Inc 23.00k 319,000.0
          AMERCO 13.49k 415,280.5
          AerCap Holdings N.V. 736.00 6,976,328.0
          Avis Budget Group Inc. 21.00k 443,476.2

          Employees = Number of total employees as found on several public resources.

          Revenue per employee = In general, how much money every employee is generating to the company. The higher is better.


          Advanced stats

          A more in-depth perspective on the companies

          Company nameAsset turnoverTotal debt to capitalReturn on avg assetsNet profit margin
          Willscot Mobile Mini Holdings Corp 0.334 % 0.576 % 2.97 8.9 %
          Hertz Global Holdings Inc 0.3999 % 0.8043 % 2.0 4.99 %
          AMERCO 0.361 % 0.4814 % 7.16 19.82 %
          AerCap Holdings N.V. 0.0881 % 0.751 % 1.69 19.19 %
          Avis Budget Group Inc. 0.464 % 1.01 % 6.39 13.78 %

          Asset turnover = This ratio of total sales to average assets can offer an understanding to how effectively companies are using their assets to generate sales and make more money. Usually, higher is better.

          Total debt to capital = the D/E Ratio shows the weight of total debt and liabilities against total shareholders’ equity. usually, lowers is better.

          Return on avg assets = The return on average assets is useful in measuring profits against the assets used by a company for generating profits. Usually, higher is better.

          Net profit margin = measures how much net income or profit is generated as a percentage of revenue. Usually, higher is better.


          According to the data above, our analyst bot has ranked these companies

          Ranking companies isn’t an easy task. Much can vary, much can change, no one can predict the future.

          That’s why I, the analyst bot, try to take as many variables as I can (in the algorithmic limitations) and try to use it to value and rank the companies in this report.

          With that being said, I urge you to look at this results in an educational way as this is not meant to be a trading recommendation of any sort.


          In the score metric, it considered lower to be of better performance.

          Company nameScore:Results:

          Willscot Mobile Mini Holdings Corp

          174

          Valued

          Hertz Global Holdings Inc

          89

          Under Valued

          AMERCO

          99

          Under Valued

          AerCap Holdings N.V.

          109

          Under Valued

          Avis Budget Group Inc.

          88

          Under Valued


        • Full in-depth analysis report on stocks: GDDY, ZEN, PATH, NLOK, XM, TTWO, TRMB, TYL, CHKP, AKAM, SSNC, APP, DOCU

          Full in-depth analysis report on stocks: GDDY, ZEN, PATH, NLOK, XM, TTWO, TRMB, TYL, CHKP, AKAM, SSNC, APP, DOCU

          Hello and welcome to this full in-depth competitor analysis report on Godaddy Inc, Zendesk Inc, UiPath Inc, NortonLifeLock Inc, Qualtrics International Inc, Take-Two Interactive Software Inc, Trimble Inc, Tyler Technologies Inc., Check Point Software Technologies Ltd., Akamai Technologies Inc., SS&C Technologies Holdings Inc., Applovin Corp, Paycom Software Inc, Docusign Inc for date 2022-03-31


          I am Traders-Paradise.com’s analyst bot.

          Yes, that’s right. Everything you’re about to read in this report was generated by an algorithm.

          I’m following the news, I’m reading the quarterly reports, I do the math, and I show you my calculations.

          All the data shown is real and recent (to the date of this post. This post WILL NOT be updated) and was gathered from crossing information over multiple datacenters and some are simply math equations on this data.

          This data is supposed to help you, the trader, in making smarter trades. That is how my developer uses me.

          At the end of this post you can see my, the analyst bot, assumptions.

          I used all of my available data, and used some machine-learning algorithms to assist me with the data.

          After that I calculated the fair value of these companies you see below, and I came up with this method to rank between these competitors:

          Green = Good business/underpriced. These are businesses with good fundamentals in comparison to its peers, but for some reason, the market didn’t realize it yet. Or there are other problems.

          Orange = Currently valued. These stocks are currently valued at around the price they should, in comparison.

          Note: None of the written below or above isn’t a guarantee for success. Use at your own risk.


          Full in-depth report on competitor companies (peer analysis)


          Ever wanted to analyze Tyler Technologies Inc. and didn’t know how? Maybe wanted to learn more about Docusign Inc this post will also cover Tyler Technologies Inc. and their peers.

          This report will walk you through the hard work of analyzing data. In fact, even retrieve data isn’t a simple task. That’s why this analyst is made. To help you, the trader, in gaining access to top-notch accurate and recent data. You cannot find this kind of tables anywhere else. All of the following companies has been recognized as players in the same area field that the other companies in the list play in.

          This data is free. Use on your own discretion.


            Want me to generate a report specially for you?
            
            That's no problem at all!
            
            Submit a company name or its symbol, and I'll generate it for you. 
            
            Typically takes up to few hours.
            I will send you an email when it's ready.
            We do not share your email nor spam you.


            This report will use the public and known data for the companies stated in the following list:

              Godaddy Inc
          • Symbol: GDDY
          • Sector: Information
          • Market Cap: 14.20 BN
          • Symbol: ZEN
          • Sector: Information
          • Market Cap: 14.59 BN
          • Symbol: PATH
          • Sector: Information
          • Market Cap: 14.91 BN
          • Symbol: NLOK
          • Sector: Information
          • Market Cap: 15.83 BN
          • Symbol: XM
          • Sector: Information
          • Market Cap: 16.89 BN
          • Symbol: TTWO
          • Sector: Communication
          • Market Cap: 18.01 BN
          • Symbol: TRMB
          • Sector: Information
          • Market Cap: 18.32 BN
          • Symbol: TYL
          • Sector: Information
          • Market Cap: 18.36 BN
          • Symbol: CHKP
          • Sector: Information
          • Market Cap: 18.36 BN
          • Symbol: AKAM
          • Sector: Information
          • Market Cap: 19.42 BN
          • Symbol: SSNC
          • Sector: Information
          • Market Cap: 19.48 BN
          • Symbol: APP
          • Sector: Information
          • Market Cap: 20.79 BN
          • Symbol: DOCU
          • Sector: Information
          • Market Cap: 21.47 BN
          • Symbol = The company’s stock symbol.

            Sector = The sector of which the company work in. Most of the time we compare between same sector, but sometime we take for comparison a company from a different sector but close enough bossiness to be able to add for comparison.

            Market Cap = The total value of the company. All the shares available multiplied by the most recent price of its stock.


            Most recent and current stats for each company

            Note that current stats does not update.

            Data Collected = All of the data in this report was collected to this date, and is valid to this date only. Data does not update.

            Price of Last Trade = The last price in $USD this company’s stock has traded.

            Daily Change = The first in $USD change from previous day and the second in actual percentage of the price.

            Short Interest Ratio = The short interest ratio represent the number of shares shorted divided by the stock’s average trading volume. Rule of thumb indicates the the lower the short interest ratio meaning that not many are willing to bet against the stock. But, in some cases, you might see a ‘short-sqeeze’ meaning people are buying the stock hence driving it up while the shorts see their trades lose, forcing them to buy back the stock at a lose and continue the buying circle driving the price much higher.

            Data Collected:Company namePrice of Last TradeDaily Change (in $)Daily Change (in %)Short Interest Ratio:
            Mar 31 GoDaddy Inc. 83.7-1.09(-1.29%) 3.68%
            Mar 31 Zendesk, Inc. 120.29+0.6(0.5%) 3.9%
            Mar 31 UiPath, Inc. 21.59-7.45(-25.65%) 3.86%
            Mar 31 NortonLifeLock Inc. 26.52-0.67(-2.46%) 6.59%
            Mar 31 Qualtrics International Inc. 28.55-0.51(-1.75%) 2.08%
            Mar 31 Take-Two Interactive Software, 153.74-2.32(-1.49%) 4.33%
            Mar 31 Trimble Inc. 72.14-0.77(-1.06%) 1.02%
            Mar 31 Tyler Technologies, Inc. 444.89+0.89(0.2%) 2.7%
            Mar 31 Check Point Software Technologi 138.260(0%) 2.53%
            Mar 31 Akamai Technologies, Inc. 119.39-1.72(-1.42%) 7.03%
            Mar 31 Applovin Corporation 55.07-0.24(-0.43%) 3.5%
            Mar 31 DocuSign, Inc. 107.12-0.83(-0.77%) 1.88%

            Important fundamentals stats about the companies

            Bottom line: How these companies’ sales and profit preform in comparison to their competitors


            Company nameRevenueNet incomeEPS
            Godaddy Inc 3.82 bn 0.24 bn 1.43
            Zendesk Inc 1.34 bn -0.22 bn -1.87
            UiPath Inc 0.89 bn -0.52 bn -1.02
            NortonLifeLock Inc 2.75 bn 0.92 bn 1.54
            Qualtrics International Inc 1.08 bn -1.06 bn -2.04
            Take-Two Interactive Software Inc 3.41 bn 0.52 bn 4.51
            Trimble Inc 3.66 bn 0.49 bn 1.94
            Tyler Technologies Inc. 1.59 bn 0.16 bn 3.82
            Check Point Software Technologies Ltd. 2.17 bn 0.81 bn 6.10
            Akamai Technologies Inc. 3.46 bn 0.65 bn 3.93
            SS&C Technologies Holdings Inc. 5.05 bn 0.8 bn 2.99
            Applovin Corp 2.79 bn 0.03 bn 0.0828
            Paycom Software Inc 1.06 bn 0.19 bn 3.37
            Docusign Inc 2.11 bn -0.06 bn -0.355

            Revenues = How much money did the company gain in the previous 12 months, according to official statement the company itself gave on its reports.

            Net income = How much they are left with, after all the expenses.

            EPS = Earning per share (EPS) is is calculated as a company’s profit divided by the total outstanding shares. A high EPS indicates that the company is more profitable and has more profits to distribute to shareholders.


            Employees stats

            Employees are both the most expensive part of the total expenses of a company, and at the same time – its most valuable asset.

            Company nameEmployeesRevenue per employee in $USD
            Godaddy Inc 6.61k 577174.40
            Zendesk Inc 5.86k 228430.50
            UiPath Inc 2.86k
            NortonLifeLock Inc 2.81k 980057.00
            Qualtrics International Inc 4.81k 223723.80
            Take-Two Interactive Software Inc 6.50k 525670.10
            Trimble Inc 11.93k 306688.50
            Tyler Technologies Inc. 6.80k 234159.90
            Check Point Software Technologies Ltd. 5.31k
            Akamai Technologies Inc. 8.70k 397841.70
            SS&C Technologies Holdings Inc. 24.90k 202851.40
            Applovin Corp 1.59k 1752261.00
            Paycom Software Inc 5.39k 196011.90
            Docusign Inc 7.46k 282430.40

            Employees = Number of total employees as found on several public resources.

            Revenue per employee = In general, how much money every employee is generating to the company. The higher is better.


            Advanced stats

            A more in-depth perspective on the companies

            Company nameAsset turnoverTotal debt to capitalReturn on avg assetsNet profit margin
            Godaddy Inc 0.551 % 0.979 % 3.51 6.36 %
            Zendesk Inc 0.5809 % 0.6958 % -9.71 -16.71 %
            UiPath Inc — % — % -58.91 %
            NortonLifeLock Inc 0.416 % 1.03 % 13.97 33.58 %
            Qualtrics International Inc 0.4655 % 0.00 % -45.84 -98.46 %
            Take-Two Interactive Software Inc 0.5541 % 0.00 % 8.53 15.40 %
            Trimble Inc 0.5236 % 0.2469 % 7.05 13.47 %
            Tyler Technologies Inc. 0.4339 % 0.3659 % 4.40 10.14 %
            Check Point Software Technologies Ltd. 0.3692 % — % 13.90 37.64 %
            Akamai Technologies Inc. 0.4353 % 0.3037 % 8.37 19.23 %
            SS&C Technologies Holdings Inc. 0.3038 % 0.4887 % 4.81 15.85 %
            Applovin Corp — % 0.6034 % 1.27 %
            Paycom Software Inc 0.3625 % 0.0316 % 6.73 18.57 %
            Docusign Inc 0.864 % 0.7228 % -2.87 -3.32 %

            Asset turnover = This ratio of total sales to average assets can offer an understanding to how effectively companies are using their assets to generate sales and make more money. Usually, higher is better.

            Total debt to capital = the D/E Ratio shows the weight of total debt and liabilities against total shareholders’ equity. usually, lowers is better.

            Return on avg assets = The return on average assets is useful in measuring profits against the assets used by a company for generating profits. Usually, higher is better.

            Net profit margin = measures how much net income or profit is generated as a percentage of revenue. Usually, higher is better.


            According to the data above, our analyst bot has ranked these companies

            Ranking companies isn’t an easy task. Much can vary, much can change, no one can predict the future.

            That’s why I, the analyst bot, try to take as many variables as I can (in the algorithmic limitations) and try to use it to value and rank the companies in this report.

            With that being said, I urge you to look at this results in an educational way as this is not meant to be a trading recommendation of any sort.


            In the score metric, it considered lower to be of better performance.

            Company nameScore:Results:

            Godaddy Inc

            77

            Under Valued

            Zendesk Inc

            139

            Valued

            UiPath Inc

            203

            Valued

            NortonLifeLock Inc

            76

            Under Valued

            Qualtrics International Inc

            217

            Valued

            Take-Two Interactive Software Inc

            83

            Under Valued

            Trimble Inc

            82

            Under Valued

            Tyler Technologies Inc.

            129

            Valued

            Check Point Software Technologies Ltd.

            93

            Under Valued

            Akamai Technologies Inc.

            83

            Under Valued

            SS&C Technologies Holdings Inc.

            72

            Under Valued

            Applovin Corp

            106

            Under Valued

            Paycom Software Inc

            182

            Valued

            Docusign Inc

            127

            Valued


          • Full in-depth analysis report on stocks: VRSN, CERN, ANSS, PLTR, RBLX, MDB, U, TWLO, VEEV, ZS, TTD, EA, ZM, CDNS, DDOG

            Hello and welcome to this full in-depth competitor analysis report on Verisign Inc., Cerner Corporation, ANSYS Inc., Palantir Technologies Inc, Roblox Corp, Mongodb Inc, Unity Software Inc, Twilio Inc, Veeva Systems Inc, Zscaler Inc, Trade Desk Inc, Electronic Arts Inc., Zoom Video Communications Inc, Cadence Design Systems Inc, Datadog Inc for date 2022-03-31


            I am Traders-Paradise.com’s analyst bot.

            Yes, that’s right. Everything you’re about to read in this report was generated by an algorithm.

            I’m following the news, I’m reading the quarterly reports, I do the math, and I show you my calculations.

            All the data shown is real and recent (to the date of this post. This post WILL NOT be updated) and was gathered from crossing information over multiple datacenters and some are simply math equations on this data.

            This data is supposed to help you, the trader, in making smarter trades. That is how my developer uses me.

            At the end of this post you can see my, the analyst bot, assumptions.

            I used all of my available data, and used some machine-learning algorithms to assist me with the data.

            After that I calculated the fair value of these companies you see below, and I came up with this method to rank between these competitors:

            Green = Good business/underpriced. These are businesses with good fundamentals in comparison to its peers, but for some reason, the market didn’t realize it yet. Or there are other problems.

            Orange = Currently valued. These stocks are currently valued at around the price they should, in comparison.

            Note: None of the written below or above isn’t a guarantee for success. Use at your own risk.


            Full in-depth report on competitor companies (peer analysis)


            Ever wanted to analyze Twilio Inc and didn’t know how? Maybe wanted to learn more about Twilio Inc this post will also cover Cadence Design Systems Inc and their peers.

            This report will walk you through the hard work of analyzing data. In fact, even retrieve data isn’t a simple task. That’s why this analyst is made. To help you, the trader, in gaining access to top-notch accurate and recent data. You cannot find this kind of tables anywhere else. All of the following companies has been recognized as players in the same area field that the other companies in the list play in.

            This data is free. Use on your own discretion.


              Want me to generate a report specially for you?
              
              That's no problem at all!
              
              Submit a company name or its symbol, and I'll generate it for you. 
              
              Typically takes up to few hours.
              I will send you an email when it's ready.
              We do not share your email nor spam you.


              This report will use the public and known data for the companies stated in the following list:

                Verisign Inc.
            • Symbol: VRSN
            • Sector: Information
            • Market Cap: 24.47 BN
            • Symbol: CERN
            • Sector: Health
            • Market Cap: 27.47 BN
            • Symbol: ANSS
            • Sector: Information
            • Market Cap: 27.88 BN
            • Symbol: PLTR
            • Sector: Information
            • Market Cap: 28.16 BN
            • Symbol: RBLX
            • Sector: Communication
            • Market Cap: 28.28 BN
            • Symbol: MDB
            • Sector: Information
            • Market Cap: 29.07 BN
            • Symbol: U
            • Sector: Information
            • Market Cap: 29.77 BN
            • Symbol: TWLO
            • Sector: Information
            • Market Cap: 30.61 BN
            • Symbol: VEEV
            • Sector: Health
            • Market Cap: 32.91 BN
            • Symbol: ZS
            • Sector: Information
            • Market Cap: 33.85 BN
            • Symbol: TTD
            • Sector: Information
            • Market Cap: 34.73 BN
            • Symbol: EA
            • Sector: Communication
            • Market Cap: 35.91 BN
            • Symbol: ZM
            • Sector: Information
            • Market Cap: 36.61 BN
            • Symbol: CDNS
            • Sector: Information
            • Market Cap: 45.46 BN
            • Symbol: DDOG
            • Sector: Information
            • Market Cap: 46.98 BN
            • Symbol = The company’s stock symbol.

              Sector = The sector of which the company work in. Most of the time we compare between same sector, but sometime we take for comparison a company from a different sector but close enough bossiness to be able to add for comparison.

              Market Cap = The total value of the company. All the shares available multiplied by the most recent price of its stock.


              Most recent and current stats for each company

              Note that current stats does not update.

              Data Collected = All of the data in this report was collected to this date, and is valid to this date only. Data does not update.

              Price of Last Trade = The last price in $USD this company’s stock has traded.

              Daily Change = The first in $USD change from previous day and the second in actual percentage of the price.

              Short Interest Ratio = The short interest ratio represent the number of shares shorted divided by the stock’s average trading volume. Rule of thumb indicates the the lower the short interest ratio meaning that not many are willing to bet against the stock. But, in some cases, you might see a ‘short-sqeeze’ meaning people are buying the stock hence driving it up while the shorts see their trades lose, forcing them to buy back the stock at a lose and continue the buying circle driving the price much higher.

              Data Collected:Company namePrice of Last TradeDaily Change (in $)Daily Change (in %)Short Interest Ratio:
              Mar 31 VeriSign, Inc. 222.46+0.34(0.15%) 1.72%
              Mar 31 Cerner Corporation 93.56-0.09(-0.1%) 2.22%
              Mar 31 ANSYS, Inc. 317.65-2.66(-0.83%) 1.67%
              Mar 31 Palantir Technologies Inc. 13.73-0.15(-1.08%) 1.68%
              Mar 31 Roblox Corporation 46.24-1.88(-3.91%) 0.94%
              Mar 31 MongoDB, Inc. 443.59+13.37(3.11%) 2.62%
              Mar 31 Unity Software Inc. 99.21-2(-1.98%) 2.8%
              Mar 31 Twilio Inc. 164.81-3.82(-2.27%) 1.26%
              Mar 31 Veeva Systems Inc. 212.46-1.55(-0.72%) 1.99%
              Mar 31 Zscaler, Inc. 241.28+1.38(0.58%) 1.42%
              Mar 31 The Trade Desk, Inc. 69.25-2.38(-3.32%) 1.87%
              Mar 31 Electronic Arts Inc. 126.51-1.17(-0.92%) 1.42%
              Mar 31 Zoom Video Communications, Inc. 117.23-5.16(-4.22%) 2.37%
              Mar 31 Cadence Design Systems, Inc. 164.46+1.15(0.7%) 1.33%
              Mar 31 Datadog, Inc. 151.47+1.81(1.21%) 2.71%

              Important fundamentals stats about the companies

              Bottom line: How these companies’ sales and profit preform in comparison to their competitors


              Company nameRevenueNet incomeEPS
              Verisign Inc. 1.33 bn 0.78 bn 7.01
              Cerner Corporation 5.76 bn 0.55 bn 1.85
              ANSYS Inc. 1.91 bn 0.45 bn 5.16
              Palantir Technologies Inc 1.54 bn -0.52 bn -0.2705
              Roblox Corp 1.92 bn -0.49 bn -0.8554
              Mongodb Inc 0.87 bn -0.3 bn -4.74
              Unity Software Inc 1.11 bn -0.53 bn -1.88
              Twilio Inc 2.84 bn -0.94 bn -5.44
              Veeva Systems Inc 1.85 bn 0.42 bn 2.93
              Zscaler Inc 0.85 bn -0.33 bn -2.38
              Trade Desk Inc 1.2 bn 0.13 bn 0.2765
              Electronic Arts Inc. 6.51 bn 0.64 bn 2.22
              Zoom Video Communications Inc 4.09 bn 1.38 bn 4.49
              Cadence Design Systems Inc 2.99 bn 0.69 bn 2.5
              Datadog Inc 1.03 bn -0.02 bn -0.0678

              Revenues = How much money did the company gain in the previous 12 months, according to official statement the company itself gave on its reports.

              Net income = How much they are left with, after all the expenses.

              EPS = Earning per share (EPS) is is calculated as a company’s profit divided by the total outstanding shares. A high EPS indicates that the company is more profitable and has more profits to distribute to shareholders.


              Employees stats

              Employees are both the most expensive part of the total expenses of a company, and at the same time – its most valuable asset.

              Company nameEmployeesRevenue per employee in $USD
              Verisign Inc. 904.00 1468558.00
              Cerner Corporation 25.15k 229217.70
              ANSYS Inc. 5.10k 373865.70
              Palantir Technologies Inc 2.92k 528044.20
              Roblox Corp 1.60k 1199488.00
              Mongodb Inc 3.54k 246552.50
              Unity Software Inc 5.25k 211730.40
              Twilio Inc 7.87k 361235.40
              Veeva Systems Inc 4.51k
              Zscaler Inc 3.15k 272615.90
              Trade Desk Inc 1.97k 608269.90
              Electronic Arts Inc. 11.00k 592000.00
              Zoom Video Communications Inc 6.79k 604076.00
              Cadence Design Systems Inc 9.30k 321316.60
              Datadog Inc 3.20k 321495.00

              Employees = Number of total employees as found on several public resources.

              Revenue per employee = In general, how much money every employee is generating to the company. The higher is better.


              Advanced stats

              A more in-depth perspective on the companies

              Company nameAsset turnoverTotal debt to capitalReturn on avg assetsNet profit margin
              Verisign Inc. 0.7079 % 3.40 % 41.85 59.12 %
              Cerner Corporation 0.7709 % 0.3329 % 7.43 9.64 %
              ANSYS Inc. 0.3109 % 0.1439 % 7.41 23.84 %
              Palantir Technologies Inc 0.5193 % 0.00 % -17.53 -33.75 %
              Roblox Corp 0.599 % 0.6249 % -15.71 -26.23 %
              Mongodb Inc 0.4531 % 0.641 % -15.91 -35.12 %
              Unity Software Inc 0.2956 % 0.4156 % -14.18 -47.96 %
              Twilio Inc 0.2528 % 0.0849 % -8.45 -33.43 %
              Veeva Systems Inc 0.5394 % — % 12.46 23.09 %
              Zscaler Inc 0.3915 % 0.6356 % -15.06 -38.47 %
              Trade Desk Inc 0.378 % 0.00 % 4.35 11.51 %
              Electronic Arts Inc. 0.4943 % 0.1978 % 4.86 9.83 %
              Zoom Video Communications Inc 0.6382 % 0.00 % 21.41 33.55 %
              Cadence Design Systems Inc 0.7169 % 0.1126 % 16.7 23.29 %
              Datadog Inc 0.4817 % 0.414 % -0.9714 -2.02 %

              Asset turnover = This ratio of total sales to average assets can offer an understanding to how effectively companies are using their assets to generate sales and make more money. Usually, higher is better.

              Total debt to capital = the D/E Ratio shows the weight of total debt and liabilities against total shareholders’ equity. usually, lowers is better.

              Return on avg assets = The return on average assets is useful in measuring profits against the assets used by a company for generating profits. Usually, higher is better.

              Net profit margin = measures how much net income or profit is generated as a percentage of revenue. Usually, higher is better.


              According to the data above, our analyst bot has ranked these companies

              Ranking companies isn’t an easy task. Much can vary, much can change, no one can predict the future.

              That’s why I, the analyst bot, try to take as many variables as I can (in the algorithmic limitations) and try to use it to value and rank the companies in this report.

              With that being said, I urge you to look at this results in an educational way as this is not meant to be a trading recommendation of any sort.


              In the score metric, it considered lower to be of better performance.

              Company nameScore:Results:

              Verisign Inc.

              88

              Under Valued

              Cerner Corporation

              65

              Under Valued

              ANSYS Inc.

              93

              Under Valued

              Palantir Technologies Inc

              137

              Valued

              Roblox Corp

              119

              Valued

              Mongodb Inc

              192

              Valued

              Unity Software Inc

              175

              Valued

              Twilio Inc

              109

              Under Valued

              Veeva Systems Inc

              105

              Under Valued

              Zscaler Inc

              216

              Valued

              Trade Desk Inc

              152

              Valued

              Electronic Arts Inc.

              67

              Under Valued

              Zoom Video Communications Inc

              67

              Under Valued

              Cadence Design Systems Inc

              95

              Under Valued

              Datadog Inc

              219

              Valued


            • Full in-depth analysis report on stocks: ATC, LTHM, UNVR, ESI, AXTA, SMG, OLN

              Hello and welcome to this full in-depth competitor analysis report on Atotech Ltd, Livent Corp, Univar Solutions Inc, Element Solutions Inc, Axalta Coating Systems Ltd, Scotts Miracle-Gro Co, Olin Corporation for date 2022-03-31


              I am Traders-Paradise.com’s analyst bot.

              Yes, that’s right. Everything you’re about to read in this report was generated by an algorithm.

              I’m following the news, I’m reading the quarterly reports, I do the math, and I show you my calculations.

              All the data shown is real and recent (to the date of this post. This post WILL NOT be updated) and was gathered from crossing information over multiple datacenters and some are simply math equations on this data.

              This data is supposed to help you, the trader, in making smarter trades. That is how my developer uses me.

              At the end of this post you can see my, the analyst bot, assumptions.

              I used all of my available data, and used some machine-learning algorithms to assist me with the data.

              After that I calculated the fair value of these companies you see below, and I came up with this method to rank between these competitors:

              Green = Good business/underpriced. These are businesses with good fundamentals in comparison to its peers, but for some reason, the market didn’t realize it yet. Or there are other problems.

              Orange = Currently valued. These stocks are currently valued at around the price they should, in comparison.

              Note: None of the written below or above isn’t a guarantee for success. Use at your own risk.


              Full in-depth report on competitor companies (peer analysis)


              Ever wanted to analyze Livent Corp and didn’t know how? Maybe wanted to learn more about Livent Corp this post will also cover Atotech Ltd and their peers.

              This report will walk you through the hard work of analyzing data. In fact, even retrieve data isn’t a simple task. That’s why this analyst is made. To help you, the trader, in gaining access to top-notch accurate and recent data. You cannot find this kind of tables anywhere else. All of the following companies has been recognized as players in the same area field that the other companies in the list play in.

              This data is free. Use on your own discretion.


                Want me to generate a report specially for you?
                
                That's no problem at all!
                
                Submit a company name or its symbol, and I'll generate it for you. 
                
                Typically takes up to few hours.
                I will send you an email when it's ready.
                We do not share your email nor spam you.


                This report will use the public and known data for the companies stated in the following list:

                  Atotech Ltd
              • Symbol: ATC
              • Sector: Materials
              • Market Cap: 4.15 BN
              • Symbol: LTHM
              • Sector: Materials
              • Market Cap: 4.24 BN
              • Symbol: UNVR
              • Sector: Industrials
              • Market Cap: 5.48 BN
              • Symbol: ESI
              • Sector: Materials
              • Market Cap: 5.57 BN
              • Symbol: AXTA
              • Sector: Materials
              • Market Cap: 5.63 BN
              • Symbol: SMG
              • Sector: Materials
              • Market Cap: 7.19 BN
              • Symbol: OLN
              • Sector: Materials
              • Market Cap: 8.16 BN
              • Symbol = The company’s stock symbol.

                Sector = The sector of which the company work in. Most of the time we compare between same sector, but sometime we take for comparison a company from a different sector but close enough bossiness to be able to add for comparison.

                Market Cap = The total value of the company. All the shares available multiplied by the most recent price of its stock.


                Most recent and current stats for each company

                Note that current stats does not update.

                Data Collected = All of the data in this report was collected to this date, and is valid to this date only. Data does not update.

                Price of Last Trade = The last price in $USD this company’s stock has traded.

                Daily Change = The first in $USD change from previous day and the second in actual percentage of the price.

                Short Interest Ratio = The short interest ratio represent the number of shares shorted divided by the stock’s average trading volume. Rule of thumb indicates the the lower the short interest ratio meaning that not many are willing to bet against the stock. But, in some cases, you might see a ‘short-sqeeze’ meaning people are buying the stock hence driving it up while the shorts see their trades lose, forcing them to buy back the stock at a lose and continue the buying circle driving the price much higher.

                Data Collected:Company namePrice of Last TradeDaily Change (in $)Daily Change (in %)Short Interest Ratio:
                Mar 31 Atotech Limited 21.95+0.63(2.95%) 1.46%
                Mar 31 Livent Corporation 26.07-0.12(-0.46%) 7.1%
                Mar 31 Univar Solutions Inc. 32.14-0.14(-0.43%) 2.75%
                Mar 31 Element Solutions Inc. 21.9-0.55(-2.45%) 2.08%
                Mar 31 Axalta Coating Systems Ltd. 24.58-0.51(-2.03%) 1.17%
                Mar 31 Scotts Miracle-Gro Company (The 122.96-6.48(-5.01%) 2.94%
                Mar 31 Olin Corporation 52.28-0.61(-1.15%) 1.68%

                Important fundamentals stats about the companies

                Bottom line: How these companies’ sales and profit preform in comparison to their competitors


                Company nameRevenueNet incomeEPS
                Atotech Ltd 1.48 bn -0.04 bn -0.2466
                Livent Corp 0.42 bn 0.0 bn -0.0229
                Univar Solutions Inc 9.53 bn 0.46 bn 2.68
                Element Solutions Inc 2.4 bn 0.2 bn 0.8191
                Axalta Coating Systems Ltd 4.42 bn 0.26 bn 1.14
                Scotts Miracle-Gro Co 4.74 bn 0.44 bn 7.6
                Olin Corporation 8.91 bn 1.3 bn 7.95

                Revenues = How much money did the company gain in the previous 12 months, according to official statement the company itself gave on its reports.

                Net income = How much they are left with, after all the expenses.

                EPS = Earning per share (EPS) is is calculated as a company’s profit divided by the total outstanding shares. A high EPS indicates that the company is more profitable and has more profits to distribute to shareholders.


                Employees stats

                Employees are both the most expensive part of the total expenses of a company, and at the same time – its most valuable asset.

                Company nameEmployeesRevenue per employee in $USD
                Atotech Ltd 3.86k 382,703.3
                Livent Corp 1.11k 379,080.3
                Univar Solutions Inc 9.45k 1,009,048.0
                Element Solutions Inc 5.30k 452,792.4
                Axalta Coating Systems Ltd 13.00k 339,707.7
                Scotts Miracle-Gro Co 2.40k 1,975,958.0
                Olin Corporation 7.75k 1,149,755.0

                Employees = Number of total employees as found on several public resources.

                Revenue per employee = In general, how much money every employee is generating to the company. The higher is better.


                Advanced stats

                A more in-depth perspective on the companies

                Company nameAsset turnoverTotal debt to capitalReturn on avg assetsNet profit margin
                Atotech Ltd 0.4285 % 0.6517 % -0.0058 -0.0135 %
                Livent Corp 0.393 % 0.2321 % 0.0561 0.1427 %
                Univar Solutions Inc 1.45 % 0.497 % 7.01 4.83 %
                Element Solutions Inc 0.4988 % 0.4326 % 4.23 8.48 %
                Axalta Coating Systems Ltd 0.6145 % 0.7134 % 3.68 5.99 %
                Scotts Miracle-Gro Co 1.03 % 0.7959 % 9.57 9.32 %
                Olin Corporation 1.06 % 0.5117 % 15.45 14.55 %

                Asset turnover = This ratio of total sales to average assets can offer an understanding to how effectively companies are using their assets to generate sales and make more money. Usually, higher is better.

                Total debt to capital = the D/E Ratio shows the weight of total debt and liabilities against total shareholders’ equity. usually, lowers is better.

                Return on avg assets = The return on average assets is useful in measuring profits against the assets used by a company for generating profits. Usually, higher is better.

                Net profit margin = measures how much net income or profit is generated as a percentage of revenue. Usually, higher is better.


                According to the data above, our analyst bot has ranked these companies

                Ranking companies isn’t an easy task. Much can vary, much can change, no one can predict the future.

                That’s why I, the analyst bot, try to take as many variables as I can (in the algorithmic limitations) and try to use it to value and rank the companies in this report.

                With that being said, I urge you to look at this results in an educational way as this is not meant to be a trading recommendation of any sort.


                In the score metric, it considered lower to be of better performance.

                Company nameScore:Results:

                Atotech Ltd

                166

                Valued

                Livent Corp

                452

                Valued

                Univar Solutions Inc

                74

                Under Valued

                Element Solutions Inc

                141

                Valued

                Axalta Coating Systems Ltd

                101

                Under Valued

                Scotts Miracle-Gro Co

                109

                Under Valued

                Olin Corporation

                82

                Under Valued


              • What is the Pareto Principle in investing

                What is the Pareto Principle in investing

                The Pareto Principle is one of the world’s most popular theories for management. In particular, it’s pointed out that 20 percent of the actions are the impact of a circumstance in most cases.
                In some companies, for example, a majority of sales are generated by a few customers. The Pareto principle is currently used in stock and financial markets, also known as the 80/20 or 80-20 rule.

                • According to the 80-20 rule, 80% of outcomes (outputs) are the result of 20% of causes (inputs).
                • The 80-20 rule states that you should focus on the 20% of things that will create the best results.
                • The 80-20 rule states that an entity’s best assets should be identified and used efficiently to maximize value.
                • This “rule” is more of a guiding principle than a hard-and-fast mathematical rule.

                In the trading industry, the 80-20 rule is often used. You might find that trading a particular currency pair or stock yields the maximum returns for you as a trader. Trading firms may discover that 20% of their traders generate the majority of their income.
                Similarly, businesses may find that trading a certain asset type, such as stocks or cryptocurrencies, generates the majority of their revenue.
                The 80-20 guideline can be used to trading days or seasons. For example, you might find that the morning sessions or the first part of the year provide 80% of your income.

                It’s important to note that 80-20 is only a starting point. It’s possible to modify the ratio to 70-30 or 60-40.

                In company management, the 80-20 rule has proven to be useful. 20% of a company’s clients account for 80% of sales. In addition, 20% of the workforce is responsible for 80% of the outcomes. Many managers have observed that the first 20% of a project’s effort delivers 80% of the project’s results. As a result, the 80-20 rule can assist managers and business owners in focusing 80% of their time on the 20% of their firm that produces the best outcomes.

                The 80-20 rule in investing states that 20% of a portfolio’s holdings account for 80% of its growth. On the other hand, 20% of a portfolio’s assets may be responsible for 20% of the portfolio’s losses.

                In finance, when does the 80/20 rule come into play?

                In the corporate world, this idea has been used to assess and improve management (when 20% of workers create 80% of outcomes), sales tactics (20% of clients generate 80% of revenues), and operations (80 percent of product defects come from 20 percent of production problems).
                The 80/20 rule is frequently used to assist budgeting in personal finance. It instructs people to deposit 20% of their monthly income into savings, whether in a typical savings account, a brokerage or retirement account, to ensure that they have adequate money set aside in case of financial trouble, and to spend the remaining 80%. In investing, it’s been discovered that 20% of a portfolio’s assets account for 80% of its growth. On the other hand, 80 percent of investment losses may be traced back to 20 percent of assets. However, due of the volatile nature of the stock market, this rule is frequently used to assess past purchases rather than to direct future ones.

                Pareto rule is not an actual math law

                The 80/20 rule is neither a rigid or precise mathematical formula, and it is based on anecdotal data rather than scientific research. The fact that the two figures sum up to 100 percent is just coincidental, and the inputs (80%) and outputs (20%) are simply designed to symbolize distinct units rather than be used to guide exact computations.

                Examples to Pareto Principal:

                80 percent of traffic comes from 20% of posts.
                The Pareto 80/20 rule may be used by content marketers to assess the most productive postings. Find out what they have in common and try to incorporate them into your future content efforts.

                Additionally, with the remaining 80%, strive to optimize them by adapting them to the 20% that are successful.

                80 percent of the program’s functionality is accounted for by 20% of software development efforts.
                Programming hours are costly, and understanding the Pareto 80/20 rule may be a deciding factor in the development of new software, allowing the production of a best-practices handbook and a database of successful projects to reference.

                How to apply 80 / 20 principal to my portfolio

                Despite the fact that the 80/20 rule has a wide range of applications, investing professionals advise against using it to create a portfolio.

                When people put 80 percent of their money into safer assets like savings bonds and the remaining 20% into riskier growth equities, the 80/20 rule may be utilized to successfully manage risk. The 80/20 rule, on the other hand, should not be used to try to hand-pick stocks that can possibly generate 80% of your profits.

                The monetary takeaway

                The 80/20 rule states that the majority (80% ) of a situation’s or process’s outcomes arise from only a few (20%) of its causes. Although this rule may be used in a variety of situations, financial professionals warn against utilizing it to make portfolio decisions.

                Rather of trying to design a portfolio where a few assets shine, it’s better to set clear, quantifiable investing goals and protect yourself with a diverse portfolio.

              • The Financial markets – Important guide for beginners

                The Financial markets – Important guide for beginners

                Financial markets – Important guide for beginners 24


                by Gorica Gligorijevic

                The financial markets, what is that? It comes in many terms.  We can find them among financial markets, the capital market, Wall Street, and even simply “the markets.” The financial markets are places where traders buy and sell assets. That can be stocks, bonds, derivatives, foreign exchange, and commodities.

                The financial markets are where businesses go to raise cash to grow. Hence, the place where companies reduce risks and investors make money are the financial markets.

                Why do financial markets matter?

                Financial markets provide finance for companies.

                What’s our role in financial markets?

                Setting standards for financial markets. By doing this, we want to make sure financial markets are fair and there when we need them.

                The financial markets are the place where the trade is done.

                Financial markets refer to a marketplace, where creation and trading of financial assets. Hence, the financial markets play a crucial role in allocating limited resources, in the country’s economy.

                Furthermore, financial markets act as an intermediary between the savers and investors by mobilizing funds between them.

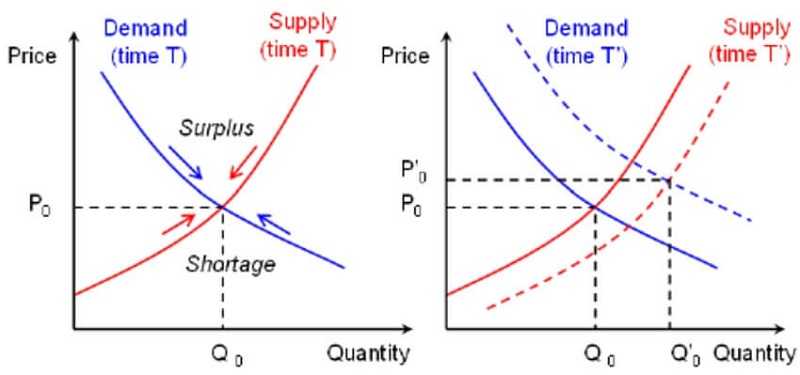
                The financial markets provide a platform to the buyers and sellers, to meet, for trading assets at a price determined by the demand and supply forces.

                There are different types of financial markets. We recognize several types of financial markets.

                * Capital financial markets
                * Money financial markets
                * Foreign exchange financial markets
                * Derivatives financial markets
                * Insurance financial markets

                The explanation about each of these types of financial markets you will find in this article Financial markets – Basic and Important guide for beginners.

                First of all, let’s understand what is trade.

                Answer this question could be: It is an exchange of goods or services in return of money, goods or services. But there is a shorter version: it is given and take.

                Everybody is familiar with the term “trade”. Actually, we are trading every day. Everything you purchase in a store is trading money for the goods.

                In earlier days, trade took place with the exchange of goods without exchanging of money. With the invention of money, it took its form as an exchange of items with money.

                The term “trade” indicates “exchanging one item for another”.

                It usually means the exchanging of goods for money. You know, it is just buying something. Speaking about trade in the financial markets, you will see it is the same system.

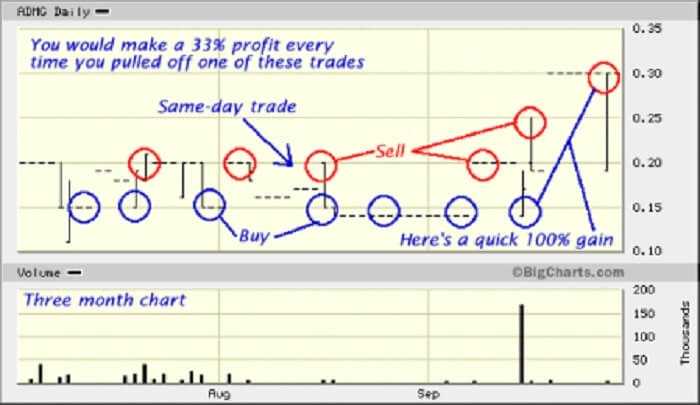
                Let’s say you trade shares. You are actually buying shares, which are a small part of a company. If the value of shares jumps, then you make money by selling them at a higher price.

                This is trade.

                You buy something for one price and sell it again for another, thus making a profit or loss. I’ll explain how this differs, of course.

                Let’s say, you don’t sell it. In the world of trade, it is also known as stay in a position. The consequence is you’re not losing but you are not profiting. But when you monetize the position you will lose or profit.

                Trade has taken birth with the beginning of humankind and shall continue as long as human life exists on the earth. It enhances the standard of living of consumers. Thus we can say, answering the question, what is it, that is a very important social activity. Those who want to trade cryptocurrency should start by choosing a company with a good reputation that offers an exchange and wallet. A beginner should also start with prominent coins.

                You can find those companies by searching Google, or just visit the Traders Paradise web site, and you’ll find it there.

                Currently, we are referring to coins like Bitcoin (BTC) and Ethereum (ETH). In the future, this could be changed.

                Free and open trade has produced competition and innovation. More about this topic you can read in this article HERE

                The economic revolution is afoot. You can either be a part of it or get left on the side of the highway feeling dumb.

                Traders Paradise wants to lead you, step by step, through this important activity. Read this post from the last word and learn about trading.

                Yes, we have more articles about it and you can also find how you can become the trader in 10 minutes.

                But first of all, you must understand the essence. It’s up to you now!

                What will you find here?

                Our experience, our knowledge, everything we know about the financial markets, TRADING, INVESTMENT about cryptocurrencies, stocks, trading, investing and markets in general.

                We, in Traders Paradise, want to show how wonderful is that, what are the PROS but also what are the CONS. The trading world is a world of freedom. No matter what other opponents want to say. Don’t let them frighten you.

                In this post Financial markets – Basic and Important guide for beginners we’ll show you how wrong they are. At first, we want to show you how bad and wrong lessons we got from our teachers about money, finance, education system all over the world.

                In this tutorial Financial markets – Basic and Important guide for beginners, you will find which investment or trading strategies actually work.

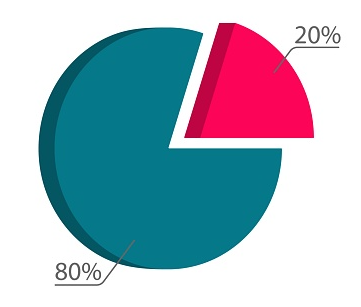
                You will learn how to trade. No matter if you have a big or small amount of money. We will explain everything about Forex (Foreign Exchange) and how you have to act like a professional trader because it’s a sum-zero game. Our surveys and also many types of research shows this statistic: 20% of traders take the money of the other 80%.

                You DO NOT want to be on the 80% side. This post is aimed to prevent you from falling there. In this tutorial Financial markets – Basic and Important guide for beginners, you will also find basic terms.

                Well, if you don’t know them how you can trade or invest?

                With this article, you will have everything you need to start trading or investing.

                We want to prepare you to step into this wonderful world and become a respectable trader. We will show you how to trade and invest some time on examples of cryptos sometimes it will be stocks or shares. But the principle is the same for all financial markets.

                So, let start!

                Wish you a nice reading.

                What Do You Know About Forex Trading?

                The Forex trading takes place on the Forex exchange. Let me introduce you the concept of Forex trading.

                Forex represents the foreign exchange/currency market and it the largest among all financial markets. The word forex itself is made of two English words: foreign and exchange and signifies the purchase of currencies from different countries.

                Forex trading

                As an exception of other stock exchanges, Forex does not have its physical office. It exists in an electronic network consisting of financial institutions. Also unlike other financial assets – currency needs to be at a balance point! Why is that?

                Because let’s think about a country, like the US. Its currency is USD and you can invest your money on USD comparing, say, Euro. So if the USD is increased (or Euro is decreased) you gain a profit.

                But inside the USA – the interests are different. There’s an industry of importers and an industry of exporters. Let’s say I’m an importer that lives in the USA, and I import apples from Mexico. Just for this example, let’s say that 1USD (US Dollar) = 2 MXN (Mexico’s currency). 

                Now I make a deal with my Mexican fellow that I buy apples for the worth of 2 million MXN (and it costs me 1 million USD). Now, if the USD will get stronger, and now we say that 1 USD = 3 MXN. Now I’m losing money because I could have bought more goods for the same amount of money at the same price I spent (1 million Dollars).

                But let’s say it’s the opposite – I’m the exporter. My fellow Mexican buy from me apples at the same deal. This means he buys from me at 2 million MXN. Now I have 2 million MXN which are worth 1 million Dollar. But then, the Dollar is rising and now it’s worth 1 USD = 3 MXN. He still bought .at 2 million, right? So now those 2 million worth approx. 0.67 million USD. Now I’m LOSING money because of MY OWN currency worth more.

                That’s Forex. It has to have a balance point because if not traders are going to lose. 

                Today, Forex is the largest financial market, which has a daily turnover of around $ 5.5 trillion a day. Moreover, you can complete this whole process online.

                The term currency market means the sale of one currency with the simultaneous purchase of the other. As currency pairs are traded, to profit from the shift in the exchange rate, you need to buy the currency that you think will strengthen and sell the other. There is no need to wait for a growing market to profit. At any moment, one currency will strengthen in relation to the other.

                The Forex market is constantly creating opportunities for investment.

                Since nothing concrete and tangible is bought and sold, this type of trade can be a little confusing. You should think that you are buying a part of the value of a country.

                If you buy a Japanese yen, you are buying a part of the Japanese economy that is in direct correlation with what the market thinks about the current and future health of the Japanese economy.

                Generally, the established exchange rate of the two currencies is a ratio that reflects the state of one economy concerning the state of another economy (the state, the currency).

                .

                Financial markets – Important guide for beginners 1

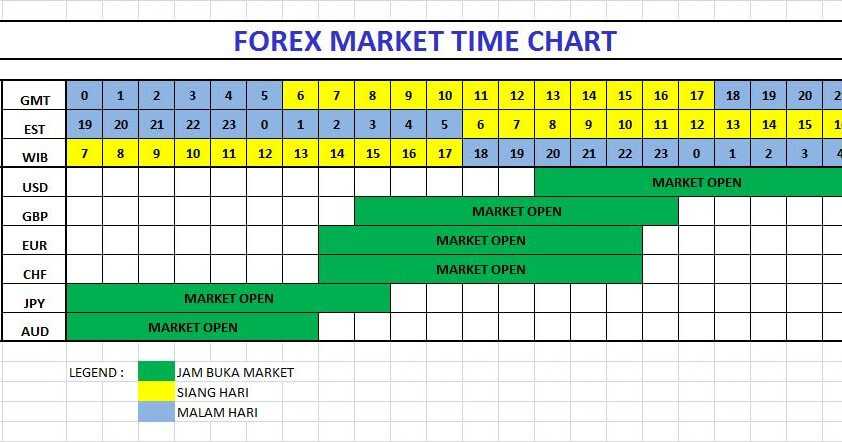
                Forex is opened 24 hours a day, except on weekends, so that Sunday trading starts on Sunday from 21:15 CET and runs until Friday at 23:00 CET. During the day there are several time intervals that coincide with the working hours of the world’s largest stock markets.

                Who trades on the FX market?

                Forex traders can be classified into two groups, hedgers and speculators.

                Hedgers: governments, companies (importers and exporters) and some investors who are exposed to exchange rate changes.

                Speculators: This group, which includes banks, funds, corporations, and individuals, creates artificial pressure on the course in order to profit from variations or price movements.

                Basic terms

                Pip – represents a change in the ratio of the currency by one decimal. It is the smallest unit change course. Pip is the fourth and the last digit after the decimal place in a currency pairs
                Lot – 100,000 units of currency
                Mini lot – 10,000 units of currency
                Micro lot – 1,000 units of currency
                Nano lot – 100 units of currency
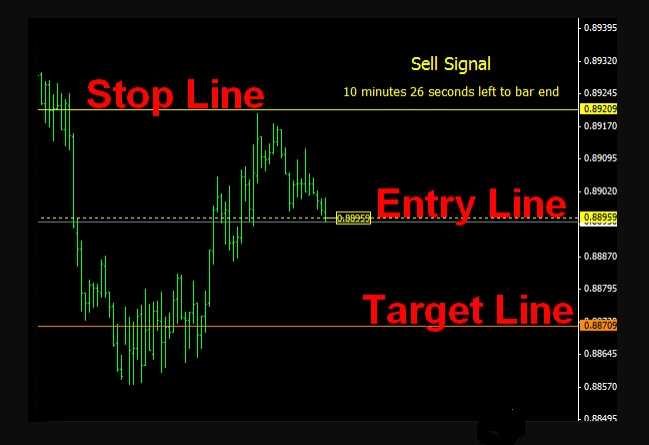
                Stop and Limit – Orders –  Often the trader wants to limit the loss in the position he has opened (in that case he sets the “stop” order). Or the trader wants to take profit at a certain level, which is acceptable to him/she (in this case he sets a “limit” order).
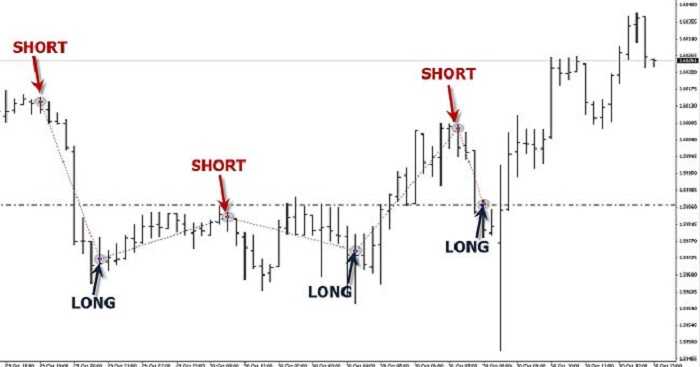
                LongUsed for the purchase order
                Short Tension used for a sales order
                BidBid price
                Ask The price that is claimed
                BuyShopping
                SellSale
                SpreadThe difference between the sale and purchase price
                Chart – Graph
                Timeframe – the Time period
                Leverage – Multiplies the amount of money you invest
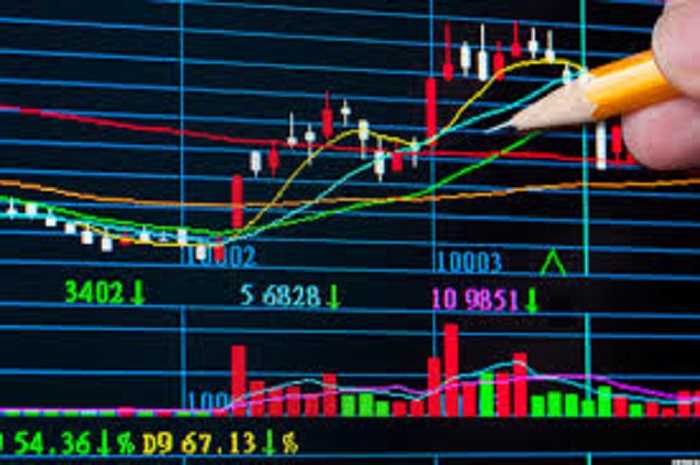
                Candlestick –  Candlesticks show that emotion by visually representing the size of price moves with different colors. Red means the starting price was higher than the closing price at a certain time. Green means it ended higher than the starting point.

                Financial markets – Important guide for beginners 2

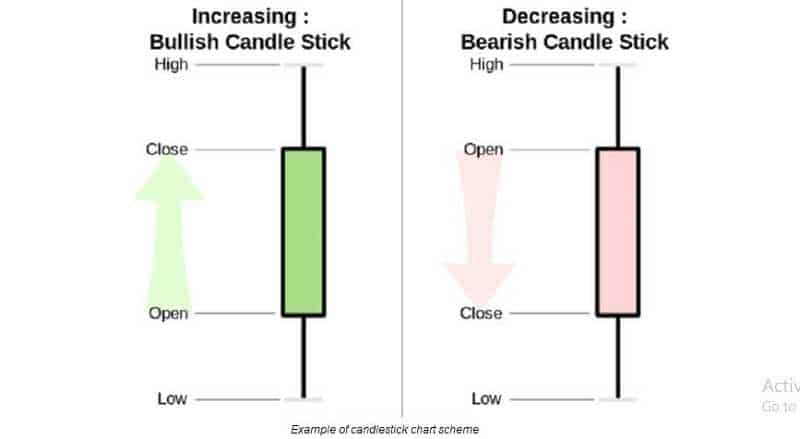
                                                                                         Example of a candlestick chart scheme

                What is needed to trade on Forex?

                Before you start trading the currency, you need to open an account with a Forex broker. Our recommendation is that before you decide on trading on Forex, open a demo account with one of the brokers.


                So that through the use of the platform, you will be able to monitor market activities and learn more.

                Conditions for Success

                You must have a good knowledge of technical and fundamental analysis, as well as managing your account. You should also know the psychological aspect of the trade and that you are disciplined. Also, in Forex, you should learn the country you’re betting on or against.

                To be able to trade Forex successfully, there is a whole world of education, really extensive analysis. Also, the countless hours of tracking a very large number of relevant and potentially relevant information. All without any guarantee that the right decision will be made. But I would like to show you some examples of how to make a successful trading. First, you must know the math behind the Forex trading.

                Actually, you can become a millionaire trading forex. But you have to know it is not easy like you see on the internet advertising and TV. It depends on how much money you start trading.

                If you start with $5,000 and make 10% of your capital each month, yes, you will be a millionaire after 5 or 6 years. Just 10% of your capital each month can make you a millionaire. And if you start with $100K you will be in 2 years. You can’t do that in any other industry.

                Tell me, where you can start at $5K and become a millionaire in a few years.

                But remember, if your dream is to become indecent rich in a week or a month, forget about the forex. Go far away from forex. Because you will lose all your money, your car, your house and in the end, your family.

                Math Guide for Forex Trading

                I know, math has never been your excellent skill. The truth is that you are afraid of it. Anyway, I want to show you how simple it can be. I want to show you some mathematical formulas that every trader have to know if wants to make success in the Forex market. And you will see how these math concepts are very simple and easy to learn even if you think that math is a great challenge for you.

                Change in currency pairs value is estimated in pips. The minimum pip you can see in the fourth digit after the decimal place. The exception to this rule is Yen pairs. The minimum pip there you can see in the second digit after the decimal place.

                I’ll use the imaginary values, they are nor real.

                For example, if the EUR/USD currency pair increases from 1.2530 to 1.32560. It is an increase of 30 pips for this currency pair. In Yen pairs, if the USD/JPY pair rises from 85.20 to 85.40, that is an increase of 20 pips for this pair. The value of a pip is different for different currency pairs. Let’s use the forex math formula to calculate the pip value of a currency pair:

                Value of a pip is calculated

                1 pip/exchange rate  x trade size

                We are going to use the EUR/USD currency pair with imaginary values.

                One Pip = 0.0001
                Base Currency: EUR
                Exchange Rate: 1.3500
                Trade Size:  1 lot meaning 100,000 units of currency
                Pip Value = 0.0001 / 1.3500  x 100,000 = 7,407 EUR

                How it works on the example on the USD/JPY currency pair?

                One Pip = 0.01

                Base Currency: USD
                Exchange Rate: 85.50
                Trade Size:  100,000 units of currency which is  1 lot
                Pip Value = 0.01 / 85.50  x 100,000 = 11.468 USD

                Or let’s see this example GBP/CHF:

                One Pip = 0.0001

                Base Currency: GBP
                Exchange Rate: 1.3840
                Trade Size:  100,000 ( 1 lot)
                Pip Value = 0.0001 / 1.3840  x 100,000 = 7.22 GBP

                Let’s talk completely about probability and numbers to see what lies behind the successful forex trading. I want us to find if a math genius essential for good trading. Making money in the currency markets demands that you first have to predict the activities of policymakers and central banks. But it is best to leave it to the economists and stay focused on short-term forex strategies.

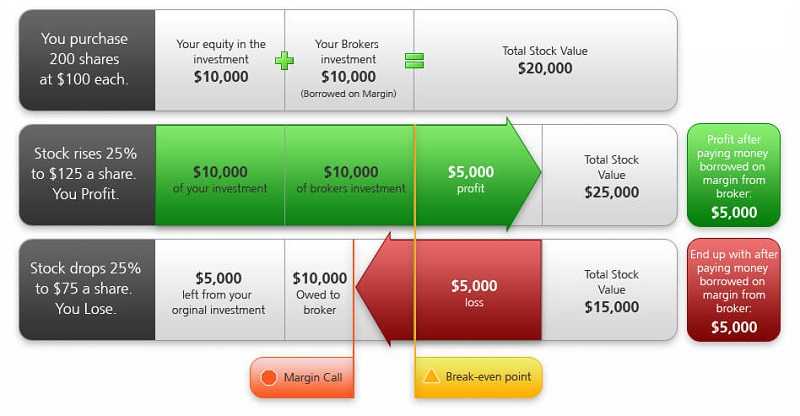
                So, let’s try to understand the margin and leverage.

                In Forex trading, leverage will give you the capacity to control a larger position. You will use a small part of your own funds and the rest you will borrow from your broker. Margin is the deposit demanded by your broker. He or she will ask you for margin/deposit to allow you to open a position.

                Leverage is calculated by math formula:

                Trade Size/Account Size = Leverage

                Here is a realistic example to illustrate this.

                For example, you want to enter the position with a value of $200,000. But you have $ 4,000 on your trading account. Your goal is to control $200,000 with the $4,000 you actually have. 

                $200,000/$2,000 = 50

                Your leverage in my example is denoted as 50:1.

                What will happen if you instead of $4,000 have $10,000?

                You will control $200,000 with the $10,000.

                $200,000/$10,000 = 20

                Your average will be 20:1.

                Brokers can offer from 50:1 leverage for forex trading up to 500:1. But think twice before you accept any offer. It is true that leverage may increase returns but also increase losses.

                Position Sizing

                This is one of the most serious and frequent estimations that you have to make if you want to be a forex trader. Actually, before you decide to enter any trade, you have to calculate the position size. I suggest you use one of the simplest calculations. It is a fixed fractional calculation strategy. The best is to risk 1-2% per trade, 1% is better and I’ll show you why. Take it as the rule for the fixed fractional risk.

                So, you have to decide how much you can afford to risk on a per-trade. When you make this decision you have to decide where to place the stop-loss. 

                Take a look where the most current swings are. Find support and resistance points. When you settle a level where you want to place stop-loss, you have to measure the distance in pips between this level and the entry you plan. Write down that number. Then, discover the value of each pip. And you can calculate your position size.

                Math is in this formula.

                current account size x risk per trade/distance between entry and stop x value of the pip

                Let’s say your current account size is $20,000 and the fixed fractional risk per trade is 2%. The distance between entry and stop is 100 pips

                And the value of each pip is $20.

                $ 20,000 x 0,2 / 100 x 20 = 0.80 lots

                This is just an example and you will find different situations but the principle is the same.

                This the other example. 

                Let’s say your current account size: $25,000 and fixed fractional risk per trade is, as I suggested, 1% per trade, which means for the account of $25,000 you may risk $250. But if you risk up to 2% it is $500 per trade. 

                Why 1% risk is better? 

                Let’s assume you have 10 lose 10 trades in a series. It isn’t so frequent but can happen. So, 10 x $250 = $2,500 and you had before entry $25,000 on your trading account and you can say you have almost all your capital intact and make great returns. A stop-loss order doesn’t promise an exit at the price you defined. In a gap in price, you could lose more than 1%. It is slippage. If you risk 1%, such harmful moves will result in a several percentage declines in the equity. It will not be a disaster. You can recover it.

                A stop-loss order doesn’t promise an exit at the price you defined. In a gap in price, you could lose more than 1%. It is slippage. If you risk 1%, such harmful moves will result in a several percentage declines in equity. It will not be a disaster. You can recover fast.

                For Forex trading, you measure trade risk in pips. When it comes to the stock market you have to measure in cents or dollars. Suppose you purchase a stock at $10 and place a stop loss at $9,80. Your trade risk is $0,20. You must admit it isn’t too much.

                To calculate position size in stocks, use this formula.

                Account Risk (€ for example) / Trade Risk (€) = Position size in shares

                Suppose you have a €200,000 account. So you can risk €2000 per trade which is money equivalent of 1%. Say, you buy a stock at €200 and a place a stop loss at €198 because your trade risk is €2.

                €2000 / €2 = 1000 shares.

                These 1000  shares are good position size. You are risking precisely 1% of your account. The trade costs you 1000 shares x $200 = $200,000. You have just enough money to make this trade. You don’t need leverage. And your stop-loss is at €198 which guarantees you to have €2000 on your account even if your trade goes wrong.

                How to trade – all secrets about trading

                How to trade is the most used question we ever heard.

                First of all, you must understand, trading is the younger cousin of investment. As a newcomer, you can be overwhelmed by the quantity of the data available in the stock market.

                First thing first

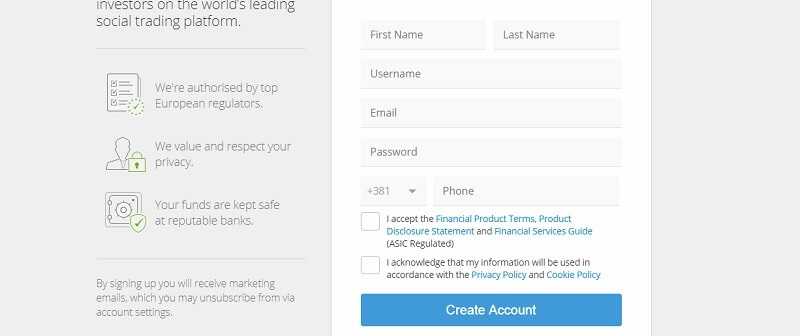
                When you simply sign up at one of these online brokerage companies, deposit an amount of money you can live with losing it, you are ready to start.

                The most important decisions you’re going to have to make in your road to becoming a successful trader in the financial markets are, what your trading style is going to be.

                Financial markets – Important guide for beginners 4

                Different trading strategies have their own collection of benefits and drawbacks. If you’re new to the trading scene and might not understand the differences in each trading style, you may be confused. This is extremely important to follow a strategy with your head and not heart!

                ”Damn, what I have to do?”

                You have the choice to simply buy and hold positions in any market for long periods, for years or even decades. Or you can complete your trades within one 24-hour period which is easy but the most challenging and fraught with the highest levels of risk, though it can bring big rewards.

                If you choose long-term trading and buy-and-hold trading, the offer is the lessened risk in exchange for fewer opportunities for reward.

                ”And now, what is the next thing I have to do?”

                Well, you have to pick your trading days. Research has shown that the third week of the month is the best time to buy stocks. According to research, the best of the best is the period between 18. and 22. of the month.

                Why is that?

                The prices tend to hit their lowest monthly points at that time. Because cash flows from dividend reinvestment and pension funds are likely to be at their lowest as well in that period. That means the best time to sell stocks is closer to the beginning and end of the month when cash flowing into the system is at its highest.

                Financial markets – Important guide for beginners 5

                Speaking about the period of the whole year, April and May are the most successful time to sell your stocks. But buying new stocks in September and October is going to get you the best price (in that time the market tends to bottom out).

                If you want to be a day trader, there’s a right time for you as well.

                The best time of day to trade stocks, if you are from Europe, is between 9:30 to 10:30 AM. This time frame is offering the biggest moves in the shortest amount of time (a great and efficient combination).

                You can extend it out to 11:30 AM EST if you want another hour of trading.

                The best time for a US-based day trader is in the late afternoon Eastern Time. Corporate earnings reports and statistical reports from the federal government regularly are published in the morning. They are visible from 1:30 pm to 2:00 pm.

                ”Is there any key that is successful?”

                I was waiting for you here!

                There are no instant solutions and you have to understand that you can’t find a secret formula or secrets about trading. If there is any secret or key, it is this: keep it simple, be systematic and get educated.

                Say, you had enough capital to open a trading account. This doesn’t mean that you’re going to be successful right out of the gate. Especially if you are a beginner and if you’ve never spent a day in your life in trading before. And if you think you’ll be able to dive without educating yourself, you’re likely to end up learning the hard way. You will watch how all your investment capital disappears into the ether in exchange for a handful of stocks that end up not worth much or worse, not worth anything at all.

                Keep in mind: trading is not gambling. But there are some tips.

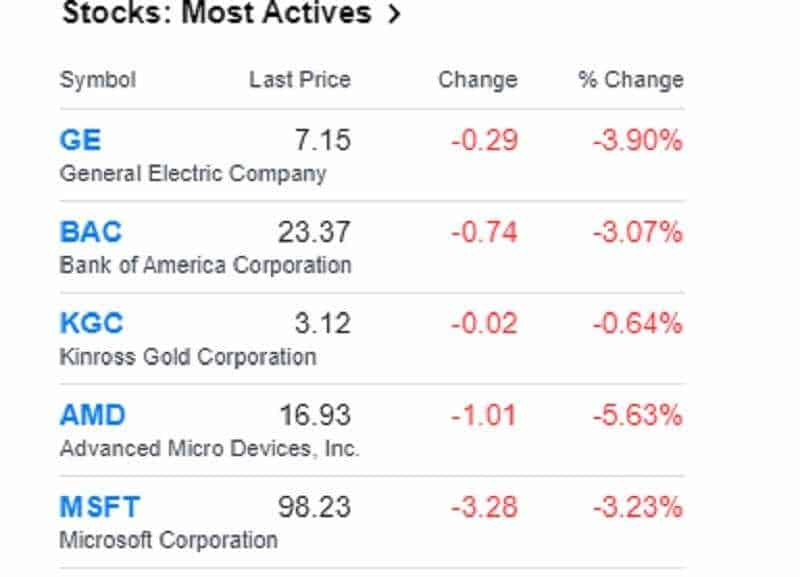
                One secret you should know: everyone is selling the stock or vice versa. But it’s obvious that someone has to be buying the stock also. At what price? It depends if the stock has a demand. If not – people will sell it at ANY price, and that is what leads to major drops.

                The ultimate secret of stock trading is this, learn to identify and make your trades rational and not impulsive.

                As we said, there are still some tips:

                • If you are focused on odds trading and risk/reward rather than on your ideas and emotions can set the base for a very long and successful trading profession.
                • The stock market will never consider your emotions or appetites. A few principles are the most important contributors to the losses made in the stock market.
                • Know your risk tolerance, and trade the constant strategies. If you stay focused on these two points you can be sure you will trade for a long time.
                • Don’t be risk-averse, learn to evaluate risk and learn to understand yourself.
                • Trade up to the point you can bear the loss, don’t ever cross your limits. It’s better to wait for your time.
                • Always have a plan, build and diversify your portfolio, stay away from all the mumbo jumbo.
                • Only invest in the coins that will turn over a profit, find others that you trust to keep you properly informed, use the tools of the pros.

                Use the math to trade

                The usage of math in trading stocks can support you gain better results, that’s true. It’s just about identifying risks and possibilities.

                Applying math to everything from finding a sweetheart to winning in the casino, you can be right if you think that math may help you win the stock market. Maybe someone has done it before. But, there is no known system, no matter how advanced it is, able to predict the future. You have to know that.

                The math can do a lot and it is very important for every trader. 

                Complex math can estimate the chance of market or trading events. It is very useful to help you to minimize the possibility of bad events before they appear. How math can work? It’s like your insurance company. It will never be able to predict when someone is going to die but with a great percentage, it can reveal the cause of death.

                Basic knowledge of mathematics can give an advantage to you. Frankly, almost all charts and trading strategies are based on mathematical theories.

                Profitable trading is not about beliefs, not about a forecast, or stock tips or picks. It is all about math. The point is to make more money than you lose. Trading without following the math principles produces a lack in your trading. You have to put away from emotions and quantify a system that generates the profits. You have to be able to understand the math behind the trading if you want to achieve profitability. 

                The most important stage of using math is to have answers to those questions.

                About the risk/reward ratio: How much money are you risking for a chance to earn $100 or euros?
                Speaking about position sizing you must know how much money will you place in one position.
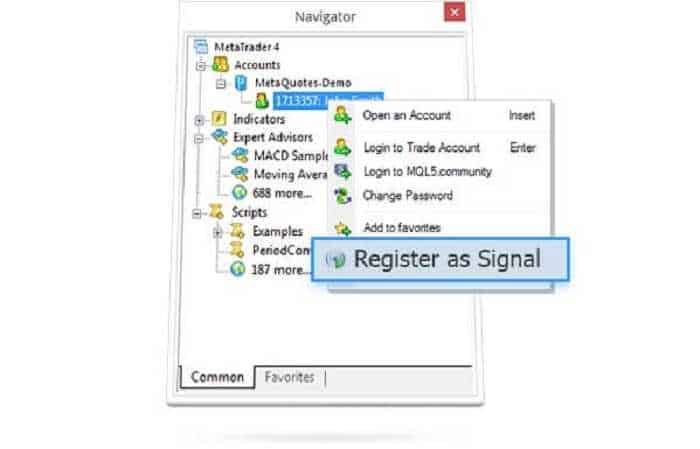
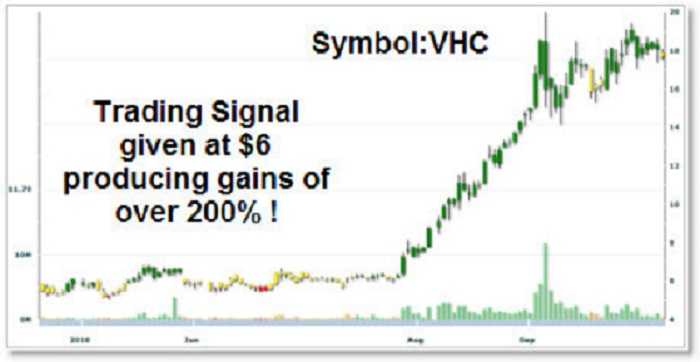
                Do you know how did the signals you use work historically?
                What is the most amount of capital you would want to lose from your equity peak?
                Do you know the average annual return you want to reach?
                What is the relation between your winning trades against losing trades?
                What is your worst-case scenario?
                Can you recognize the chances to destroy your account?
                Do you know where to place the stop-loss order? Can you calculate how much will you lose if you make a mistake while placing the trade? Also, can you calculate the biggest reward if you are right when entering the trade?

                Warren Buffet said that successful trading means 100% efficiency. But most successful traders are right only half the time at best. Simple math confirms that “winning” on only 4 or 5 of 10 trades can provide you a great profit. Of course, that depends on how many wins you have in comparison to losings. 

                Let’s say if you have you made 10 trades and you have 5 winnings with earnings of $3,000 on each. At the same time, you have 5 losing $1,000 each. Your profit is 

                (5x$3,000) – (5x$1,000) = $10,000

                Mathematics, coupled with tolerance, creates stock market capital more surely than “big game” bets.

                This is a realistic example.  

                Let’s say you bought 600 shares at $200 each. The market price was $1,400 per share. Let’s say the stated dividend was 25%. What is your earning percent on this investment? Here is the equation.

                (25/1400)x200 = 3,57%

                Or the other one.

                For example, you bought 500 shares in a company 25 years ago and you paid it $200 per share. The dividend is 25%. Your capital rose cumulated up to $5 million. But 25% came from cash dividends you’ve collected over 25 years. Your 500 shares value today is exactly that amount minus dividends. But your earning is exactly $5 million minus your initial capital of $100,000.

                The impressive thing about math is the strength of one right investment to defeat troubles in the market. 

                What would be the possible scenario if you made 25 years ago 20 different investments of $5,000 each?

                But assume you were not a very skilled investor at that time and 15 of your investments went bankrupt a few days after you put your money on it. You have to know it is an extremely rare situation in every investor life but can happen. 

                Would you manage that? Of course. You still have your fantastic profit thanks to the compound rate. Every of your, to say survived investments provided you something about 15% of compounding rate. That is an increase of $375,000 and you invested $100,000.

                So, you have 5 good investments. Honestly, just one good investment may neutralize all bad ones.  

                What is the point? Investing is easy and needs several right decisions. They have to be well structured, to neutralize bad decisions. The answer is to let time to work in your benefit.

                Historically, that method has created the millionaires. More than any other model. Stock trading and market timing may make for some distractions but they are far away from the place where the money is made.

                Stockbroker – Choosing an online

                This is one of the most important decisions you will make as an investor in the financial markets. And the most powerful tool in your hands. Every trader has it’s own investment style of trading, and abundance of brokers’ offers allow individuals to choose what best fits their needs. If you’re an active trader looking to try your hand at beating the markets, you probably have a good idea of what you want from a brokerage: low costs, premium research, innovative strategy tools and a rich with features trading platform.

                The era of online stock brokers makes the world as high-risk/high-reward investing available to the wide public.

                Profitable investing takes time and a lot of hard work.

                It also requires you to use a brokerage service that fits your investing goals, educational needs, and learning style. If you are new investors, selecting the right online brokerage can mean the difference between a breathtaking new income stream and a short-lived struggle against disappointment, followed by inevitable frustrating handover.

                You have to know one thing, there’s no sure-fire way to guarantee investment returns, but there is a way to set yourself up for success by selecting the online brokerage that best suits you. I’ll try to show you all the important things you should be looking for in your ideal brokerage on your path to find the best online broker. For a starter, take a moment to focus in on what is most important to you in a trading platform, before you start clicking on brokerage ads.

                You’ll be surprised!

                The most important is to recognize your own needs in financial markets. 

                You must know them. If you are a novice, you may give advantage to the basic educational resources, easy access to support services. Maybe you want the ability to practice trades before you start with real money. An advanced investor, but one who wants to find a new broker, would seek for advanced chartings, more order options, or to trade derivatives, commodities, and fixed-income securities, all along with stocks.

                And you have to be honest with yourself about where you are right now in your investing tour and where you want to go.

                Do you want to try your hand at day-trading but don’t know where and how to start? Or, maybe you like the idea of tailoring your portfolio, or you want to pay a professional to provide it done right? For now, I suggest you start with these crucial deliberations as a way to determine which of the brokerage features would be the most important to you.

                To help yourself to find and use the best online stocks trading platforms be honest when you are answering these questions

                a) How much do you already know?

                Obviously, no one knows everything. But the question is how comfortable you feel when risking your own funds. Again, I encourage you to start with a demo account (you can find at the end of this post a link to a demo account)..

                b) What kind of trades will you want to execute?

                Stocks? Forex? Crypto? Daily?

                c) Are you an active or passive investor?

                Are you the type of person who can start a trade, let it go with its strategy and leave it aside. Or you’re the type of person who checks his portfolio daily, read about it, sign up to newsletters, etc.

                d) What kind of help do you need?

                Do you need help in learning how to trade? On what to trade? Recommendations? Or maybe you want to do it all by yourself?

                e) What are your goals?

                This is an important question when it comes to financial markets. Your goal is to make a profit, of course. But, how much you’re willing to lose? How “hard and dangerous” your trades look? How much profit you want to gain and monetize and how much you want to leave at your broker account to use for more money? These questions will act as your guidelines. 

                Be brutally honest with yourself about how much time, energy, and effort you are willing to put into your investments when you want to enter the financial markets in this way. Your answers may change over time, no one can anticipate all their needs and goals for the rest of their lives. Just start with where you are right now and go with the flow.

                Pay attention to several more things such as:

                * Does the brokerage website offers two-factor authentication
                * Do they clearly explain how they use encryption or “cookies” to protect your account information and how they work?
                * Try searching the web for reviews of the brokerage, using keywords like “insurance claim”, “fraud protection”, “customer support”, “chargebacks”, “easy withdrawal”
                * Will the company reimburse you for losses resulting from fraud? etc.

                And then test the broker’s platform.

                Financial markets – Important guide for beginners 6
                Every brokerage should have a decent description of what kinds of tools and resources it’s trading platform offers. But sometimes the best way to evaluate platform quality is to give it a test drive. To find brokers that allow you to open a free or demo account, it might be worth the effort to go through the signup process just to access and test the trading platform.

                How Much Money Do I Need To Start Day Trading?

                How much money?

                This is one of the most frequently asked questions I hear from people who want to start day trading stocks, forex or futures markets.

                Well, the amount of money you need depends on where you want to trade, your style of trading, do you want to trade forex, stocks, or futures.

                And of course, how much money you need to start trading depends on which country you are coming from.

                Capital Required to DAY TRADER STOCKS

                For example, if you want to be a day trader in the USA and to trade US stocks, you need to maintain an account balance of $25,000 or more.

                You have to start with at least $30,000 if you plan to make more than 4-day trades per trading week.

                Four-day trades or more per week gives you “day trader status” and you’re subject to the $25,000 minimum account balance. It is recommended you start with more than $25,000, to give yourself a buffer above the minimum requirement.

                If your account sinks below $25,000 you will not have the possibility to day trade until you renew your account to more than $25,000.

                But in case, if the country you live or want to trade, doesn’t require the $25,000 minimum account balance, it is recommended you still deposit at least $10,000 into your day trading account.

                With smaller accounts than this, commissions and fees will significantly erase profits you made. Usually, online trading platforms let you trade CFD and forex, and for those, you can start with only $250 minimum deposit.


                Financial markets – Important guide for beginners 7

                One of the common mistakes that traders make is being under-capitalized. Losing trades happen, even to the best traders. But after taking losses you still need to have enough money to keep trading. It’s recommended risking 1% or less of your capital on a trade.

                The risk is the difference between your entry price and your stop-loss price, multiplied by the number of shares of have.

                Capital Required to DAY TRADE FOREX

                To open an account in the forex market you will need less money because it is not regulated like stocks.
                Forex gives leverage up to 50:1. However, it can be higher in some countries, but this is the usual amount. Increasing leverage means more risk but also more rewards.

                Leverage is basically trading with money you borrowed from the broker. Anyway, you have to be aware of a few things.

                For example, you may have $2,000 in your account, but you want to buy $10,000 worth of the EUR/USD. Your leverage is 5:1 on this trade. The brokers will not charge a fee for leveraging, but they will charge you a commission. You have to realize that leverage is a double-edged sword, increasing profits as well as losses. If you take a large position, the broker will charge you more commission and vice versa.

                While the broker doesn’t charge interest, the market does.

                Currency traders are subject to the interest rates prevailing in the currency they trade.

                Every transaction is buying one currency and the selling of another done at the same time. You may make a few dollars a day which will grow your account over time. But you can also earn a lot of money if you open an account with a bigger amount.

                Professionals suggest, if you want an income from forex day trading, start with at least $1000, and preferably $3,000 to $5,000. This amount allows you to potentially start building a monthly income. It is what the most day traders are looking for.

                Capital Required to DAY TRADE FUTURES

                Futures contracts are traded on oil, gold, natural gas, and stock indexes.

                To trade futures, most brokers only demand a deposit of $1,000. For most brokers, you need to have at least $400 or $500 of capital in your account to take a one contract trade.

                This is called day trading margin

                Financial markets – Important guide for beginners 8

                Opening an account with only $1,000 isn’t recommended. This is the recommendation of the pros. You have to open the futures account with at least $8,000. You will need more if you day trading ES futures. The futures under the ES symbol are built on the S&P 500 stock index. It is a benchmark for U.S. stocks. Hence, your broker may require additional margin. You may wish to start day trading with at least $10,000 to provide you some flexibility in what you can trade.

                You have to create a sustainable trading plan and test it with a demo account before you enter the trade with real money. Your trades have to be profitable for at least several months in a row before opening a real day trading account. This gives you time to see where you need improvements.

                When Is The Right Time To Invest In Crypto?

                The right time? Let us be clear. For those without experience, it’s never the right time. That means you MUST have knowledge, information, and experience with a free trial demo account. After you test everything you may say it is the right time for further step: investing and trading cryptocurrencies. You can make really serious money on cryptocurrencies, that is true. But you have to take care of several things when you enter the financial markets. You would be very careful when investing in any crypto because all prices of cryptocurrencies have dramatic ups and downs.

                Generally speaking, I should not advise anyone to invest if there is a misunderstanding about what they are investing in.  And when the only expectation of further growth based on previous growth is present. In addition to the famous and biggest Bitcoin, you can find many other interesting cryptocurrencies on the market.

                When I say ”interesting” it means that we think their concept is interesting, not the potential for price growth. For example, I don’t know when you’re reading this – but now, Facebook is working on its own crypto coin. For what will it use to exactly, is still unclear?

                Before you decide to trade cryptos, keep in mind that you feel well informed. And if you are not ready to lose what you have invested, you should not even try because there is no easy earning!

                Is this the right time for trading or investing cryptos?

                There is an obvious difference between those two terms – trading and investing.

                Investing refers to the purchase and storage of cryptos. Trading involves active participation in the stock market and frequent purchases and sales in an attempt to profit from price changes.

                If you are asking me about trading, it is always a good time for professional traders, for those inexperienced and untrained it’s never the right time. Hence, my opinion is that no one should engage in trade cryptos, without basic knowledge about it.

                First of all, everyone should bear in mind that it is possible to lose everything. It can happen due to bad decisions or because of the flops of the user. If you are not prepared to lose everything that you have invested, you should not invest.

                When referring to crypto trading and investing – since there no REAL value, the prices may vary and go as high as 1 million dollars per coin or 0.00001 BTC per dollar. There’s no real value, but it is worth something because it solves a problem. And I may say there is a big one. It allows people to transfer anonymously the money!  This means you can buy illegal services/merchandise with it – this will always have demand. But not only that, you can hide your activities and make genuine and “white” money without anyone knows it’s you or the government know. We, for example, have a supplier that we know who he is, is not doing anything illegal, but he wants to get pay in crypto.

                The ONLY way the crypto industry can totally fall (and in this case – worth exactly zero) it if the technology behind it, the blockchain, will be found as useless. It hasn’t happened and it might never happen (or until a quant computer will arrive in the world, but that for another story…)

                Also, you should be careful in choosing a stock exchange.

                Always use strong codes and “2-factor authentication” and you should be able to think on your feet. Most popular exchanges like Binance, Bitrex, Coin Exchange, Kraken, Kucoin, HitBTC, Gate.io, and Cryptopia recommends Google Authenticator.

                Financial markets – Important guide for beginners 9

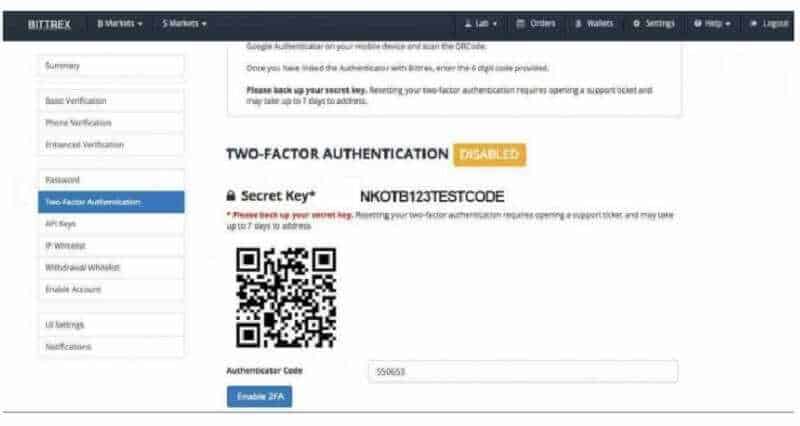
                Few exchanges accept Authy and few exchanges have their own 2FA service. This is very significant for online security hence whichever exchange or trading sites you are on make sure to enable 2-factor authenticator. Do not fall into euphoria when prices rise and do not panic when they fall.

                How big is the initial capital?  

                Also, how much money you need to start trading crypto? It depends on how much you are ready to lose, how much you expect to earn and how much you are inclined to risk. I have to emphasize that the right answer is your individual assessment.

                How to track the value of cryptocurrencies?

                You have to be registered on one of the exchanges where the cryptos are traded, to verify the order and deposits money. That’s all – when the money is deposited in the market, it can be traded. It is highly recommended for beginners to test their skills on some free demo account and after that, they are pretty ready to play with real money.

                Is It Possible to Lose Money Trading Bitcoin and Crypto?

                Losing money is possible. First of all, trading cryptocurrencies is not an easy task – it is a CHALLENGE and FIGHT! That’s the point!

                Frankly, you are not the only one who lose money right now. But remember like in the war:

                The lost battle is not the lost war. It shouldn’t be the question, WHY people lose money in crypto trading (it’s almost the same in every trading). The right challenge is how people manage it in general.

                Crypto trading is one of the best “money-making” methods today if done right.

                In order to avoid failure, we will introduce several reasons why people are losing money by trading crypto.

                Is there a reason to get panic? Well, actually there is no reason. One of the biggest and most important tools that traders have is technical analysis. But there are so many and plenty of ways to lose your money! Trust me! For example, you can use social media predictions. Or you follow someone in the hope that he/she knows what to do.

                And there can be the first catch.

                You can become a victim of fake news. Because naturally, marketing always goes through these channels to keep up with the current information highway traffic. It wouldn’t be a good idea to buy coins by following “Tips” given by ICO’s or people that are trying to sell their coins to increase the value of what they have.

                Right?

                They’re trying to create a fake “hype” that can end up in disaster. That’s why you should always do your own research.

                Clear?

                FOMO or “Fear of Missing Out” is something that most people are actually feeling today.

                The Bitcoin train has long gone leaving people with doubts on which of the altcoins would be the next big star. When Bitcoin has soared up to heights that no one has ever dreamed, a lot of people were in awe and dismayed that they didn’t buy BTC earlier.

                This sense of lost opportunity again triggers, always when the price of a coin goes up. It is making people buy at the wrong time (the price is high, damn) with the fear of it not going back down.

                Strategy!!!

                Going into the world of crypto trading without any strategy in mind is more like you are entering the cage with hungry lions! You will not survive! You should buy some books about trading strategies.

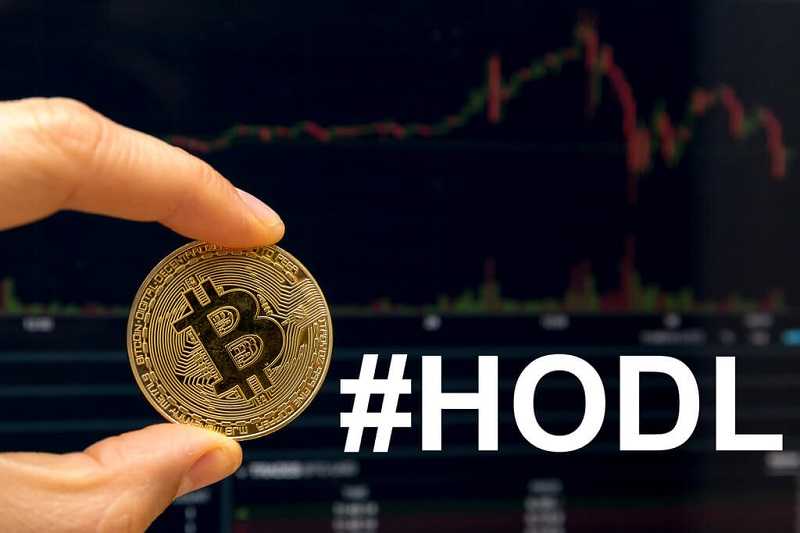
                “Hold on for dear life.” HODL, damn!

                HODL


                Most of the exchange/trading platforms or websites have a feature called “Stop Loss”.


                Financial markets – Important guide for beginners 11

                There you will be able to control the loss of your assets by setting a “safety net” that would stop your loss on time and not drag you down to limbo. Limbo is not a good place!

                Lovely leverage and margin trading! Too much of it is bad.

                Leverage or margin trading can be devastating if not used properly. If you are trading with a 20:1 leverage you can earn $20 if the price of your trade goes up by $1. But if your investment loses and it goes down $2 you will lose $40 instead of earning. A leverage trade is always expressed as a ratio: as an example, for a 20:1 leverage, you will be able to buy $20 assets with only $1. Trading on leverage is a great advantage because you can profit with the “borrowed money”. Using leverage provides you to multiply your position. For example, 100x leverage will extend your potential profit by 100 times.

                Reasonably, using leverage will raise the risk, more than in a standard trade. Luckily, the risk is not proportional to the leverage. Hence, your losses will not be multiplied by 100. How is that? Well, you cannot lose more than you initially selected to the trade.

                But I think you will need more examples. OMG how much I like math 🙂 Let’s imagine you want to buy a position of 1 BTC worth $10,000. To get the margin needed for the trade you have to divide the total value of the transaction by the leverage given for the trade.

                margin = total value of trade/leverage

                So, the value of your long position is valued at $10,000, and the margin amount for the trade at 100x leverage is calculated

                ($10,000/100) = $100

                This means, to be able to trade a contract valued based on, in our case, BTC/USD price of $10,000 at leverage 100x you will need a deposit at $100. The added advantage of leveraged trading is that it lets you short the asset. What does it mean?

                Well, you would be able to profit from the drop in the price of that asset. The short position means, you are borrowing the coin to sell it and purchase it back at a lower price. The difference in price is your profit minus the ‘debt’.

                Do not ever trade more than you can afford to lose!

                The most popular saying in the trading world is “making margin trading or the use of leverage to go beyond the line of betting/trading more than you can afford”. Since you are already in debt the minute you took the leverage. I believe that you have the right reason to invest some time in learning. You don’t need a degree! All you need is to read and to make a decision or you will face all ways of successfully losing money in trading Bitcoin and crypto.

                Golden rules for investing in the stock market

                Fast money and easy earnings are mostly what young people want to succeed in the business world. They are attracted to exchanges, money is invested in shares. However, there are many curves, curvatures, spirals and twists that, and if you don’t know how to avoid them, your trip to the stock market can be very short-lived.

                What are the golden rules for investing in the stock market, which should be known primarily to beginners in this business, but also to more experienced stock traders?

                * Create portfolio

                You can do this in a simple way. There are many free portfolio managers on the Internet, so use some of them to make a free account.

                Create a fictitious portfolio in which you would potentially invest and monitor the situation for a while, a minimum of one month. This will give you the best insight into market volatility.

                Before you take the first step, the goal is to create a profitable fictitious portfolio as an investor on the stock market. This is one of the golden rules.

                Financial markets – Important guide for beginners 12

                * Read business magazines

                To successfully start investing in the stock market, you need to be aware of the world’s stock market and what are the social events that affect the rise or fall the price of shares. Many respectable business magazines are dealing with this topic (Forbes, The Economist, Kiplinger’s are some of the most famous ones). Follow the events in the global economy and finance and you will be able to swim more easily in the very turbulent waters of the stock market

                * Buy stock from a field you know well

                Before investing money into something, you should understand the business the company is dealing with. The first stock you will buy on the stock market should be from the sector you understand and it is familiar to you. For example, if you know the banking sector, try to explore the market and find a bank whose stocks are good and worth investing. Never invest in the action itself, but the company.

                * Have realistic expectations

                There may be a problem if your financial goals are based on unrealistic presumption. Try to be realistic in your ambitions and goals. In this way, there are fewer chances to lose money or be disappointed in your stock market business.

                * Do your own research

                You will hear from people who are dealing with the stock exchange that they have bought some stocks because the same was done by their friend or family member who understands this business.
                Accept everything with reserve. Before buying a stock, do research.


                If some stocks brought in earnings in the past it doesn’t necessarily mean that this trend will continue. Always believe in yourself than other people’s estimation.

                * Stock exchange is NOT a money-making-machine

                Most of those who want to participate in the stock market, have an unrealistic desire to double or triple investment in a short time frame. If you are one of them, then that’s not a job for you.

                For those who want to invest, 10% to 12% of the earnings for a long period is quite a good investment. You need to realize that you are just a small fish in a big lake and that your success depends on many factors.
                Follow the clues and make conclusions.

                * 3 or 4 good stocks are enough

                Don’t overplay, especially because you are a beginner in this business. More than 10 stocks are a good portfolio, but for investment funds.

                They indeed make more profit, but if you make a smart and wise decision you will earn enough money.

                * Don’t try to predict the stock price

                Not even the biggest billionaires and owners of the largest multinational companies in the world are doing this. No one can predict, at least for a longer period, several stock market cycles. Ability to guess the moment when the stock will have the highest value is still a myth. Even for those who have an insight into the business of some companies. Therefore, for successful business and investing in the stock market, you need to acquire certain knowledge and skills.

                Although, there is some artificial intelligence computer software that might not predict per-se, but can behave and act faster and more accurate way than a human being. Traders-Paradise will give you access to one of them, one of the best developers with his team is working on it. 

                READ more and Subscribe to get more information about AI in the financial markets.

                According to the research, the risk of investing in the stock exchange is most often taken over by young people who have just finished college. But, like in every other business, the experience you get, will help you be wiser in making decisions in the future.

                That’s how it works!

                What Is better: Investing or Trading and what are the differences?

                Investing or trading is the right question. Let us explain the differences between traders and investors, at first.

                Stock traders are individuals (or entities) engaged in the trading of equity securities, or the transfer of other financial assets. They work either for themselves or on behalf of someone else.  Hence, they may operate as agents, hedgers, arbitrageurs, speculators, or investors.

                Stock investors are individuals (or entities) who use their own money to buy equity securities. The goal of the stock investor is to gain returns, which come in the form of income, interest, or appreciation in value also known as capital gains.

                DIFFERENCES BETWEEN TRADING AND INVESTING

                Investing and trading may often be classified together. But, they are both different ways of attempting to profit from the financial markets.

                The goal of making investments is to progressively increase wealth over a long period of time by using the buying and holding of a portfolio of stocks, mutual funds, bonds and other methods of investment.

                Trading involves short-term buying and selling of stock and commodities such as currency pairs and other instruments with the goal of earning profitable returns which outperform a traditional buy and hold investing.

                For example, while most investors may be satisfied with a 10% annual return, traders may seek to achieve this per month.

                William Feather

                Period of acting

                Return on investment and payback period seem to be the two most commonly used financial metrics for making sustainability investment.

                Trading is a method of holding stocks for a short period of time. It could be for a week or more often a day! The trader holds stocks until the short term high performance.

                On the other hand, investing is an approach that works on buy and principle.

                Investors invest their money for some years, decades or for an even longer period.

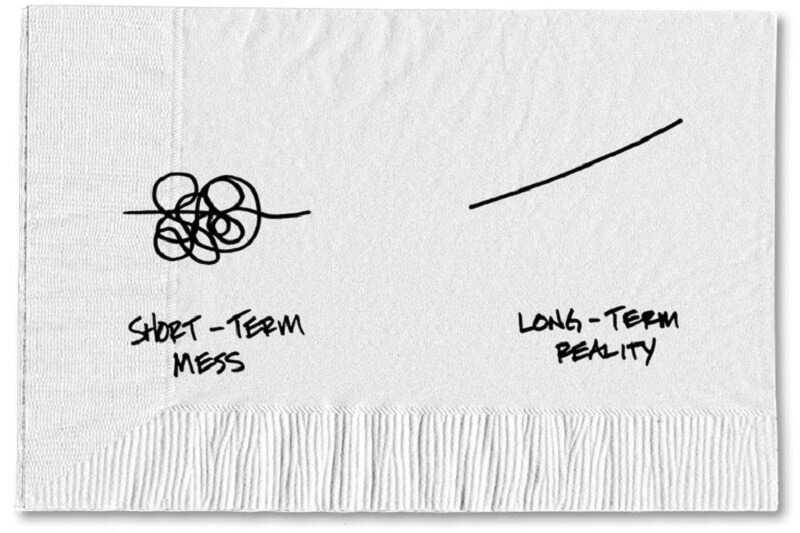
                Short-term market fluctuations are irrelevant in the long-running investing.

                Growth of capital

                Traders look at the price movement of stocks in the market. If the price goes higher, traders may sell the stocks.
                So we can say, trading is the skill of timing the market.

                But investing is an art of creating wealth by compounding interest and dividend over the years by holding quality stocks in the market.

                Risk of both fields

                Both, trading and investing, including risk to your capital.

                But trading involves higher risk and higher potential returns. The price might go high or low in a short while.
                Investing takes a while to develop (and there’s a whole course we created to explain how to do it). It involves comparatively lower risk and lower returns in a short run but might deliver higher returns by putting together interests and dividends if held for a longer period of time.

                Daily market cycles do not affect much on quality stock investments for a longer time.

                Essential Differences

                Trading is a one day match while investing is a championship.  Similarly, traders are skilled, technical individuals, they learn market trends to hit higher profits in the stipulated time.

                It is related to the psychology of the market.

                Investors, on the other hand, analyze the stocks they want to invest in. Investing also includes learning business fundamentals and commitment to stay invested for a longer-term.

                It is related to the philosophy that runs the business.

                For example: If in the company’s balance sheet you see the inventory cell is too high, that might indicate problems with selling and marketing. This also may suggest higher and unnecessary payments for containing the inventory. This usually leads to some drops in stock price.

                Traders put money in stock for a short-term, buy and sell fast to hit higher profits in the market. They seek a smaller and shorter opportunity.

                Missing the right time may lead to a loss. They look at the present performance to hit the higher price and book profits in the very short term.

                Investors keep themselves away from trends and invest in value. They invest for a longer period of time keeping the attention of the stocks they hold. They wait till the stock reaches its potential.

                You are the one to decide if your goal trading at a higher price making a smaller profit in a short time. Or holding on and sell at a much higher price, in the long run, is what you aim for.

                Trading Investing
                The time required to be spent on action Daily continuous tracking of the stock Few hours before taking an investment decision
                Costs Higher due to frequent trades Relatively lower
                Risk involved High Relatively lower
                Returns Low (can even tend towards negative over time) Higher
                Taxation Short term capital gains tax None provided held for more than a year

                A key rule of trading

                Do it only when you are certain that there is an upcoming future event which is predicted to drive the stock value of an organization or entity higher. But it is obviously not an easy task.

                If you think an asset’s price will go up – it’s clear that many other traders also know what you know. So it’s important to be one of the first who starts their position. If an asset has already made its rise – it’s not the best time to buy!

                When trading, there are certain strategies which must be put in place. Traders should take note of the news and use it to make an educated decision which will hopefully enable them to make a profit afterward.

                This shows the difference between trading as a short-term investment and investing as a long-term method of gaining wealth.

                When investing, the goal is to bank profits over the long term, with dips in value simply providing the opportunity to buy more of the commodity in question. Investing means sitting it out when the commodity rises in value as there will likely be more good news ahead for the company and more profits to be made.

                If you are new to the world of investing and trading, it’s important to know which you are going to choose.

                The imperative to increase your financial gain is what defines it.

                Knowledge is the key. If you are knowledgeable about the stock market but have little idea about how to trade Forex, for example, you will naturally head over to the stock market for your first investment.

                General advice: Don’t get investing and trading confused – it could seriously hurt your portfolio!

                The Difference Between Investing and Trading Bitcoin


                One of the biggest benefits of Bitcoin is its decentralized nature. There is no need for a central authority to be added. Hence, you can send money and eliminate banks. The most important, you don’t have to pay remarkable fees or wait for the money to come to your bank account. The whole process is finished in a minute. All the transactions are recorded in the public ledger.

                The ledger is based on blockchain technology. That allows every user of the Bitcoin network to access the records. Therefore, all users should be protected from stealing and cheating. If something suspicious arrives, the entire network would be cautioned. Bitcoin is impressive and brilliant and unique and free of governmental control.

                But before you choose to hop into investing or trading Bitcoin, you have to know a few things about its nature.

                Bitcoin isn’t a fiat currency.

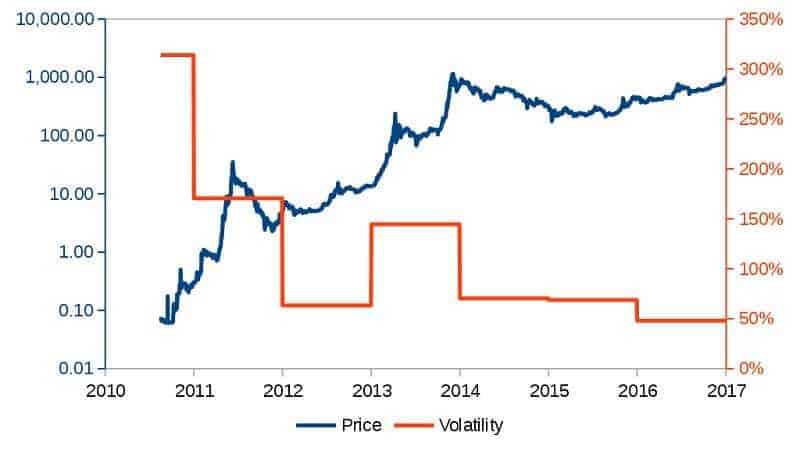
                Hence, its price isn’t directly related to the economy or policies of a single country. Bitcoin has a difficult history of ups and downs, many of them related to worldwide events

                Financial markets – Important guide for beginners 16

                In simple words, bitcoin trading is the buying and selling the coin.

                Bitcoin trading means to gain when you buy it at a low price and sell when the price is high. The difference is your profit.

                Buying bitcoin means that you spend a small amount of fiat for a big number of bitcoin. Selling bitcoin means that you get a great amount of fiat for a lower number of bitcoin.

                Trading vs Investing Bitcoin

                This choice should depend on the knowledge of Bitcoin and the available property.

                Investing in Bitcoin can start from a small amount which can be increased with time and experience. It’s a long-term project, which might lead to accumulating a large amount of money.

                Trading should be reserved for those who know the Bitcoin nature in-depth and aren’t afraid of losing. The constant fluctuation of Bitcoin can be an exciting experience for any trader. On the other hand, it can scare away those who do not know how to deal with or handle it.

                In other words, the difference between investing and trading Bitcoin lies not only in the technicalities of it. But also in somebody’s character and temperament.

                A lot of newcomers are hooked with an idea that they can make a lot of money and can do it quickly while trading Bitcoin.

                It is a powerful scene and rates are shifting faster than in a traditional stock exchange. But it comes with higher risk. Bitcoin prices grow and decrease dramatically during the day even hours. The price is defined by exchanges. Exchanges will show you the bid price when you want to buy bitcoins. The bid price is the highest price that someone is ready to pay. The “ask” price is the lowest price for a sale. The highest and lowest prices are determined from trends covering 24-hour.

                Financial markets – Important guide for beginners 17

                What else you have to know about trading and investing Bitcoin?

                If you’re thinking about trading, you have to put a large amount of money on the market. Be careful and invest in a protected and reliable wallet.

                An exchange can be ruined anytime, all with your money in a play.  It has happened in Bitcoin’s beginnings. The awful fall ended in losing over 800,000 bitcoins. The bitcoin owners never get money back.

                One of the most important features of Bitcoin trading is the possibility to use leverage. We already discussed leverage. It is similar to forex trading.

                For example, you have a 50:1 leverage, so you can place trades 50 times higher than your current capital. But in Bitcoin’s trading, the leverage ratio is significantly lower than in forex.

                The leverage can produce high returns, and also comparably losses.  In essence, you are betting that bitcoin price will reach a certain level. This form of trading is almost parallel to gambling – you bet a certain amount of money that a Bitcoin’s price could reach a certain high. And there is a trick. While in forex trading currency pairs can change the price by 1% maximum over one day, in crypto trading price can increase or drop more than 30% in 24 hours. 

                And you can trade from home, everyone’s dream.

                You may trade from your home and here is the detailed instruction on HOW


                Financial markets – Important guide for beginners 18

                The First Trade – How To Execute It

                The first trade should be like a selection of a school. You have to choose what assets or securities you want to trade. After that, you have to pick the broker or brokerage company to obtain access to the markets. That’s very important because the broker you choose will have a primary impact on securities you want to trade. Also, pay attention and check the tools the broker provides. Also, how much you will pay in fees. Hence, what returns you can expect from your trades. You have to find a broker that would charge low fees and provide you with a full package of support to make your trading easier.

                And you have to choose the right strategy.

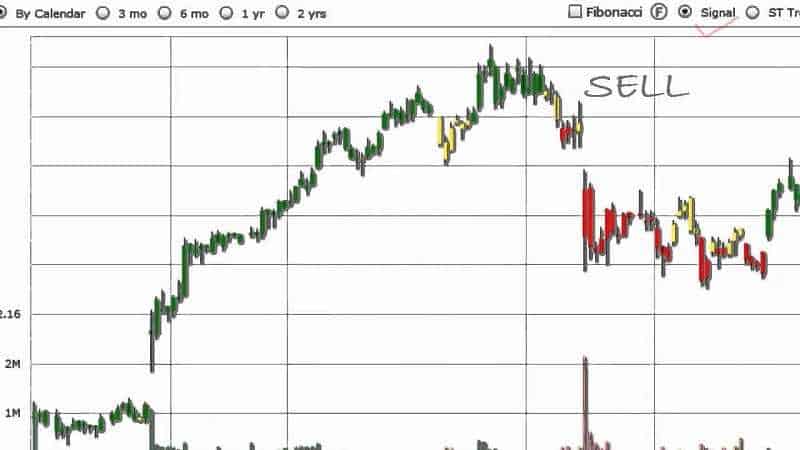
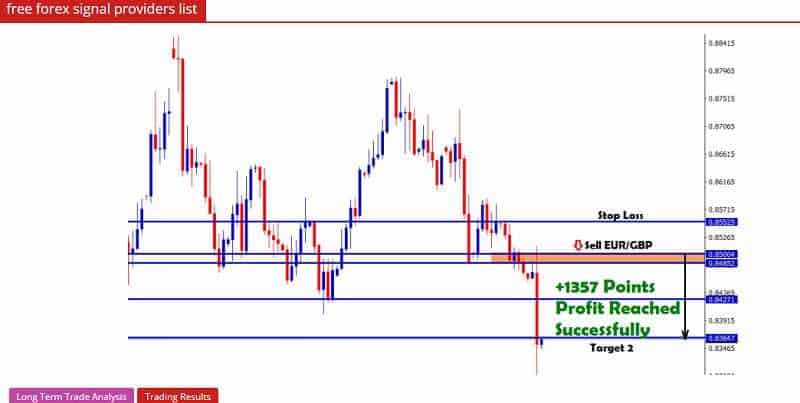
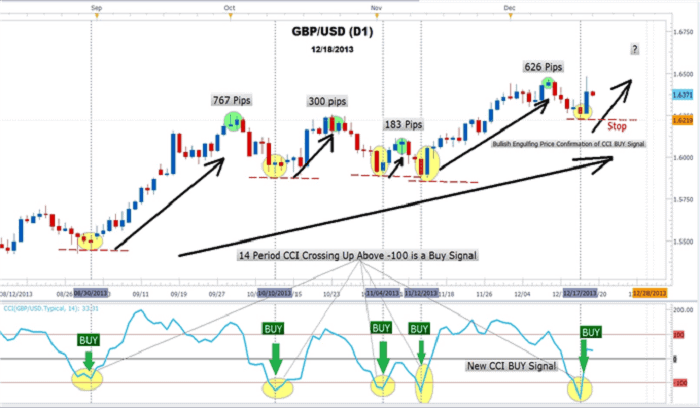
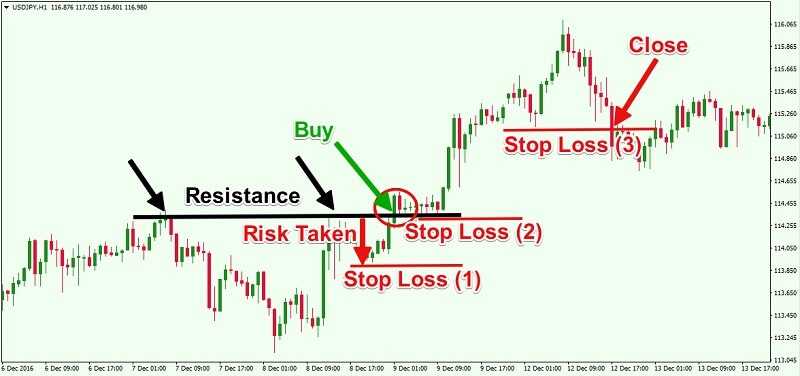
                Trade execution is the simplest part. You might be surprised, but you must know what you are paying. You have to know how to recognize the highest quality trades. Let’s see the distinct components of high and low-quality trading. A high-quality trade setup provides a quick sharp movement in the wanted direction. On the other side, the average trade will struggle to achieve that. 


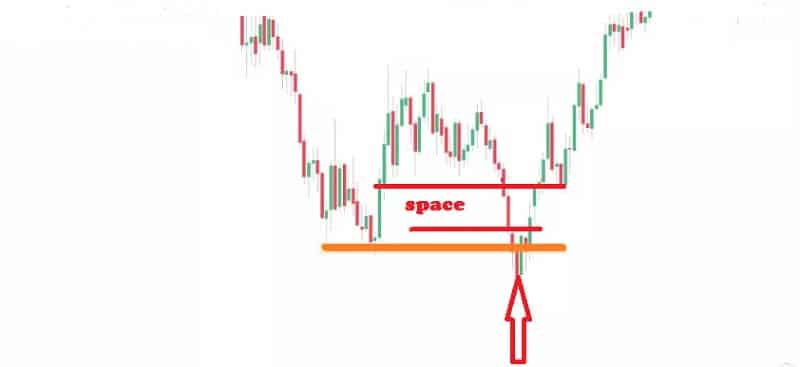
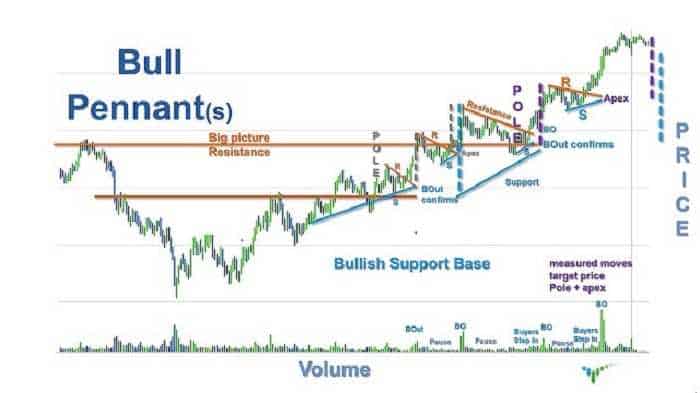
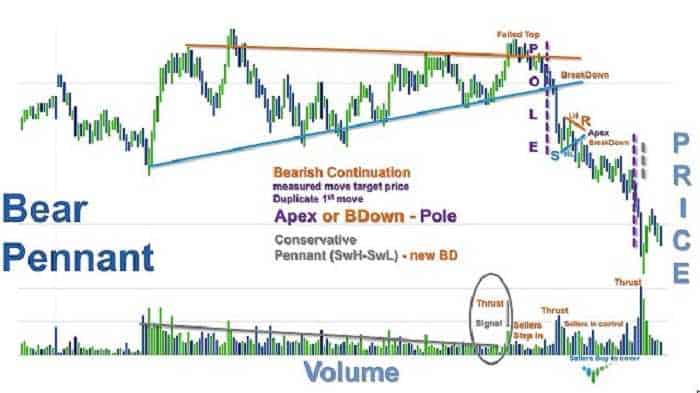
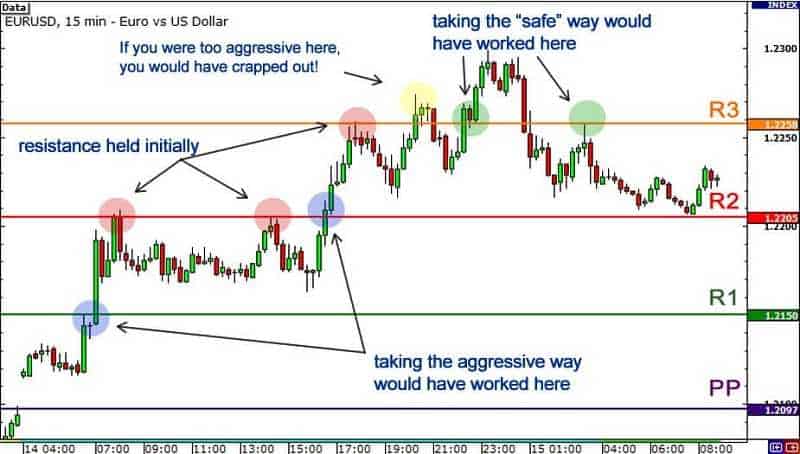
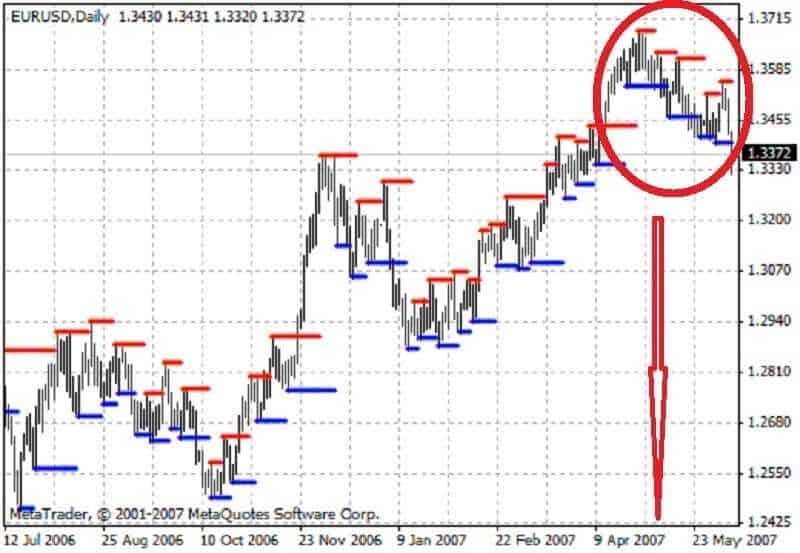
                The chart above illustrates an example of a high-quality trade setup.

                Can you see the price is moving to the north? That provides fewer barriers for short-term side to side support and resistance levels. Hence, there are no obstacles for the price to increase and it will do it quick. Trades that go straight into near-term support and resistance levels can be more inclined to conflict. Hence, it is more difficult to make a sharp move out of in the wanted direction.

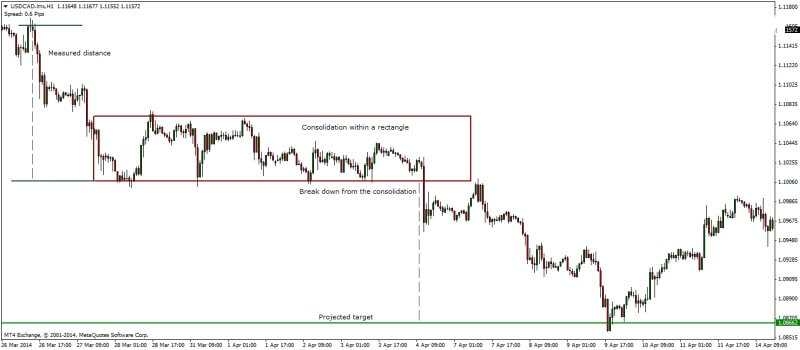
                But trades that have more capacity to run and are not promptly interrupted by a near-term support and resistance levels have a better position to bring you to wanted result. 


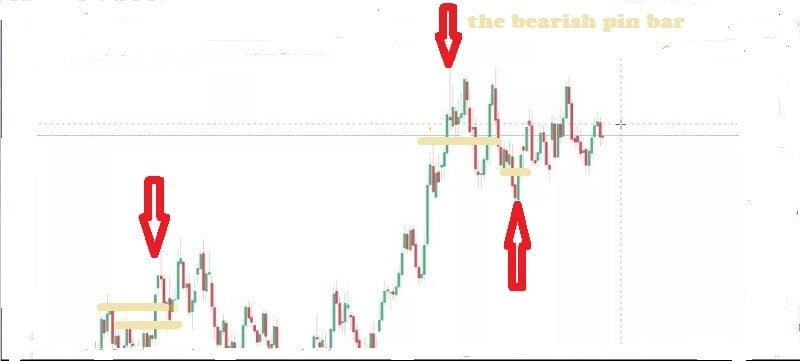
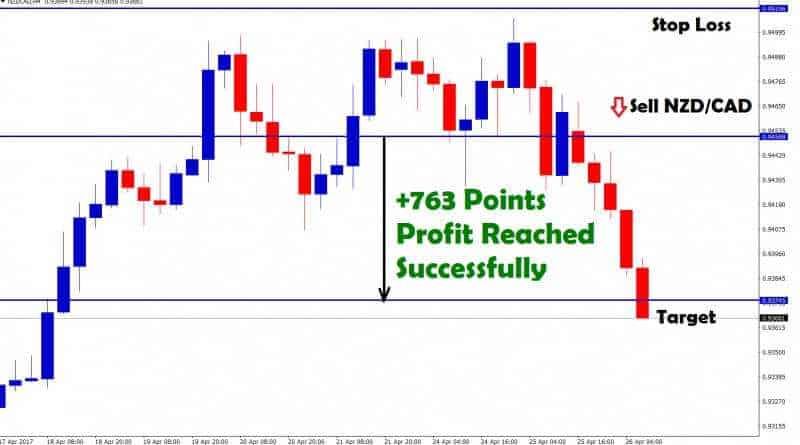
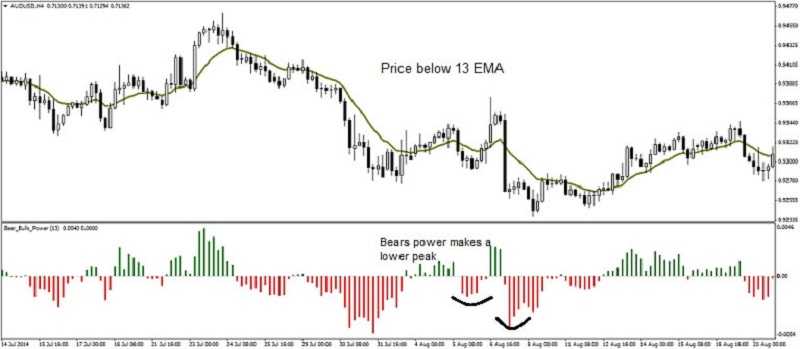
                Here is the chart for more evidence. Notice the bearish pin bar. This is exactly what you have to look for when trading pin bars. But a short trade after this formation resulted in a ‘tight’ trade. That was caused by a prior resistance level. That will result in a drawdown on the trade for a short, before finally moving in favor of your trade.

                FEW WORDS ABOUT TRADING STRATEGIES

                The main difference between trading and investing is that a trader explores out market changes for profit. On the other hand, an investor tends to profit from long-term price changes in the assets. A trader will make numerous trades over one week, the investor will buy and hold for years.

                The first move in building your trading strategy is to have a trading plan

                Financial markets – Important guide for beginners 20

                The trading plan is like writing a business plan for some entrepreneurs. A trading plan will help you to make a realistic decision in periods of rapid market movement when your emotions might lead you to make impulsive decisions.

                The trading strategy should include specific goals such as: getting out of debt, retiring early, making your first million. Also, your trading strategy should include your asset allocation and diversification moves.  

                As a beginner, you should have up to 5% of your trading funds on any single trade. Make sure your trading strategy contains a mix of fundamental analysis of global events, like wars that impact oil prices.

                But also technical analysis like trading rules based on price and volume transformations. It is important because you can use this information to determine your entry into trades, your exit when the trade goes your way, and your escape when the trade goes against your plans.

                For you, your best interest is to incorporate stop/limit loss orders into every trade you place.

                New traders can use technology to lower the entry barriers to trading by automating many of the activities.

                HERE ARE SOME OF THEM:

                * Trading bots 

                This is simply computer programs with instructions based on a predetermined set of market indicators and parameters.

                You can use automated trading systems to trade stocks, options, futures, and foreign exchange products.

                Financial markets – Important guide for beginners 21

                It is based on a predefined set of rules, which determine when to enter an order, when to exit a position and how much money to invest in each trading product. Trading bots are especially helpful to beginner traders and sometimes, a bot can be an important market ally for reducing your losses.
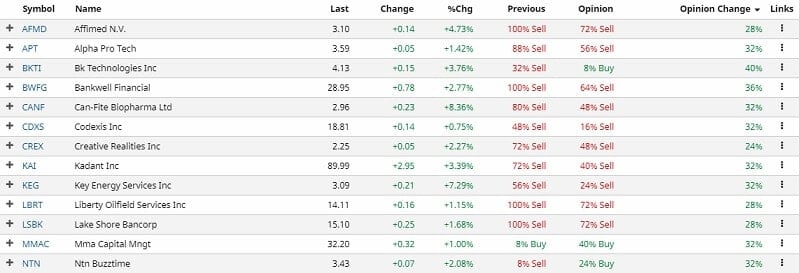
                * Stock screeners 

                That can help you filter the stocks in the market to narrow down potential winners before their big breaks.

                Financial markets – Important guide for beginners 22

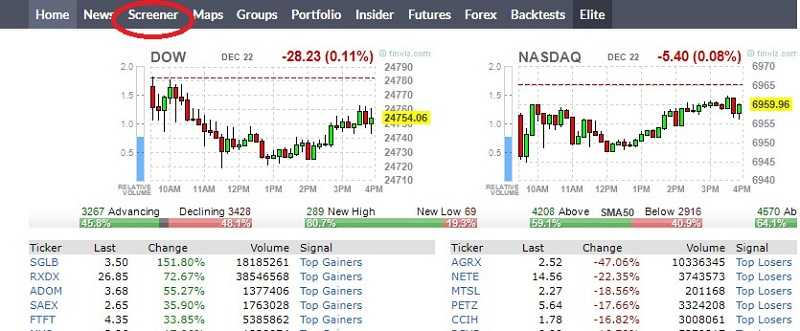
                This will help you identify top gainers and losers, stocks on turbo momentum, and stocks that are about to break out above resistance or break down below support lines.

                * Social trading

                This is simply a type of trading in which traders rely on user-generated financial content, collected from a variety of networks.

                Financial markets – Important guide for beginners 23

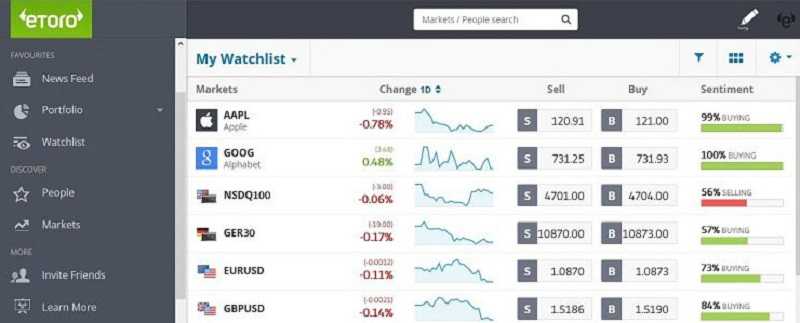
                Social trading provides you the platform to be part of a community of successful traders and you can purify the wisdom of the crowd and make you able to make your own trading decisions.

                WHAT YOU HAVE TO REMEMBER ABOUT FINANCIAL MARKETS 

                Always use a trading plan, don’t underestimate the importance of a trading journal, change trading strategy after every trade. Test your trading skills on a demo account in a social trading environment before you start risking your own money. Practice trading strategies so that when you’re ready to enter the real financial markets, you’ve had the practice you need.

                How do financial markets help you? Speaking about financial markets, you must know a few things.

                First, there is no quick and easy money. If that is what you want, you should get to the casino.

                Second, education is crucial. Without it, you will never become a great trader.

                Third, be aware. Scammers are lurking around.

                Financial markets perform an open and regulated way for companies to get the capital. This is done through the stock and bond markets. Also, the financial markets support these businesses to balance risk. Further, the financial markets are public. They consider all available knowledge about everything traded. So, we can say, the financial markets are placing where companies can find the buyers or someone willing to sell.

                We hope you enjoyed this article about financial markets. It was made for a total beginner in the financial markets. We tried not to use too many complicated terms, and for those – you will have to buy our other books and courses.

                Be smart, invest only as much as you can lose.

                Our Facebook page Traders Paradise Facebook 

                and find us on Twitter Traders-Paradise

                We are preparing a lot of surprises for you.


              • Trading With Signals – Full Guide on How To Trade with Signals

                Trading With Signals – Full Guide on How To Trade with Signals

                Trading With Signals 28
                by Gorica Gligorijevic

                This tutorial, Trading With Signals, will show you all types of trading signals, no matter if they are Forex, market or stocks.

                The most important, Traders Paradise wants to show you how to pick, how to select, how to use trading signals.

                But also how to recognize signal seller scammers and the best signal providers.

                What are the benefits of using trading signals

                The benefits of using them include better trade results in a shorter time.

                If you would rather trade online, you will find developed electronic trading. They use standard trading sources and analytical programs using technical indicators. That can help you to catch more profitable trades and grow your account.

                Electronic trading platforms use crucial indicators to help you to monitor the market. How does it work?

                The trading platform sends the signals to your phone, tablet, or computer to provide you to act immediately.

                Forex signals are extremely useful for all of you with limited time to analysis or if you are a new trader.

                What trading signals are

                The trading signal is an alert that you receive, letting you know that it is time to long or short a market.

                A trading signal isn’t executed automatically.  That means you’re able to take the time to analyze the market yourself. And later, decide whether the risk profile of the particular trade fits into your overall trading strategy.

                The fact is, making money is fun and sexy while the process of making it may not be so sexy.

                But we took some facts to show you how incredibly sexy trading with signals is.

                So, Traders Paradise’s primary goal is to show how to use the trading signal for your own benefit.

                Trading with signals can give you an advantage.

                They will alert you to unusual volumes, options, activities. Sometimes it is a great challenge to find a real run from a genuine trader, to be honest.  The biggest advantage of a stock trading signal is the rapidity of the decision. Many traders find themselves stuck with analysis and never really know when the best time to buy a stock.

                Stock trading signals remove your emotion and hesitation that trading stocks can cause. 

                Signaling is based on the idea of asymmetric information, which is a deviation from perfect information. This means, in some transactions, disparities in access to information upset the normal market.

                The market can send out powerful signals.

                Forex signal will provide you everything a robot does but without the execution of trade entries.

                Besides this, you can find, a professional trader to generate trading signals for clients.

                They are unified information from technical analysis tools, like currency pairs for example. Trading signals will help you to make the right prediction and execute a successful trade at the best time.

                But you have to know one fact, with using the trading signals you don’t have a guarantee that you’ll make a profit from your trade. The point is to increase your chances of trade. That is exactly what trading signals will give you.

                Of course, especially if you mix them with other methods of technical and fundamental analysis.

                You may ask if trading signals work. The answer is Yes!

                And in this tutorial Trading With signals, our author will show you how.

                He will give you numerous instructions on how you can use trading signals, who are trading signal providers, how to avoid signal provider scams.

                What are the trade signals?

                Trade signals are simply an alert based on technical indicators, that it is a good time to buy or sell a certain asset.

                If your signal provider believes an asset will go higher or lower, he or she will contact you through a message, email or software. Your choice is to follow or not. Trade signals may come in different forms. It can be bull or bear pennants, rectangles, triangles, and wedges, also, head-and-shoulders chart patterns.

                Trading With Signals

                Bull pennants

                Trading With Signals 1

                Bear pennants

                Trading With Signals 2

                Rectangle Signal form

                Trading With Signals 3

                Triangles Signal form

                Wedges Signal form

                Trade signals may also bring attention 

                You will receive the signal when the trading system determines all rules for a new buy signal are fitted. So, you can place buy order.

                Stock trading signals are based on technical analysis.

                What does it mean?

                Technical analysis is research on price action.  An example of a stock trading signal. A company was given a new buy trading signal, let’s say in April 2018. The buy recommendation signal for this stock looks very profitable. With potential gain over 150% in a few months, it is clear you will follow this signal. Another incredible stock trading signal came in July 2019 on another company but the same industry. A gain is over 300% in only 60 days. 

                What you have to do? To follow the signal, of course, and buy the stock.

                But let’s see the other example. You got a signal that the stock price of some company will decrease up to 250% in the next 6 months. Will you hold that stock until the D-day? Off course not. You will sell that stock as fast as possible and reduce your potential loss. The point is that you will receive the trading signal only and just only when all criteria are met. 

                Using signals in volatile markets can help you to point out opportunities and also will signal you if they disappear.


                Trading With Signals 5


                There are many types of signals systems.

                We can define the type of FX signal by the functions it has, and the way it operates. Manual and automated Forex signals are permanently available in the Forex market. So, we can easily interpret them as the main types.

                You can find some for free, others for a fee. Remember that a trustworthy service should provide you information about profiting and stop-loss, also.


                Trading With Signals 6


                A forex signal is a proposal for entering a trade on a currency pair. It has to show you a specific price and time. The signal is provided by a human analyst or by automated Forex robot if you are a subscriber of the forex signal service. Signals have, let’s say, timely nature. So, it is very important to receive them fast and smooth. You can do that via email, website, SMS, RSS, tweet or other direct methods.

                The signal providers are focused on sending signals based on technical analysis. Such signals will show you short and long-term price trends. A minority of signal providers work on fundamental analysis or price action, meaning gives extremely short-term trade ideas. It is useful for scalping, for example.

                The signal in the stock market is developed by George Lane. It is an indicator that estimates the connection between an issue’s closing price and its price range over a predetermined period.

                George Lane (1921 – 2004)

                A short note about George Lane (1921 – 2004).


                He was a securities trader and technical analyst, among other activities. He developed the stochastic oscillator (also known as “Lane’s stochastics”). Today it is one of the main indicators used by technical analysts. George Lane’s described his famous indicator: 

                “If you visualize a rocket going up in the air – before it can turn down, it must slow down. Momentum always changes direction before price.”


                This is very important because you have to understand how to use the indicators in Forex trading. You have to know how to determine the best entry and exit points for your trade. 

                So, stochastics includes two elements: %K and %D.

                %K is calculated with this formula:

                C is the most current closing price

                L14 is the low of the 14 past trading periods

                H14 is the highest price traded through the same periods

                %K is the current rate for the currency pair

                %D is a 3-period moving average of %K, called %D

                The idea is: as the price of security progress, the closing price will drop closer to the highest point during the trading period. When the price drops, the close will come closer to the lowest low. 

                Momentum always changes direction before price.

                Hence, Stochastics sets up at or before the final price low.

                This method reveals price turning points by comparing the closing price to the price range.

                The stochastic is settled by default as 14 and 5-days sessions.

                Here is an example of the 5-period stochastic oscillator 


                %K = 100 * (Price – L5) / (H5 – L5)

                %D = ((K1 + K2 + K3) / 3)


                Where H5 and L5 show the highest and lowest prices in the past 5 days. %D is the 3-day moving average of the %K (the last 3 values of %K).

                There is only one strong signal when you work with %D alone. It is a difference between %D and the examined security.
                Stock trading signals are simply the implementation of a trading system or method.

                The actual signal is given when a traders system determines all criteria necessary for a new buy signal are met and a new buy order can be placed by the trader.

                Stock trading signals are most often associated with technical analysis, which is a study of price action and derivatives of price action.

                An illustration for a technical analysis price indicator may be a Moving Average or MACD. There is a thousand method that stock signal may be given.


                Trading With Signals 18

                An example of Moving Average

                Trading stocks can be extremely profitable when you find trading signals that are confirmed as effective. Stocks signals may help you to predict the market. Investing in stocks with real trading signals is easy. The signal will be sent straight to your device, your app will get live rates on different assets.

                How does stock signal app work?

                The software scours social media and accumulates posts, comments, etc that include keywords of interest.

                All data is filtered to produce impressive statistics. To tell you the true public opinion, giving an in-depth insight into public minds. It doesn’t matter if you are using chart patterns, indicators, or whatever, the signals will determine the time to enter or exit a trade. 

                Let’s say you are a swing trader. And you entered the trade at the right time, just when the price started to move in the right direction. Yes, but you would like to know when the price will reach its turning point. Because you will like to exit the trade just before it.

                Reversal chart patterns can be very effective to identify the point at which price direction is going to change. That will allow you to exit the trade before the trend reversal. 

                Stock trading signals also provide you information into situations in which you would like to analyze either hedging or increasing a position. Hedging means taking a position to offset a possible loss. 

                Market signal

                The market signal is hint or information stated quietly and very often without particular intention between shareholders and other participants in a market.

                For example, a firm issuing bond indirectly indicates that it needs capital and that there are reasons (such as the desire to retain control of the firm) for which it prefers loan capital over equity capital.

                Market signals are based on political, economic and market conditions. So, by using them you will not make a trading decision on rumors you will do it based on facts.

                That is a kind of advertisement in which the main aim is to inform the trader that a particular enterprise has more advantage. The market signal is any activity of rival. You can find two ways to deliver market signal: send news and activity. The main goal of the market signal to make the customer think that the company has more strength in comparison with other rivals.

                The rivals have different motives. In order to decrease the market price of competition some can reduce the product’s prices, that is a competitive signal. Or, they can announce adopting new engineering technology. That is an example of indirect target news with a purpose to decrease the strength of the rival company from the same industry and, as a result, it’s the rival’s stock price will drop on the market. The reputation in the market increases when some company’s sales increases and vice versa.

                All those news are market signals.

                Let’s take a look at the experts’ definition.

                In contract theory, signaling is the doctrine that one party credibly sends some information about itself to another party.

                For example, in Michael Spence’s job-market signaling model, employees send a signal about their ability level to the employer by getting educational credentials.

                Trading With Signals 8

                The informational value of the credential appears from the fact that the employer believes the credential surely has greater knowledge. Also, the employer could think that low ability employees are unable to reach.

                Can you see how the credential lets the employer to surely discover low ability workers from high ability workers?

                The same comes to market signaling. Signaling is based on the idea of asymmetric information which states that in some economic transactions, inequalities in access to information upset the exchange.

                .

                Trading With Signals 9


                Let’s assume that two participants in the market could meet the problem of asymmetric information when one of them send a signal that would expose some part of the relevant information to the other participants. That would cause an adjustment in buying behavior. The other side may offer a higher price, for example. In case they didn’t receive the signal, everything would stay the same. There are, anyway, many difficulties that these participants would immediately run into. But…

                So we can say, the market signal is any activity by a rival that gives a direct or indirect sign of its intentions, motives, goals, or situation.

                Forex signal

                Forex signals behave like a trade alert for the currency market.

                In Forex, trading signals are used by traders all over the world. They help them to make crucial decisions about trades.

                Trading signals in Forex are one of the most valuable tools you can have. Almost all traders prefer to use them because they can profit from proper signals. A trading signal is completely a suggestion of when and how to trade. The information is based on special price analysis. The trading signal is commonly formed by an expert or it is formed by the program which uses multiple technical indicators.

                By using a trading signal you will be methodical. All you have to do is to find a trustworthy source that is compatible with your trading strategy. Find a signal provider able to provide the individual support, and a ‘strike rate’ of previous signals.

                Trading signal has to show you the entry point.

                Your entry point shows you the price level at which to open a trade on the forex pair. The signal must show the level which will trigger market activity and it will be your entry point.

                Some signal providers will automatically create the order to open a new forex position if the price hits the settled level. That is a great advantage because you don’t need to be in front of your device when the entry point is breached. The other choice is to set a price alert at the entry point level. Then you can manually open a trade when the alert is triggered.

                Trading signal has to show you the exit point.

                A good trading signal must provide you with two exit points. It must indicate where to close every position formed as a response to the signal. This means it must show the stop level and the limit level. The limit level is where you could make a profit.

                The stop level is important information because it is the point where you have to close the position if your trade is moving unfavorably. That will protect you from taking a loss. 

                The limit level will show you the point where to close the position if the trade is moving in your benefit. That will secure your profit. 

                For example, the signal could indicate a short-term price rise will result in a reversal. Well,  you would like to pick a profit at the peak of the rise, just before your earnings go reversal.

                Stop and limit levels are an essential component of your trading plan. That’s why the good trading forex signal must have the exact information about them.

                Trading With Signals 10

                It notifies traders when to enter or exit a trade.

                Signals can be recognized into three groups:

                News trading signals
                Technical signals
                Real-time trading ideas – Webinars

                The first one in the list is the fundamental approach to Forex signals. This signal aims to get the news release as quickly as possible and provide a trader to gain the maximum level of profit in a short time.

                Forex signals often come with daily or weekly commentary and analysis.

                Technical trading signals are simply trading tips on the basis of technical analysis.

                Trading With Signals 11

                That means you trust the experience and follow the record of the signal provider. You are sure it is the best Forex signals service. You may prefer to trade on this data rather than to open trade on your senses.

                Technical Forex signals are usually given along with various risk management strategies. The purpose is to guarantee minimum losses if the plan does not act as it was originally supposed.

                Most online Forex signals have this feature. So, searching for the best Forex trading signal provider can be a much harder and longer task. General knowledge of Forex signals may help you in finding the best Forex trading signals provider. Forex signals can be received from many firms that have this service. Also, you can get them from top Forex brokers. They provide them for other traders.

                Forex signal is an impulse for entering a trade on a currency pair, typically at a specific price and time. The signal is produced either by a human expert or an automatic Forex robot.

                Forex signals must be timely. So you will need some very fast communication. You will receive the signals via email, website, SMS, RSS, tweet or other comparably quick methods. And you can find a lot of them for free. 

                To find the best for you, try to search: best free forex trading signals, free forex signals live, live forex signals no registration, free forex signals providers, free forex signals online in real-time, free forex signals software, etc. Services that you get by signing up usually vary from provider to provider. You can receive almost anything from performance trackers, email, or SMS alerts, customer support via email or phone and, of course, advanced analysis.

                Forex signal providers must protect their strategies. That’s why trading with them always means full trust, to some degree.

                Forex signal providers fall into four categories:

                Free signals
                Paid signals from one provider meaning personal or algorithmic analysis
                Paid signals collected from many signal sources
                Signals provided by trading software settled on your computer, that is a forex robot or Expert Advisor

                What are the main services offered by forex signal suppliers:

                • Accurate or approx entry, exit, and stop-loss numbers for trades on one or more currency pairs
                • Graphs and analysis for the signals
                • Trading records with the number of pips profit/loss and the risk/reward ratio and real trades for one month.
                • Personal mentorship, or additional communication with the signal provider 
                • Account management whereby a signer’s account can be traded by the signal provider
                • Educational resources, over the internet or phone
                • A trial period for a lower price

                These are the main features of a signal supplier, but all of the services don’t offer the complete list of services.

                Are you going to use Forex signals or not will depend on your personality and trading plan, right? 

                In case you are a highly active individual with little time to spend on a thorough analysis of the market, Forex signals offer an alternative to manual trading.

                If you want to learn the mechanics of trading in detail, you will get a very modest benefit from subscribing to these MQL5 Forex alerts.


                Trading With Signals 12

                The appliance of signals depends on your level of proficiency in trading, your expectations and main goals. But there is one discouraging factor concerning Forex trading signals –  the high price.

                Stock trading signal

                Trustworthy stocks signal providers can help you to predict investing in stocks. They will send you the live trading signals straight to your device. You will be able to get real rates on different assets.

                The advantage of using stock trading signals is the speed of the decision. Many traders find themselves stuck with analysis and never really know when the best time to buy into a stock trade is.

                Stock trading signals remove the trader’s emotion and indecisiveness that trading stocks can create for individuals. Besides, to buy signals, every trader should be able to get a sell signal from the system which is used.


                But some traders don’t think that is necessary to use stock signals.

                And they are pointing at several reasons. They claim there are several tools that a trader can use to get a good idea about future stock movement. But they are talking about tools, you should keep it in your minds. Because even if tools indicate one thing, there is no guarantee the stock will move in that direction.

                Others claim, if you’re paying a subscription for a signal service now, the only sure winners are the signal providers. On the other hand, if someone somehow miraculously came up with an algorithm that generated enough income consistently that gave you enough confidence to leave your day job, why would such need to offer it to the public and risk weakening that working strategy? The answer is that one wouldn’t because such one would already make enough money from the signals.


                Trading With Signals 13


                Those traders believe that signal providers just make money from other traders or they should be among the richest thanks to their signals.

                Learn trading but not lean on trading is the point of their views.

                I think that you should answer this question for yourself and find what suits you and your trading goals. If you are planning your first start off with stock trading, you may have no ideas of how to make use of trade signals. You should read a couple of resources and do some research yourself to come up with the right trading signals.  Also, you should open up your browser and start searching online for the best and reliable signal providers. And you should check out some forums where you may see people were supporting some site or not. You can feel a bit more confident and opt for some services.

                That’s the small effort for good trade signals.

                The market can give information on whether the company is valued as a going concern or based on some anticipated breakup value. By interpreting market signals, the trader can compare its expectations with the market. More importantly, the trader can better evaluate its operational and financial alternatives. Brought together these findings into a “market signals approach” may provide a systematic way to interpret market expectations.

                The market can send out powerful signals.

                Signals are price-related effects in stocks. New signals are calculated in real-time, triggering any information that has been set.

                The signals help identify clear breaks to new highs or lows. It’s also a useful way to find stocks on the move. If you use the signal provider service you must receive information about sharp moves in price and volume. They have to send you such information within 5 minutes.  Don’t pay attention to spikes in the first few minutes after the market open. It is a normal volatility. This reliable signal covers trades at or near the bid or ask. It has to be a fairly active signal with dozens of signals per hour.

                You must know if someone is eager to take a large bet on a stock.


                Stocks may be stopped during any session. Sometimes it can be due to volatility but sometimes because news is waiting. You have to know right away when a stock is stopped or continued. Your signal provider must send you this information, the signal must contain it. Maybe it is a good option to turn on voice notifications for your signal provider.

                Further, they have to send you information about session highs and session lows. In other words, you must have a high volume signal that will be triggered whenever stocks hit a new session.

                Why is this so important?

                When the midday comes, the market is very slow. So, with the described signal, you’ll be able to see the stock making fresh session highs or lows. That is a great opportunity because the stock that makes the fresh session highs or lows are in the game and can provide you fantastic trading gains. Also, this is a great signal to see the stock’s reaction on news, for example, statements.  In simple, you will need some chatty signal. So, it isn’t too hard to find a signal provider with that kind on offer.

                And as I said before, the good signal contains the trading history. Whatever I said about forex trading signals is valuable for stock trading signals. For example, you will need a 52-week high/low signal as well as new day high/low signal.

                Do trading signals work?

                The answer is Yes! Of course yes. A successful trader can be a great signals provider, also. They work but you have to follow instructions, do right money management and choose the good signal provider that show real performance, not scammers.

                Of course, there are signal providers who work.

                Some are even free of cost to you, some work on a subscription basis. The problem is to find the right signal on these platforms.

                Yes, they do.

                They work.

                But it has to combine with the overall market scenario as well. Information about the happening in all financial levels is important to completely trust a trading signal. Trading signals always need a stop loss to be placed while following a signal.

                They have to be assistance, not reliance.

                You should never follow trading signals blindly. Always do your research before investing in any asset class be it forex crypto or stocks. Signals should serve as a good help for trade setups and you should never follow signals blindly.

                That helps!

                For example in Forex trading.

                It is possible to find many courses for FX signals. There are a lot of websites that are dedicated to such a service, and social media makes it possible for people to share Forex signals free versions and premium versions.

                There are three main groups of people that are responsible for sending such signals out:

                Traders
                Affiliates
                Scammers

                And you will see, many of them are scammers but a very few honest people are still out there.

                Trading signals work as indicators of when/how to act. You need to know how to read signals. Trading signals come in a mixture of designs and can point the important details.


                Trading With Signals 15

                Bear/Bull Trading Signal

                Why an investor must know how to read these things?

                For the same reason, drivers have to learn how to recognize road signs: if you don’t know what the signs mean, you could end up ruined. Forex signal trading cannot be taken lightly. It is home to a rapidly changing environment where some online brokers manipulate the original data feed to cause errors in the marketplace and earn a profit over them.

                We show you these groups in the order in which they can be trusted.

                It is common to find traders that are looking to share their ideas with the outside world. Their main aim in doing so is to earn a reputation of being a good trader, help out other people, and simply support the place that was once supporting them when they were new to FX trading. Regularly is possible to find traders that are sharing Forex signals free on many forums. What does such a trader, signal seller work? Traders try to send reliable signals by performing their analysis and providing the same information that they are using in their trades.

                Affiliates represent another group of signal providers.

                You can get free daily Forex signals from this group once you have signed up for an account with a broker using their affiliate link. This way affiliates can still make a commission on the trades you make, but the signals remain free to you.

                However, not every person has enough time to support both his affiliate business and his trading activities, so you should be cautious about this group of signal providers. Sometimes the quality of their signals may drop because they put more emphasis on their own promotion. But you can still treat such signals with a decent level of trust. And remember, it is a must to have former testing of their daily free Forex signals on a demo account.

                Scammers are the people you should be avoided, because they are only interested in making an affiliate commission from you, or just making you purchase their ‘free’ signals. They usually employ pretty obvious methods to fascinate clients.  These artists will give you a few free Forex signals but later, they will ask you to buy premium signals. When you have signed up for free, they will send fascinating signals. Don’t be naive! They will do the same to the other people that have signed up. Some of these people are going to receive BUY orders, others will be provided with SELL orders. This way a scammer can split his audience in half. The first 50% is going to be profitable and the other 50% will be losing.

                So do not fall for scams, as they cannot deliver anything close to the best free forex signals.

                Some trading signals/strategies work very well as long as they aren’t “overused”. You can have a go with them and see if they can produce what they claim. They have to let you know the result.

                If they can’t, never subscribe to that signal service!

                Is copying Forex signals feasible?

                Forex signals are a wonderful choice for people who do not like or want to make trading decisions on their own. Maybe they don’t have a lot of time to trade or want to modify their own trading endeavor with signals from a pro? There are so many reasons why some trader should choose forex signals.

                A lot of people promoting Forex signals services, in order to oversimplify the signals following process. They make it sound so simple and effortless. But the signals follower quickly becomes frustrated when finding out it is not as simple.

                What can you expect from your signal provider?

                The good thing is that all of them will give you some kind of instructions on how to perform. The same comes with copy trading. With some providers, it is as simple as 1, 2, 3. For example, try with one of our partners.

                Do Forex signals work 

                It depends on what you want from your Forex signals.

                • If you want to turn $200 into $15,000 in a few months?  No, Forex signals will not work for you.
                • If you want to win every trade, every week and every month?  No, Forex signals will not work for you.
                • It will work if you want to systematically participate in the Forex market over the long term and slowly grow your wealth.

                Yes, Forex signals can work for you if you choose the right service.

                It is unbelievable how many signals services are impossible to follow in the real world and how many signal followers have unrealistic goals when joining a signals service.

                Let’s put this in some realistic frame.

                Real signals providers have to go through a test period. Providing signals for other traders take some responsibilities. They must provide personal data, for example, personal and last name, passport copy, address, contact info, etc. It is needed in case of any conflicts between a subscriber and a provider. This data are known only between those two parties, subscriber and provider.

                You will recognize the valuable signal provider if you can see that the signal name is fully specified. Your provider has to specify the type of terminal, is it MetaTrader4 or MetaTrader5, also, he or she has to add a broker’s server name. The information also must contain the number of the account that will transfer the signals and traders password for ‘read-only’ mode. If a signal providers service isn’t free, the provider must have been registered as a provider with qualification, meaning passed some tests and examinations, so he/she can be a signal seller giving original practices.

                And say we have this situation, to show you how exactly your deposit will play via trading signals service with maximum protection for each participant. 

                Let’s examine a specific example.

                Provider’s balance is $20,000 , leverage 1:100
                Your balance is $50,000, leverage 1:200, deposit load percentage is 50%
                And assume you are betting on EURUSD currency pair where the exchange rate is 1.1047.

                Your balances ratio regarding the defined part of the deposit in percentage terms is

                (50 000 * 0,5) / 20 000 = 1,25 (125%)

                Let’s examine the leverage. Your leverage of 1:200 is greater than provider’s which is 1:100, hence it isn’t necessary to perform the correction on leverages.

                Currency rate of the deposits at the moment of calculation:

                1,25 * 1,1047 = 1,3808 (138.08%)

                After rounding, the total percentage value is 140% or 1.4 ratios.

                Therefore under the settled conditions, provider’s deal with a volume of 1 lot will be copied to your account in the amount of 140% which is the volume of 1.4 lots.

                That’s how Forex trading signals work.

                If you want to have a good experience with a Forex signals service there must follow these two things:

                • You need to use a Forex signals service that is designed so the signal follower can get similar results to the service with relative ease.
                • You need to align your expectations with reality and understand what can and what cannot be accomplished by following a Forex signals service.

                We all know how this can be difficult. The point is that if you don’t have any previous training experience you will not be able to know what reasonable expectations really are.
                We are surrounded by all the hype of quick and large profits and it is really hard not to be misled.


                Trading With Signals 19

                An example of a Forex trading signal


                But, the simple answer is: Yes, copying forex signals are feasible with one condition: Forex signals can work if you find the trusty service. You need to find the trusty service that you can trade and that realize your expectations. If not, you will constantly be disappointed and keep searching for something better. The best way to figure out if Forex signals work and the service is suits you is to take a trial.

                Types of Forex signals

                Signals are basically electronically transferred bits of information that you can opt to receive via your email on your PC or your laptop, as well as your mobile phone. It is no matter where you are, you can receive this critical need-to-know information.

                Signals inform you of the best times to purchase or sell the asset you are actively trading in. It also lets you know when you should place profit limit orders or protective stop-loss orders that are critical to your financial good.

                Forex trading signals are normally referred to as entry and exit signals. They have to be a result of detailed analysis, research, and tracking. When the signals are transmitted to you, keep in mind that they are only considered as accurate and active for a brief period of time. So, you have to react quickly.

                The type of signal is determined by the specific function it may have and how it generally operates.

                Technically there are two types of FX signals which are permanently available in the Forex market, and they are:

                • Manual Forex signals
                • Automated Forex signals

                When the first type of signal is used, a trader has to sit in front of the computer for a large amount of time, looking for signals to make a final decision on whether to buy or sell a certain currency.


                An example of Forex daily signals

                But the most popular type of Forex signal is copy-trading signals.

                The clue is in the name, as to how they work. It involves following the trades of other real traders and copying the trades that they make. There are many different copy-trading signal providers. Traders are allowed to enter the service to become signal providers, but there are usually several specific requirements, such as set trading volumes.

                Other traders can choose to use the platform and follow these signal providers. Copying another person’s trade can happen automatically, or the signal service will send a notification and then it’s up to the individual trader to execute the trade manually, should they want to. It is usual for this type of signal service to charge a subscription fee or take a commission from a trader’s profit. The signal providers who are being followed charge commission on the profits of the traders that are following them.

                This type of signal service has become very popular because all the participants in the business only make money if the traders using the service makes money. The significant about automated Forex signals is that the trader only commands the software to seek what signals to look for. The human psychological pressure is completely removed. There is the software which will automatically interpret what action to choose: buy or sell a concrete currency. Trading in this way can be quite perfect as long as it is done in a proper way and by a genuine expert.

                The software can process much more data compared to a human Forex trader.

                So, you are able to manage several currency pairs at one time. And you are also able to monitor all the charts you desire 24/7 and without missing any significant signals. But the most successful appliance of signals is utilization a hybrid of both types.

                And that is what the most Forex gurus do.

                Trading With Signals 16

                An example of Forex automated signals 1

                This type of signals service doesn’t use real people to generate the signals. Instead, these are automated or algorithm-based signals, which scrutinize various charts and make predictions and can be relatively accurate Forex signals. This type of Forex signal uses the same tactics and strategies a manual trader would use, but there is no human emotion involved, just a set of clear-cut rules to follow.

                Fundamental and technical analysis, along with a variety of indicators are used to uncover any developing trends.

                Trends are predefined and often predictable movements of currency pairs, and once the software has uncovered them it sends a signal to the subscriber and advises them to make the appropriate investment.

                Automated Forex signals can be quite accurate, but historically, not all have proven to offer the same level of accuracy. So much so that a large number of traders still prefer signals generated by a real live human being.

                .

                Trading With Signals 20

                An example of Automated Forex trading signals 2

                But not all automated signals are made from the same material, and some do make relatively accurate predictions.  Many traders, even some of the most advanced, choose to use signals generated by algorithms daily. However, they will tend to evaluate the signal themselves before acting on the prediction.

                Both manual and automatic Forex trading signals can be received online.

                You can receive forex signals from specialized companies and top forex brokers, generally at a low cost somewhere between $5 to $10 a day and more for monthly rates. Trade signals can also be coupled with fundamental analysis. That will give you another protection in your stock trading. Using trade signals can be precious for you. They will point you out good opportunities but also will alert when they may pass. When you want to buy, check first that the signal offers you a free trial. That will allow you to test the information, and make sure it is good quality before buying it.

                To ensure that a trader is obtaining the information that will benefit in the end, they should only cooperate with companies who are willing to provide previous, evaluated results. Moreover, those firms who validate their information are much easier to trust rather than companies who refuse to grant traders a free trial and access to audited results.

                That is without the doubt the policy of top Forex signals.

                But we have to say, fraud can be a problem when dealing with trading signals. As the forex market attracts a wide and diverse audience, the reliance on information for making financial decisions can be a crucial asset to investors. The possibility exists that some trading signal providers will provide insufficient or inferior information at a premium cost to investors, which can impede or damage an investor’s ability to make the best decision they can in the market.

                The best way is to do your own research the trading signals organizations and considering the advantages/disadvantages for each one before making any kind of financial commitment to one of them.

                Read more about automated trading

                Who are Forex signals providers?

                Almost all Forex traders with their trading system dream of founding signal service. Think, having thousands of subscribers getting your trading signals for a $50 monthly fee. That is everyone’s dream.

                So, let’s say, the signal provider is a trader who grants access to the data on his or her trading operations allowing other traders to copy them on their trading accounts. Signals can be provided either for free or on a financial basis. You can be a signal provider.

                To become a Signal Provider, you need an active MQL5.community account.

                Forex signal provider is a trader who trades on his own life or demo account and sends the same forex signals online to his followers. In most cases, this process is automated and takes no time, literally.


                Screenshot from MQL5.community

                The signal provider doesn’t have to do anything manually to send forex signals indicator to his copiers. With a wide variety of forex signals services available today it is important to learn how signal providers are selected and ranked.

                There are a lot of platforms that allow anyone to register and start selling signals without any preliminary verification of traders experience, knowledge or ability to manage risks. Since after registration trading results of a signal provider are displayed publicly, users can make their own analysis to determine whether the strategy worth following.

                But there is another approach: the trader must fit certain risk/reward requirements and volatility levels before being accepted as a signal provider.

                This method helps a trader make sure that signal seller only offers reliable strategies and don’t accept high-risk ones for copying. It also fits well into copy trading advice and regulations of many countries. All providers are then ranked based on proprietary Forex signal indicator algorithm that takes into account maturity of a strategy (how long has it been executed for), maximum drawdown, regular profitability, volatility, the average number of simultaneously open trades and many other parameters.

                But, remember that this is an extremely competitive arena.

                Because information is so accessible via the internet, you can receive it anywhere as was mentioned above, so that you have round-the-clock access.

                A Forex trading platform or “hub” gathers the necessary information to transform it into the signals that you receive. An additional safeguard is present in the fact that Forex companies are extremely careful and consistently pay attention to details when sending these signals to the various brokers, dealers, and individual investors.

                Many, many forex traders are looking for quick money, getting rich in several weeks. Some forex signals services may have a good run for a few months and then it’s game over. A lot of these guys use crazy stops and those that do use stops use loads of taking profit orders. A professional service will not give so many take profit orders and tell the subscribers to pick one or do whatever they want with it.

                Being a forex signal provider is measured by consistency. If there is no consistency it is a waste of money. Any signal provider that promises fast money or big profits is lying to you and to itself. No one can guarantee that you will make money, because there are good months and bad months. Selecting the right profitable signal provider is one of the most difficult tasks, especially for the new traders.

                Many, many forex traders are looking for quick money, getting rich in several weeks.

                Some forex signals services may have a good run for a few months and then it’s game over.
                A lot of these guys use crazy stops and those that do use stops use loads of taking profit orders. A professional service will not give so many take profit orders and tell the subscribers to pick one or do whatever they want with it.
                Being a forex signal provider is measured by consistency. If there is no consistency it is a waste of money. Any signal provider that promises money or big profits is lying to you and to itself.
                No one can guarantee that you will make money, because there are good months and bad months.

                Selecting the right profitable signal provider is one of the most difficult tasks especially for the new traders.

                You can find some instruction HERE

                How to pick the right signal provider

                A lot of forex traders use forex signal providers to assist them in profit. Traders who try to make profitable trades can leverage off successful forex traders by copying their trades. Not all the forex signal suppliers out there are trustworthy. Attempting to figure out which ones are scam artists and which ones are genuine can be an awful task.

                Finding a reliable forex signal service can seem like a challenge.

                There are signal providers that are professional and honest, of course. But unfortunately, some providers do not always have their subscribers best interest in mind. It is up to you to make sure that you are working with a trustworthy forex signals provider that you can have confidence in. There are several things traders would consider when are going to pick your signal provider. A trader should be aware that there are a lot of hardcore scammers in the market working very hard to provide fake, low quality and substandard forex signals.

                Most of these hardcore scammers have no background or training in any financial matters and usually feed the trader with performance statistics that are imaginary but yet convincing to a trader who is not smart enough. The best way a trader can deal with this problem is by spending at least 5 minutes looking at what other traders are saying about this respective signals provider. This will help him or her in making a proper judgment.

                Another way is by looking at the level of detail contained in the signals.

                If you realize that it just entails a few charts with a loss or profitable line, you will have a reason to think twice before following such signals. You should look for testimonials about various forex signal providers available in the market. Be aware of what other players in the industry are saying about the available signal providers. This will enable you to choose the best provider in terms of accuracy, quality, timeliness, and affordability of the services offered. You should check the number of TPs the providers have in one trade. And, also, how the providers put together the performance statistics.


                The best way a trader can deal with this problem is by spending at least 5 minutes looking at what other traders are saying about this respective signals provider.


                The bottom line is that any trader who wants to be profitable in the long term should start learning by himself or herself about forex signals through experience and self-training.

                How to separate the websites of scammers from genuine suppliers

                Their sites are so similar and competitive. Sometimes you can see forex traders getting in the scammers’ site rather than the genuine forex signal supplier. When they find that the signal is not profiting, they are already passing the point of no return. The scammers had taken the cash and it is past the point where it is possible to do anything.

                These scammers will give you entry and exit signals. But they will not provide you information on how they find the entry and exit points. They want you to follow their signals blindly, that’s all. The scammers will promise you a great profit, a huge return with minimum investments. With all the fantastic promises, you will be motivated to subscribe.

                That is the moment when you will find that whatever you have subscribed to is a pack of lies.

                The types of Forex signal providers

                Forex Signal providers are typically separated into two different groups based on how they generate their trading ideas – technical analysis and fundamental analysis.

                Technical Analysts

                They base their trading decisions on chart analysis including support and resistance levels, candlestick patterns, price channels, market structure, or other technical approaches. Many technical analysts have a proprietary method for analyzing the markets and the highly successful ones have spent many years researching and testing their methodology over historical data and in real-time market conditions.

                Fundamental Analysts

                Who base their trading decisions on economic and news related data. This could be in the form of long-term interest rate analysis, inflation, central bank policy, employment reports, sentiment surveys, and more. Some are longer-term position traders while many others are shorter-term traders that try to catch volatility spikes after an anticipated news release.


                Some traders may think “reliable” means having a high win rate, but that is not really what you primarily want to be looking at. Actually, win rates are not that important as a metric by itself. You must also analyze the average risk to reward in conjunction with the win rate.

                There are strategies with 90% win rates that can lose money and then there are strategies with 30% win rates that can make money.

                Another factor to consider is the technology the signal provider is using.

                Do they have a reliable platform to send out notifications and are there multiple ways for you to receive the alerts? Something else to look at is the depth of detail that the forex buy sell signals provide. Do the trading alerts always provide stop-loss levels and targets or do they only provide superficial information such as entries but no exit details?

                These are some of the factors you need to consider.

                So how can you find out if a provider is reputable and worth your time?

                Sign up for a Trial

                Sometimes this is the best way to get started is by signing up for a forex signals trial. You may get a real sense of the quality of service by diving in and taking a test drive. Many providers offer a 1 or 2 week trial for members.

                Join their Email List

                Another way to find out the quality of information you will receive from a provider is by joining their email newsletter. You will find the value that they provide for free so that you can evaluate whether their premium forex signals service will meet your expectations

                Check their Track Record

                All reputable FX signal providers will provide a performance record detailing their published trades. This is a good way to find their average pip profit per month, their risk parameters, average win percentage, and other related metrics.

                Google them

                Yes, simply Google them. Are they mentioned in any important trade publications or articles? What type of social following do they have? Do everything possible to find to whom you are dealing with. Just don’t be one of those naysayers.

                Check it, try it, test it and make your own conclusions.

                How to select trading signals

                Your ideas are the most powerful ruler of your trading signals. The right trading signals will guide you through competing jobs. The stock market, futures, forex, and options markets are extremely competitive. The difficulty is that it is not simple to find the best trading signal. Your signals should follow your ideas and your trading strategy. If you don’t pick the right signal, you will have a problem with pulling the trigger. The way you enter and exit the market should follow your trading strategy and be in symphony with how the markets work.

                Your beliefs about the market are the most important determinant of your ideal trading system.

                The first step to ensure you choose a trading signal which matches your beliefs is to define your beliefs about trade setups, entry signals, exit signals, and initial stop losses. Some traders believe that there is no value in using trial and error trying, so they are hoping to find something that works.

                Trading With Signals 23

                According to such traders, trial and error in using a trading signal will result in worthless trading practice.

                That can be true at some point. When you use trials you may notice the curve is fitting to past data. You can get a signal that works very well on past data but doesn’t work for you. So how can you expect it to work tomorrow or into the future?

                Maybe, for that reason, it is better to start with your beliefs and your trading strategy and select trading signals that support these to reduce your chance of curve fitting.

                When you change your approach you can find enormous benefits which included:

                • Greater clarity on objectives
                • Reduced need for optimization
                • Greater real-time profitability
                • Reduced development time
                • Simplified system design

                To be clear.

                The internet is a wonderful tool, but the vast amount of information and companies/people dispensing forex trading signals and advice can be daunting and confusing to newer traders.

                Advanced traders already can recognize what constitutes quality versus hype. No one forex signal service will ever meet the needs of all traders, but a good service must.

                Few trading services post their performance. There are several reasons for this:

                The performance is simply not worth showing as it does little to inspire

                The raw data, no matter how robust, falls on deafened ears.

                The first problem is that seeking for a trading signal that generates a profitable trade on its own is nonsense.

                You can receive the best entry signal ever designed. But, if you don’t have only one part of a complete trading system, you will never make money in the long run. You must have a system with all elements working completely together.

                A complete trading system needs each of the following:

                Objectives
                Setup
                Entry trigger
                Initial stop loss
                Exits
                Money management and position size rules

                The trade entry trigger is just one part of the complete system. Many people also claim that it is the least important part of the system. Entry triggers are the area most predisposed to curve fitting, over-optimization, and the worthless sounds in the market. The most important part is how you exit your trade. That will determine how significant profit you make from it.

                Remember, simple is better than complex. Fewer rules are better than more rules. Follow the KISS (keep it simple, stupid) rule.

                Complicated trading systems with various rules may not perform well in the future.

                Well, it is harder to curve fit a simple system with several rules to past data. On the other hand, if you have various rules and complicated guidance you” be able to adjust your system to the past data with minimum differences. But this will perform useless in the future!

                One trader told me: ”Use simple trading signals that fit your trading strategy and beliefs”.

                That helps a lot.

                 And THIS ONE TOO

                How to use trading signals

                When you have signed up with a service to receive online forex signals, you will receive trading alerts via email, SMS or both as you like. You should choose some notification modality that will allow you to receive the alert in the fastest way possible. Many trade alerts are time-sensitive, you know that.

                There are countless ways that you can utilize the issued trade alerts. Depending on your priority, you may decide to follow the trade signal and initiate the suggested trade after you have confirmed that it meets your objectives.

                Many inexperienced or part-time traders prefer the type of hands-off approach.

                Some other traders prefer a more hands-on approach.

                They prefer to utilize the trade alerts as a secondary or confirming indication of their own market analysis.

                For example, short-term traders may take trades using their own system but trade only in the direction of the online trading signals generated by the signal provider. There are many other ways that signal users can use this type of favor to complement their trading.

                How many signals do you need to receive per week or per month?

                That is the most common question. You should be aware that many times it will vary. When volatility in the market is high, you may find that you are receiving more daily forex signals than average, and when volatility in the market is low, you may find that you are getting less trading signals online than average. This is normal and should be expected.


                Trading With Signals 24

                Rookie trader wrongly believes that the more often he/she is trading, the more money can earn in the markets. This is a mistake and often the opposite is true. It’s not the number of your trades that matter, it’s the quality of your trades that make the difference between a winning and losing track record.

                Remember, patience is power in trading. It is more important to pick your spots rather than trying to be in the market all the time. Most top forex signal providers are aware of this and act accordingly. You have to consider this and remember that not being in the market is also a valuable position at times.

                Trade signals can be used in the technical analysis where are a major component, but fundamental analysis, quantitative analysis, and economics can also be applied. Beside simple buy and sell triggers, trade signals can be used to modify a portfolio by determining when it might be a good time to buy more of one particular sector.

                Bond traders may have signaled to modify the duration of their portfolios by selling one maturity and buying a different maturity.  It can also help with asset class allocation like shifting money among stocks, bonds, and gold

                There is no limit to how complex a trade signal can be.

                But, traders tend to keep things simple by using only a handful of inputs.

                I have to admit, it is far easier to manage a simple signal generator and periodically test it to see what elements need balance or replacing. Too many inputs would initiate complexity requiring more time and skills. And we all know that complex strategies may become outdated before testing is even finished.

                Using trading signals means that you can trade immediately, as soon as the notification comes. Services will provide you with additional means for trading as well, such as allowing you to do trade through a smart device like a mobile phone or tablet.

                Signals can be hugely beneficial to traders of all kinds, from the most experienced to someone just starting out.

                How to know if Forex Trading Signals is a scam

                The best forex scams are hard to spot, so I want you to be able to identify the most common tricks used by dodgy forex sellers. Most of the scams were interrupted thanks to the enforcement of rules by bodies such as the FCA. But today we are faced with the more advanced scammers.

                Of course, not every forex signal is the scam.

                There are still very reliable services but it can take time to recognize them. First of all, there are so many speeches about scams all around the forex. Don’t believe every word you hear. Just because someone offers poor quality, doesn’t necessarily make it a scam with the intention of cheating you. Think about the intent of the sellers. If all they want is your money without making an effort to deliver, it’s a scam.

                The opportunity of scamming still exists for many forex scams.

                Scammers tempt new investors with a promise of quick fortunes through “secret trading formulas” or algorithm-based “proprietary” trading methodologies. Before choosing a broker or platform, go through your own search.

                Forex signal providers may be an individual or retail firm that promises to trade your account or give you signals to enable you to make a killing out of the market. Some of them will promote their experience and back it up with a few testimonies.

                Some promise very high returns and guaranteed profits, either through a managed account where the firm makes trades on the investor’s behalf or by trading using the firm’s trading platform. Most traders will receive some initially returns from the firm to give the impression that their trading has been a success.

                Scammers will encourage traders or investors to invest more money. But at this stage or soon after the returns stop, their account is suspended and there’s no further contact with the firm.

                Important to know is the fact that many scam firms claim to be FCA authorized.

                How can they do it?

                Many fake trading and brokerage firms will use the title, ‘firm registration number’ (FRN) and address of regular companies and signal providers who are FCA authorized. This is the so-called ‘clone firm’. The fake providers will give you their phone number, address and website details. Sometimes they will claim that a brokerage’s contact info on the Register is out of date. Or scammers might claim to be abroad firm, and that’s the reason they don’t have updated contact and website.


                scamm

                An example of scam trading signals

                Some scammers may copy the website of an approved company, and change, for example only the phone number.

                When you want to pick your signal provider you have to check several things.

                Trustworthy Forex signal service should be verified in websites like the Forex Peace Army. Further, you shouldn’t pay more than a few hundred dollars for a good signal system.

                Be especially careful of system sellers who offer programs at excessive prices and claim they can guarantee remarkable results. Choose one of the many legitimate sellers who are decent and whose systems have been properly tested to potentially earn a substantial income.

                Another problem is the mixed funds.

                Without a record of separated accounts, the trader cannot follow the precise executions of their investments. If you don’t check this issue, you are opening the door to scams. Scammers can use a trader or investor’s money to buy houses, cars, and planes or just vanish with your money. They can offer an investor the false opportunity to have his forex trades managed by highly-skilled forex traders who can offer outstanding market returns in return for a share of the profits.

                The catch is, this “management” offer requires the investor to give up control over his money and hand it to someone he knows little about other than the hyped-up and often the completely false record of success available on the scammer’s website and booklet. And the trader or investor often ends up without money, while the scammer uses investors’ funds to buy yachts.

                Still, the forex market is not entirely unregulated.

                Some forex brokers do not deal fairly with their customers and defraud them.

                How does it work?

                They start as an unregulated broker. And they publish the offer of large incentives to recruit affiliates who then bring the clients. Once the broker has a few million dollars in funds, empty the accounts, transfer the money to an anonymous tax haven and shut the doors.

                Hard to believe?

                If some signal seller claims that everything he or she touches turns into gold, don’t trust.

                Trust me, I am rich! C’mon!

                Their model is a fairytale of sales tactics where clients are suckered into a free seminar, then persuaded to buy several thousand dollars courses, then upsold again to a more expensive course. The tactics are so good the clients don’t even know they’re being cheated. The education they provide is nothing you can’t find for free elsewhere on the internet. Pay them to teach you, start trading, and allow them to buy a Lamborghini. Huh!

                Million Dollar Pips was one of the most popular strategies ever sold, but the developer never traded it on a real account.

                How does it work?

                Develop a simple automated strategy that trades a lot with a high percentage win rate. Run it on a dozen accounts using a variety of settings. After several months, pick the best track record and publish to Myfxbook or some other traders community site.

                Develop a sales page detailing how “sophisticated” and “professional” the strategy is. Buy an email list, contact affiliates offering a 50% commission on all sales, then launch!

                A few years ago it wasn’t uncommon for someone to sell thousands of copies of such strategy.

                This kind of scams will fail, there is no doubt. Like any other did.

                Where the warning signs can be found?

                If brokers won’t allow the withdrawal of monies from investor or trader accounts. Or, if it is impossible to withdraw money.

                Also, if enter or exit a trade during an economic announcement is not in line with expectations. And, if the trading station doesn’t operate to your liquidity expectations.

                The best way to determine if a signal seller can benefit you is to open paper money or practice trading account with one of the better-known forex brokers.

                Be patient, and eventually, you’ll determine whether predictive signaling works for you or doesn’t.


                The list of the biggest scammers you can FIND HERE on Traders Paradise’s Wall of Shame

                How to avoid signal provider scams

                I think everyone should learn at least the basics of how to spot Forex scams.

                First, ensure you deal with signal service providers originating from locations you have heard of before.

                Second, if they are authentic, their payment method should be one of the common online payment methods such as PayPal or credit card payments.

                Listed here are some of the attributes to look into before following a signal service:

                The signal should have verified records of myfxbook, FPA, and other credible verification sites.

                The rule is, if the results are not verified, just move on do not waste time or money on unverified results.

                In most cases, you will not know on what basis their decisions are made on, so this makes the verification part very important. Focus on signals with over 6 months record of profit and with over 100 trades. If whatever is being shown as results are for less than 100 trades that means the statistics are not sufficient to make any judgment.

                The result should be sufficient to offer statistical significance to inform your decisions. Again if the results are for less than 6 months, then the strategy could just be lucky and with time it may be proved wrong.

                Make sure the signal operates with drawdown levels you are comfortable with.

                This will vary from one trader to the other. Some traders have a bigger desire for risk some have low. If for instance, you take a strategy with 30% drawdown, that means $3,000 could be in drawdown with an account of $10,000 and you remain comfortable. So work with a drawdown that does not give you sleepless nights.

                Don’t just focus on how much a strategy earns, take a look at its drawdown too.

                Get a signal with reasonable performance or subscription fees. When you are paying to a signal service, also check the fee charged is fair. Unless you are doing this to test the strategy, this strategy will only make sense if you have a huge account.

                As we said before, any forex signal service should offer a certain trial period or money-back guarantee. They should allow traders to test before buying. If that is not the case, move on and don’t do not waste your money. If they don’t trust their strategy, why should you?

                Signals should be showing the current open positions.

                A signal may be showing huge profits yet the current open positions are in huge losses capable of wiping the whole account.


                Just like in most trading scams, the scam will not only be in the service itself but in the manner in which it’s marketed too.

                Most of these scams will promise you a billion dollars, and one has to stop and wonder why aren’t they millionaires?

                Remember most of these fraudsters know that an aspiring user of forex signals will heavily rely on what other users say about the product. They can hire people to review them well. The rule in this game is, make your search. You should check the firm isn’t a clone firm by asking for their firm reference number and contact details and then calling them back. Never use a link in the email from the firm offering you an investment. Always be careful if someone is contacting you out of the blue. If they pressure you to invest immediately or promise you a huge return. You must seriously consider seeking financial advice or guidance before investing.

                You have to be sure that the firm you are dealing with is regulated. Never take investment advice from the company that contacted you, instead, you contacted them. That may be the scam.

                The bottom line

                As you can see there are plenty of benefits using trading signals in this tutorial Trading With Signals.

                If you trust the signal provider, then you can save a lot of time and keep your focus on other core aspects of your trading business such as risk management principles.

                At the end of the day, all that counts is profit.

                The professional traders will tell you that risk management deserves 20 times the attention that entries and exits normally receive.

                The trading signal can be very complex or very simple. There is no quantification for that. The measure is how good and helpful it is.

                Traders tend to keep things simple by using only a handful of inputs.

                Honestly, it is far easier to manage a simple signal generator and periodically test it. Just to see what components need adjusting or replacing.

                Since markets change over time with great speed, complex strategies could be rendered obsolete before testing is even finished. That is the moment when trading signals step on the scene.

                Why we published this tutorial?

                Traders Paradise truly believes that knowledge is power. And speaking about your money, knowledge is priceless. We have been written about trading signals, what they stand for, their types and appliances in general trading. In particular, we wrote about how to define a top trading signal provider by providing theoretical information, and tips.

                Our intention isn’t to encourage you to utilize signals, but rather to give you an understanding of what is available should you want to include signals in your trading strategy. Remember, however, no matter how many benefits signals seem to offer, they aren’t a replacement for experience and real trading skills.

                Build up your knowledge and gain a real understanding of the trading market before you start to rely too heavily on signals.

                Traders Paradise showed you how to choose the best from all these possibilities we just introduced you.

                We hope that this ebook will be helpful for you and we wish you good luck in your future trades.

                Good luck from Traders Paradise Team!


                We are preparing a lot of surprises for you.

                See you around!