The pharmaceutical stocks belong to the larger healthcare sector.
With faster drug approvals and increasing customers, investing in pharmaceutical stocks could be a good choice.
Pharmaceutical stocks increased in 2019. The best pharmaceutical stocks have strong Composite Ratings and Relative Strength Ratings. That recommends buying them.
As we can see the healthcare industry will only intensify. The new technologies are developed or in the phase of developing with good predictions to get approvals for use. This industry will continue with modernization, it is obvious.
The increasing development of tech in healthcare also will give new chances for the industry. Prescript medicine sales CAGR from 2019 to 2024 is set to be three times that in the period from 2010 to 2018.|
The forecast annual CAGR of +6.9% for the next 5 years is $1.18trn in the US.
Pharmaceutical stocks to diversify the investment portfolio
Investors who want to diversify their investment portfolios would do well to look at the pharmaceutical stocks.
Pharmaceutical stocks are high-risk investments, but companies from the industry can be very good for investors seeking long-term investing. The changes in this field, almost on a daily basis, approval of new treatments, new drugs and therapies, great returns, make this industry favorable for investors. It shows profitable opportunities.
If you want to invest in publicly traded pharmaceutical companies, just keep a close eye on them when they enter clinical trials. The results of clinical trials are extremely important for investing in pharmaceutical stocks. Why? Well, those trials can be ended with the make-it-further option or break it.
The auspicious results can reach big gains in the stock market, but failures or loss of progress can have a reverse impact.
Approvals before market
Before selling their products, drug companies are required to first test them. Results from pharmaceutical products are sent to the relevant government organizations or agencies to examine the safety, proposed use, and efficacy.
The approval means that they have analyzed the medication’s consequences and that there are more positive than negative effects. There are various approval stages: analyzing the disease the drug is targeting, treatment options, analyzing effects from clinical trials and how to handle any risks linked with the drug or method.
Since there is a lot of examinations, the approval can take years.
Well, drug approvals are possibly the most attractive in pharmaceutical stocks investment opportunities. They are always on the radar. New drugs are innovation on the market, especially when it gets to rare diseases.
For example, during 2018, the US FDA’s CDER approved 59 new pharmaceuticals. Among approved medications were the first to treat smallpox and the first treatment for hypophosphatemia. Over the first 6 months of 2019, the approvals got 16.
All this taken together, represent the excellent market conditions for pharmaceutical companies.
Pharmaceutical stocks: the trends
In the pharmaceutical market currently exist 10 main therapeutic sectors, which shows data from Statista.
The global sales for medicines generated a total revenue of US$36 billion. The top sales go to pain therapy, anti-diabetic drugs, and oncology.
In terms of revenue, pain therapy generates sales of $79 billion, anti-diabetic drugs $40 billion, and oncologic $100 billion.
Treatments and drugs for depressive disorder and anxiety also generate greater revenue. For example, Eli Lilly Company (NYSE:LLY) reached $36 billion in revenue this year.
The main fields of developing new therapies or drugs, so far this year, were treatments for non-small cell lung cancer and breast cancer.
Pharmaceutical stocks: market growth
The global pharmaceutical market is ready for outstanding growth. Big and famous brands are always interesting but small and micro-cap stocks are good too.
According to many reports, the industry reached $1.2 trillion in 2018, up to $100 billion from 2017. In the next 4 years, the market is predicted to grow at a compound annual growth rate between 4% and 5% and to reach $1.3 trillion. But this rate is less than between 2014 and 2018.
Nevertheless, investing in pharmaceutical stocks could be a good addition to everyone’s portfolio. You don’t have to invest in leading pharmaceutical stocks, some are not as big as leaders but have great growth potential. And, they are cheaper, also.
In the next 5 years, the sales volume in the pharmaceutical market is possible to reach $1.18 trillion. It looks like a great opportunity.
Here are some Traders Paradise’s picks:
Merck & Co., Inc. (MRK)
The last price $91.58 (December, 20)
Market Cap $233B
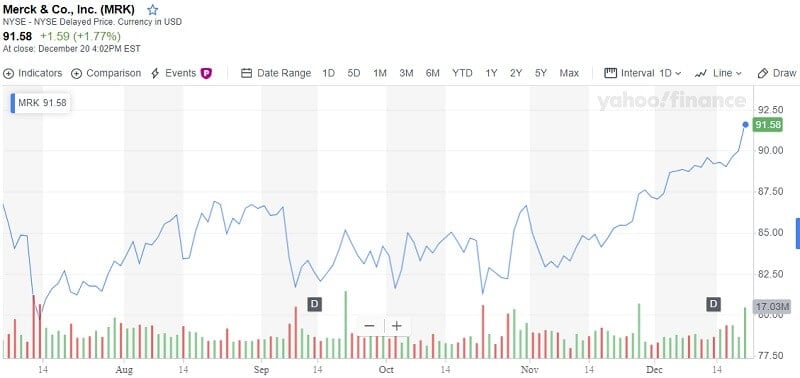
Merck is rapidly growing, the CAGR is 10.9%.
Merck & Co., Inc. offers therapeutic and preventive agents to treat a huge range of diseases such as cardiovascular, type 2 diabetes, chronic hepatitis C virus, HIV-1 infection, insomnia, neuromuscular blocking agents, cholesterol, anti-bacterial and vaginal contraceptive products. Also, the company is focused on products to prevent chemotherapy-induced and postoperative vomiting, treat non-small-cell lung, breasts, thyroid, cervical, and brain cancers, vaccines for measles, mumps, rubella, varicella, rotavirus gastroenteritis, and pneumococcal diseases. Additionally, the company produces antibiotics and anti-inflammatory drugs to treat fertility disorders, and pneumonia in cattle, bovine, and swine, and antibiotics and vaccines for fish, dog, cat, and horse vaccines, and many others. It has collaborations with many bio-pharmaceuticals companies. The company was founded in 1891 and is headquartered in Kenilworth, New Jersey.
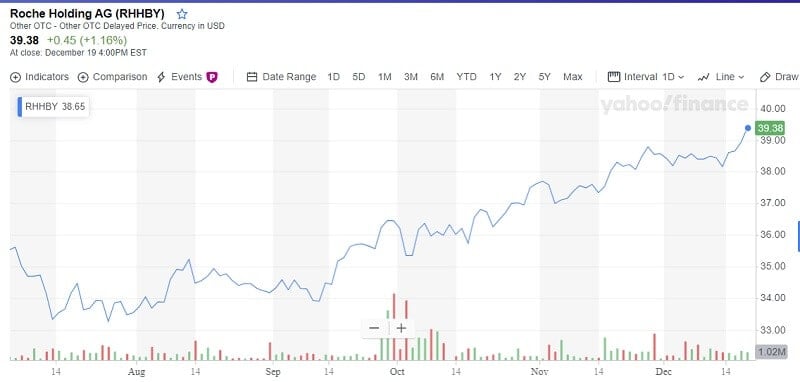
Roche Holding AG (RHHBY) (SIX:ROG)
The last price $39.88 (December, 20)
Market Cap $271B
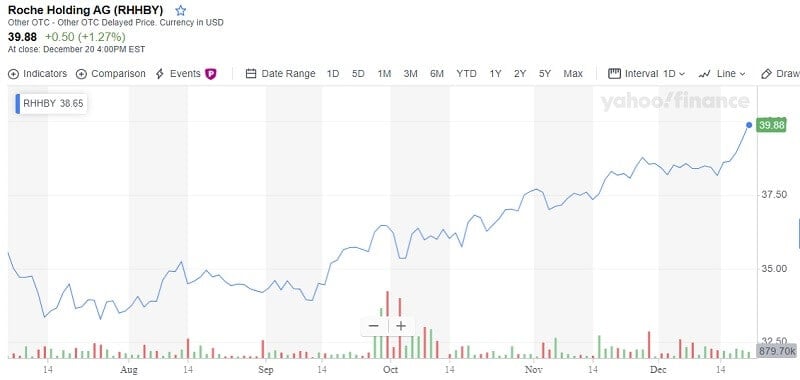
Roche Holding AG is the leading trend in biotechnology, with a forecasted $38.7bn of sales in 2024
On December, 23 Roche announced that it entered a $1.15 billion worth licensing agreement with Sarepta Therapeutics to get the right to start and commercialize Sarepta’s investigational gene therapy for Duchenne muscular dystrophy outside the US.
Roche will make a payment of $750 million in cash and $400 million worth in equity. Sarepta’s micro-dystrophin gene therapy SRP-9001 is in clinical development.
Roche said the agreement is supposed to close in the first quarter of 2020.
Eli Lilly & Co. (LLY)
Last price $132.43 (December, 20)
Market Cap $127B
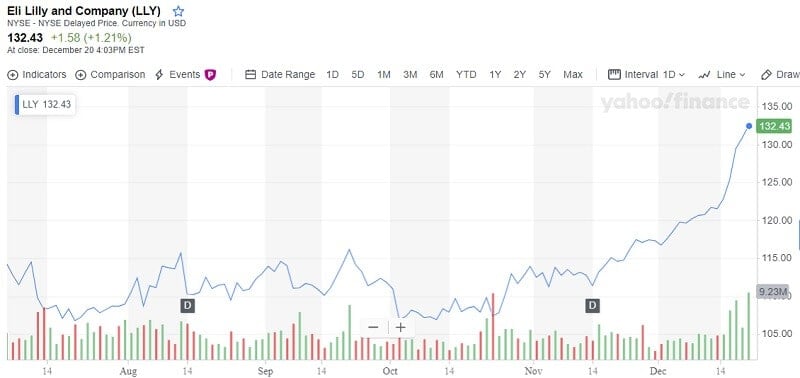
Lilly published a better-than-expected financial outlook for 2020 while confirming the previously announced 2019 sales and earnings plans. Lilly awaits adjusted earnings from $6.70 to $6.80 per share in a year ahead. Revenues are expected from $23.6bn to $24.1bn. If the company reaches this planned sales range, it will exceed its 7% revenue CAGR target. Lilly is expecting important results for several key pipeline drugs. Also, it awaits approvals for two new drugs and three new launches in the next year.
Eli Lilly’s stock price has a rising tendency and it looks like a good long-term investment.
Bottom line
These stocks are just a suggestion. Of course, you may choose some other pharmaceutical stocks. For example, Pfizer Inc. (PFE) with Market Cap: $227.87 billion that generates an 18.7% annual return. Or Johnson & Johnson (JNJ) with a Market Cap of $375.67 billion. Zoetis Inc. (ZTS) can be a good investment choice with 17,7% of the annual return.
If you are looking for long-term investment for your portfolio, investing in the pharmaceutical industry could be one of the best places to invest in.
But be conscious, the overall performance for the industry was worse in 2018. The leading pharmaceutical sector market index (S&P Pharmaceuticals Select Industry Index) made negative returns of -16.87% last year. The index started at a closing value of 5,082 and ended at a value of 4,225 at the end of the year.