Category: Traders’ Secrets


Traders’ Secrets is something that everyone would like to know, right?
How is it possible that some traders are successful all the time while others fail to make a profit all the time?
That is exactly what Traders’ Secrets will show you.
Traders-Paradise’s team reveal all trading and investing secrets to you, our visitors.

What will you find here?

How to find, buy, trade stocks, currencies, cryptos. You’ll find here what are the best strategies you can use, all with full explanation and examples.
Traders-Paradise gives you, our readers, this unique chance to uncover and fully understand everything and anything about trading and investing. The material presented here is originated from the experience of many executed trades, many mistakes made by traders and investors but written on the way that teaches you how to avoid these mistakes.

Moreover, here you’ll find some rare techniques and strategies that are successful forever, for any market condition. Also, how to trade with a little money and gain consistent returns. By following these posts you’ll e able to trade with greater success. You’ll increase your profits and your wealth, of course.

The main secret of Traders’ Secrets is that there shouldn’t be any secret for traders and investors. Rise up your trade by reading these posts, articles, and analyses!

You’ll enjoy every word written here. Moreover, after all, your trading and investing knowledge will be more extensive and effective.

Traders’ Secrets will arm you with those skills, so you’ll never have a losing trade again.

  • Forex News: Dollar weaker despite the trade optimism

    Forex News: Dollar weaker despite the trade optimism

    Forex News: Dollar weaker despite the trade optimism

    Forex News for December 27: According to FXStreet, the US dollar ends on the last day (December 26) with losses against most major competitors in weak market conditions. Major pairs continue in limited ranges while trading is boring because most markets are closed due to holidays.

    Good news comes from the Chinese Foreign Minister and US President Trump. Both of them confirmed that the signing of phase one of the trade deal is just around the corner. 

    The EUR/USD pair advanced above 1.1100, while the GBP/USD pair re-took the 1.3000 marks, due to the dollar’s weakness, and chances of bigger gains are actually limited.

    The Bank of Japan Governor Kuroda said that the central bank would ease policy further if its 2% inflation goal came under peril. He also showed more confidence in the global economic outlook. USD/JPY near December high.

    The Canadian dollar is the strongest.

    All major markets are opened today (Friday 27), but there is a little action.

    Forex News: Dollar Index

    The Dollar Index is tanking today as traders await the signing of the “phase one” trade deal.
    There are two support levels in the focus of the psychological 97.00 area and below that 96.72 wave low.
    There is also a trendline marked in red that might act as support a support area.
    Finally, looking at the RSI there seems to be room for a move lower as we are not in the oversold area.

    Forex News: Dollar weaker despite the trade optimism Image source: FXStreet

    EUR/USD consolidated near five-day highs of 1.1122 while the Cable traded choppily around the 1.30 handle         

    Asian stocks hit 1-month highs, Treasury yields traded on the back foot while S&P 500 futures recorded modest gains.

    Gold kept its bullishness above $1500. Crude oil traded close to three-month peaks on trade deal hopes and good US Consumer Spending data.  

    Cryptocurrencies reversed the recent upsurge. Bitcoin slid below $ 7,200 mark.

    Don’t miss this: Math Guide for Forex Trading

  • Stock Market Correction – The Storm Is Coming

    Stock Market Correction – The Storm Is Coming

    Stock Market Correction – The Storm Is Coming
    A lot of mergers and acquisitions, drop trade investment and lack of business trust indicate a coming stock market correction Bear in mind that markets will not disappear, so you can get back 

    By Guy Avtalyon

    The dark sign of an upcoming stock market correction might be when the companies are buying back their stocks and use them for buying other companies. In this example, the stocks are used as currencies. We can see that so many companies are doing exactly that. Further, we are witnesses of a lot of mergers and acquisitions. The companies are uniting to survive something. But what? What they are expecting?

    Is the logical answer that they are expecting stock dumping and the stock market correction?

    Some analysts say YES.

    The first sign of possible stock market correction they see in companies buying other companies, in mergers with rivals and financed by shares exchange is the signal that the market is close to the end of its bullish period. The opposite opinion befalls when the companies invest in new activities, new operations, development. That would be a good signal for the stock market. But when the companies are using their own shares to buy growth it only can be a sign of the lost confidence.

    Yes, the economy runs in cycles. The sunny days will always follow after rainy days. But we have to be worried when the economy’s condition pattern indicates the coming storm just as we are in a hurry when the real storm is coming.

    How to manage the stock market correction?

    A stock market correction is an alarming condition but quite normal. Some might be surprised, but it is a sign that the market is healthy. Well, in most cases.

    How could we know that the stock market correction is coming? When the stock prices are dropping 10% or higher from their most current peak but not more than 20%. In such a case, we would have a bear market.

    Firstly, don’t try to “time the market.” Avoid swing trading even though trading the ups and downs may give you some profit but for a short while. Many investors are trying to avoid losses by putting money in some other investments where they think there is a better possibility of profiting. 

    Most people lose money by trying to move their money around to participate in the ups and avoid the downs. This is a documented behavior studied by academics around the world. The field of study is called behavioral finance. That is a behavioral bias.

    Our two cents

    When you build your investment portfolio it should be based on knowledge and your education, not on prejudices. It is normal to expect that for every quarter of the year, you will have some negative returns. Tn order to lessen those negative returns or to control them you have to have a diversified portfolio. That means you need to combine your investments. Pick a mix of assets that have more potential for upsides and fewer chances for high returns because that means less risk.

    During the market correction, savvy investors have more discipline, less fear, and stay with their investing playbook. Don’t trade at those times because you may catch larger losses. Behind these words lies the stats, you can easily check it.

    Follow the old Wall Street pattern: Never catch a falling knife.

    Be mentally prepared

    A market crash may happen. When? It doesn’t matter. You have to be mentally prepared for that because the markets are unpredictable and it had happened before. Yes, we all like to be rich even on the paper and it’s really hard to chew a big bite. And the stock market correction is just that – a big bite. Some investors might feel fears, be frightened, and start selling their stocks at the worst time.  

    If you are a long-term investor type, you must have trust that the stock market will adjust eventually. 

    Corrections can last from several days to months or longer but the last mentioned are rare. Remember, a correction may damage your investment for short, but it is a great opportunity for adjusting overvalued stocks. So, buying opportunities are undoubted. So, just keep adding stocks to your investment portfolio while others are selling in a panic.

    Can we predict a stock market correction

    Nope. No one can predict a stock market correction. They aren’t predictable. Moreover, they can be generated by different matters. For example, we know the Great Recession has erupted on the housing bubble. But we know that after everything was finished. But predicting the main cause of the next correction just isn’t possible.

    What we know for sure comes from research. According to one conducted on the example of the Dow Jones, the average correction lasted about 72 trading days or three and a half calendar months. And the correction is when the overall stock prices drop more than 10% and if the decline of more than 20% it is a so-called market crash. That’s all.

    For whom the market correction matters?

    Stock market correction matters for short-term traders. If you stay focused on the long term you will survive anyway. When correction occurs those who’ve adjusted their trading as the short term or those who have leveraged their account with the use of margin, should be worried.

    Traders that used margin had bigger losses during the market downturn. Also, active traders had increasing costs united with their losses during the correction. Holding long-term investment was the best way to survive the stock market correction. At least such investors had a peaceful life.

    Don’t be afraid of a stock market correction. It is usually a great time to buy high-quality companies at a lower price. So, you can add stocks to your portfolio for long-term investments, even the one that previously appeared to be a bit too pricey. Also, a market correction is a good time to examine again what you hold. Sell your position only if you see that your investment, but each in your portfolio, couldn’t meet the cause of keeping it.

    A stock market correction doesn’t need to be terrifying.  If you don’t want to taste it, it is best to stay away from investing in the stock market. Instead, stick with safe investments. 

    Keep your balance.

  • A Good Entry Point, the More Chances of Profit

    A Good Entry Point, the More Chances of Profit

    A Good Entry Point, the More Chances of Profit
    The entry point is very important and can determine the end of your trade both in losses or in profits.

    Having a good entry point is the first round in reaching a prosperous trade.
    What is the entry point? It is actually the price investors have to pay to buy/sell a stock. The exit point, on the other hand, represents the price at which investors exit the trade with loss or in profit.

    While the entry point has been extensively examined from the divergence/convergence aspect, the exit point has not got full attention.

    Why is that? Well, exits may have hidden tendencies.  

    But let’s stay on a good entry point.

    Traders’ successes or failures depend a lot on trade entries. One wrong entry can destroy your trading, for example. Yes, traders are using stop-loss to lessen the risk in case the market makes big moves.
    But let’s talk about how the risk-reward potential can be enhanced by a better trade entry.

    First of all, never enter the trade when the market is near to extreme highs or lows from the recent position. That fault may ruin your trade.
    We already have seen traders that decided to enter the trade when the trend broke the final high with the hope that the stock price will continue running up.
    That was the wrong decision because when the price reaches its highs, in most cases the only way it can go further is down. The price will drop into the previous range. So, you will make a loss.
    The reason behind this is that markets never move in one direction forever. Especially after the trend reaches extreme highs and lows. If you place the entry point when the trend reaches the highest, it will always result in losses.
    But if you like to take more risks in trading you can do that but be sure where you want to set the stop-loss to lower your losses when exiting the trade.
    The wrong entry may occur if you are trying to enter the trade at the point where a large move is, but you are not sure what caused this move is. The direction may shift quickly in the opposite direction and your trade will end in losses.

    Reversal strategy for a good entry point

    Some traders like to set entry using reversal strategy. What does that mean?
    In this entry strategy, the traders are taking the trade with the hope that the market will make changes its trends. They are using pivot point levels, so-called Fibonacci levels. This entry is useful only when the market isn’t trending in an obvious, clear direction.
    Don’t use this in all trading.

    The real role of a good entry point

    The role of a good entry point is to allow you to identify high probability trades. You need the confirmation that you have an edge by reducing emotions.
    You need a trading strategy that makes sense and where you can execute entry orders with confidence. It is very important and your good entry point should provide you that. Otherwise, it isn’t good.
    Eventually, with a good entry point, you are more likely to enter the profit target or stop-loss. And the chance to look for other opportunities is here also.
    A good entry will help you to repeat your trades and increase your advantage. But don’t be too focused on your entry point. Overoptimizing is never good.

    Bottom line

    A good entry point is very important for the success of your trade. But the exit point is what will control your profit. So, you will need to optimize it. To be honest, the best way is backtesting and finding out what works best for you. There are two ways to do that. You can use complicated calculations, charting, etc. or you can use Traders Paradise’s unique and simple app for optimizing your exit strategy. It’s up to you. 

    Remember, all is important. But as you can see, you can enter the trade in many situations but you can end your trade with only two: profit or loss.

    Trading is a game, you have to make the best move at the right moment.

  • Superstition In the Stock Market May Lead You to Lose the Shirt

    Superstition In the Stock Market May Lead You to Lose the Shirt

    Superstition In the Stock Market
    Stevie Wonder wrote in his famous song:
    Very superstitious
    Writing’s on the wall
    Very superstitious
    Ladder’s about to fall
    Thirteen-month-old baby
    Broke the looking glass
    Seven years of bad luck
    Good things in your past

    Superstition is so live in the stock market that you can barely believe. Imagine that it is Friday 13, just like it was in April, September, and December this year. Some people, especially scientifically-minded, would roll the eyes. But, despite the fact that Friday 13th is just a day in the calendar and it may occur several times in one year, some investors truly believe that it is a bad-luck day. 

    When enough investors share this foolish belief, stock prices can be changed but not in the investors’ favor.

    But do superstitions really affect the stock markets? 

    Some studies revealed that people are more risk-averse when thinking about Friday13.
    One study from 2005 discovered that hesitation to do business on this day ends in a loss for the US economy of almost $900 billion. Does this scare affect stock prices? Believe or not, yes.

    First superstition: Friday 13th

    According to a study, returns on Friday 13th are lower compared with other days.

    This Friday 13th effect was broad spread among numerous investors until 1980 but has disappeared. The reason is simple: automated trading erased the “Friday 13th effect”. 

    But it so funny to talk about Wall Street superstitions. So let’s proceed.

    Superstition In the stock market No2: Did you know anything about the witching hour?

    Several years ago I found an article written by the man who worked as a broker on Wall Street. I am sorry, I didn’t remember his name. But what I remember is the witching hours are between 2 and 3 PM. Superstition linked to this part of the day (notice, it was on a daily base) was related to market close. If the market sold off at that time, it was a sure sign that the market will be closed on a positive mark. In that interval, from 2 to 3 PM, he and his colleagues were maniacally buying stocks. Just to provide a stronger close.  

    It worked until it didn’t. They didn’t leave the stats.

    Superstition In the Stock Market No3: Sell on Rosh Hashanah and buy on Yom Kippur

    The superstition works like this: on Rosh Hashanah, which is the first day of Jewish New Year investors should sell some of their positions and buy them back on Yom Kippur. This year Rosh Hashanah began on the evening of Sunday, September 29 and ended on the evening of Tuesday, October 1. 

    Do you believe that this trade works? Well, yes. More often than not. But for Jewish. Maybe you should try to sell some of your positions on January 1 or on Christmas or on Islamic New Year. In 2020 it will begin in the evening of Wednesday, August 19 and ends in the evening of Thursday, August 20

    But I am not so sure, dates may vary. 

    Chinese new year will begin on Saturday, January 25, 2020. 

    Did you know that for one part of Orthodox the New Year actually begins on January, 14? Confused? It is just a calendar. But if it works for Jewish why it doesn’t work for others? There is no reason. The only thing to consider is, do you have to trade according to the Jewish calendar or you can use any.

    What I learned during my life is: about superstition and taste is worthless to argue. Take it or leave it.

    Superstition No 4: Super Bowl theory

    This theory goes that the Dow Jones will have a good year if a National Football Conference (NFC) team wins the Super Bowl. But if the American Football Conference (AFC) team wins it will end the year lower.

    For those with a lack of knowledge about American football, the American Football Conference (AFC) and National Football Conference (NFC) are parts of the National Football League (NFL). Honestly, European football is simpler. 

    From 1967 to 2003 this superstition showed it was accurate 68%.  Several years in a row AFC teams were winning the Super Bowl and that was a period of economic growth, but who cares?

    Let’s ask the stats.

    It was 1967 when one AFC team won the first Super Bowl. During the following period, AFC teams have won 11 times, if you check the stock market result you will be surprised. In 6 of those 11 years, the stock market was dropped. On the other side the stats aren’t so favorable, NFC won Super Bowl more than 30 times and Dow Jones didn’t advance in each of them.

    October Effect

    This one is a bit harder to rebut. 

    The October effect is a market anomaly. The stocks tend to decrease during October. Honestly, it is mainly a psychological effect rather than a real wonder. The stats show something different than this theory. 

    But…

    October has this reputation thanks to Panic in 1907, Black Monday, Black Tuesday and Black Thursday in 1929, and Black Monday in 1987.

    Black Monday, 1987 that happened on October 19. The Dow fall 22.6% in one day. It was possibly one of the most unlucky days for investors and the stock market. 

    Despite the scary title, this effect is not statistically exact. From a historical view, October has seen the end of bear markets more than it witnessed the beginnings. But, investors see this month as dangerous and they are selling, and that sentiment creates possibilities to buy on the other side. So, superstition or not, while one sees the end, the other will see the beginning.

    Bottom line

    Irrationality and superstition in investing will always cause lower returns. Traders, whether they admit it or not, are superstitious. Some will have a happy pen, the other lucky shirt or underwear (hard to believe), some will have some other talisman. Superstition in the stock market is broad spread.

    Luckily, many investors and traders are devoted to science, education, and knowledge. 

    As Stevie Wonder wrote: 

    When you believe in things
    That you don’t understand,
    Then you suffer,
    Superstition ain’t the way

    Happy trade!

  • Forex signals – How Do They Work?

    Forex signals – How Do They Work?

    Forex signals - How Do They Work?Are you going to use Forex signals or not, depends on your personality and trading plan. In case you are an individual with little time, Forex signals offer an alternative to manual trading.

    Forex signals behave like a trade alert for the currency market. In Forex, trading signals are used by traders all over the world. They help them to make crucial decisions about trades.

    Trading signals in Forex are one of the most valuable tools you can have. Almost all traders prefer to use them because they can profit from proper signals. A trading signal is completely a suggestion of when and how to trade. The information is based on special price analysis. The trading signal is commonly formed by an expert or it is formed by the program which uses multiple technical indicators.

    By using trading you will be methodical. All you have to do is to find a trustworthy source that is compatible with your trading strategy.

    Find a signal provider able to provide the individual support, and a ‘strike rate’ of previous signals.

    The Forex signal has to show you the entry point.

    Your entry point shows you the price level at which to open a trade on the forex pair. The signal must show the level which will trigger market activity and it will be your entry point.

    Some signal providers will automatically create the order to open a new forex position if the price hits the settled level. That is a great advantage because you don’t need to be in front of your device when the entry point is breached. The other choice is to set a price alert at the entry point level. Then you can manually open a trade when the alert is triggered.


    The Forex signal has to show you the exit point.

    A good trading signal must provide you with two exit points. It must indicate where to close every position formed as a response to the signal. This means it must show the stop level and the limit level. The limit level is where you could make a profit.

    The stop level is important information because it is the point where you have to close the position if your trade is moving unfavorably. That will protect you from taking a loss. 

    The limit level will show you the point where to close the position if the trade is moving in your benefit. That will secure your profit. 

    For example, the signal could indicate a short-term price rise will result in a reversal. Well,  you would like to pick a profit at the peak of the rise, just before your earnings go reversal.

    Stop and limit levels are an essential component of your trading plan. That’s why the good trading forex signal must have the exact information about them.


    Forex Signals can be placed into three groups:

    News trading signals
    Technical signals
    Real-time trading ideas – Webinars

    The first one in the list is the fundamental approach to Forex signals. This signal aims to get the news release as quickly as possible and provide a trader to gain the maximum level of profit in a short time.

    Forex signals often come with daily or weekly commentary and analysis.

    Technical trading signals are simply trading tips on the basis of technical analysis.

    That means you trust the experience and follow the record of the signal provider. You are sure it is the best Forex signals service. You may prefer to trade on this data rather than to open trade on your senses.

    Technicals are usually given along with various risk management strategies. The purpose is to guarantee minimum losses if the plan does not act as it was originally supposed.

    Most online Forex signals have this feature. So, searching for the best Forex trading signal provider can be a much harder and longer task.

    General knowledge of Forex signals may help you in finding the best Forex trading signals provider.


    Forex signals can be received from many firms that have this service. 

    Also, you can get them from top Forex brokers. They provide them with other traders. Forex signal is an impulse for entering a trade on a currency pair, typically at a specific price and time.

    The signal is produced either by a human expert or an automatic Forex robot.

    They must be timely. So you will need some very fast communication. You will receive the signals via email, website, SMS, RSS, tweet or other comparably quick methods. And you can find a lot of them for free. 

    To find the best for you, try to search: best free forex trading signals, free forex signals live, live forex signals no registration, free forex signals providers, free forex signals online in real-time, free forex signals software, etc.

    Services that you get by signing up usually vary from provider to provider.

    You can receive almost anything from performance trackers, email, or SMS alerts, customer support via email or phone and, of course, advanced analysis.

    Forex signal providers must protect their strategies. That’s why trading with them always means full trust, to some degree. More about this you can find HERE

  • Dividend Stock Investing – A Source Of Passive Income

    Dividend Stock Investing – A Source Of Passive Income

    Dividend Stock Investing - A Source Of Passive Income
    If you are looking for an investment that offers steady income, dividend stocks are a good option.
    Start with dividend ETFs because they are the easiest entry point.

    By Guy Avtalyon

    Dividend stock investing may be a good source of passive income. It will not generate a great profit since the average dividend yield is about 3%, but the income will be stable. But even if you don’t have a million dollars to generate significant income, dividend stock investing still can be a good choice.

    So, the first reason to invest in dividend stocks is dividends. You’ll receive a steady and expected income and, also, growing capital over time is the other reason for investing in dividend stocks. Your capital will grow and you’ll have dividends. You can reinvest those dividends in some other stocks or spend as you wish.

    How dividend stock investing is a good choice?

    To put it simply, by investing in dividend-paying stocks you’ll receive the continuous income as long as you are a shareholder.
    Dividend investing has a dual benefit in its nature. Firstly, recurring dividend payments and, secondly, the asset appreciation. 

    For example, you purchased 100 shares of a company ABC for, let’s say $20 each. And you will receive, let’s say, 3% annual dividend. Your capital invested would be $2.000, and your dividend payment $60. And you will receive your payments no matter if the stock price is growing or dropping. As long as the company is able to maintain it, you will receive your dividend payments. 

    Pay attention to high yields

    If you want to invest in dividend-paying stocks you have to be focused on dividend yields.

    If there is a high dividend yield you’ll receive large cash income. That often comes from companies that are not growing fast but have a solid cash flow to support dividend payments.

    Also, pay attention to the dividend growth rate. For example, you found a company that is fast-growing but paying dividends less than average. Since such a company is fast-growing you may expect to gain more from dividends in, let’s say, 5 years than you might get from the company with high dividend yield.

    The companies in the development or start-up stage, usually have a high price-to-earnings ratio and dividend yield can’t be big. But, when such a company expands, for example, opens new stores or similar, the per-share dividends may increase quickly because the profit rises higher.
    That could be great for buy and hold investors.

    Investing through ETFs

    Dividend ETFs give an easy option to start investing in stocks that pay a dividend.

    Since dividend ETF holds hundreds of dividend stocks that provide good diversification of your investment portfolio. As a consequence, you will have safer payouts. In case that some of the companies lower their dividends, you will still have enough, likely you will not even notice that in your total income. ETFs are a really good option for newbies because you will want safe payouts in the beginning.

    Individual dividend stock investing

    You will need time for this because it is more complex than investing through a dividend ETF. But the good thing is that when you buy dividend stocks it is possible to pick those with higher dividends than those you can find them in an ETF.

    What you have to do is to research the company, estimate the safety of the dividend, and finally, decide how much to buy.
    You can find dividend-paying stocks on different financial sites, including the online broker’s site.

    When you analyze the company, pay attention to how healthy it is, meaning, is it able to maintain the dividend payments for a long time, for example, 5 or 10 years. It requires time but you have to do that.

    You have to figure out the payout ratio. Remember, the low payout ratio means the dividend is safer and can grow faster over time. If the payout ratio is over 50%, simply don’t buy that stock.

    Also, you will need to diversify your dividend stock investment portfolio. You have to define how many stocks you want to buy. If the stock is riskier you should hold a smaller part of your portfolio on it.

    The first concern must be the safety of the stock’s dividend. Don’t focus simply on the greatest dividend yields. There is one thing you have to know, if the yield is high that means the investors have some doubts about the company’s ability to pay high dividends regularly. As a consequence, the stock price may go down and you can lose your invested capital. And the dividend will also fall.

    You can buy individual dividend stocks if you like the challenge of picking out the winning stocks. But you must be really good to be able to develop a portfolio of dividend stocks that gives a higher yield. Higher than you could find in a dividend ETF.

    Is dividend stock investing an opportunity?

    For a long-term investor, dividend stock investing is a great way for passive income. The dividends you get can be reinvested and you will have more income.  

    When you notice that dividend yield is more than 4% you have to examine it very carefully. If the yield is over 10% the stock is risky.

    When dividend yield is too high it indicates the payout is not sustainable, or maybe the investors are selling the stock. The share price will be lower in that case and the dividend yield will increase. In the short term, it may be good but for a long-term investment, it is bad for sure.

    Also, if you notice that the company is giving a large percentage of its income as dividends payments, for example, more than 80%, stay away. This isn’t good because it is a sign that the company doesn’t know where to reinvest and assure its future growth. Also, when the payout ratio is too high you can be certain the dividend is unstable and the company has problems sustaining it.


  • Math Guide for Forex Trading

    Math Guide for Forex Trading

    Math Guide for Forex Trading
    Behind Forex trading lies simple mathematical operations easy to learn.

    Okay, math has never been your excellent skill but this math guide for Forex trading will make you clear. The truth is that you are afraid of math and this will help you.

    Anyway, let’s see how simple it can be. There are some mathematical formulas that every trader has to know if he wants to be successful in the Forex market.
    These math concepts are very simple and easy to learn even if you think that math is difficult.

    Change in currency pairs value is estimated in pips. The minimum pip you can see is the fourth digit after the decimal place. The exception to this rule is Yen pairs. The minimum pip there you can see in the second digit after the decimal place.

    Let’s use the hypothetical values in this math guide for Forex trading

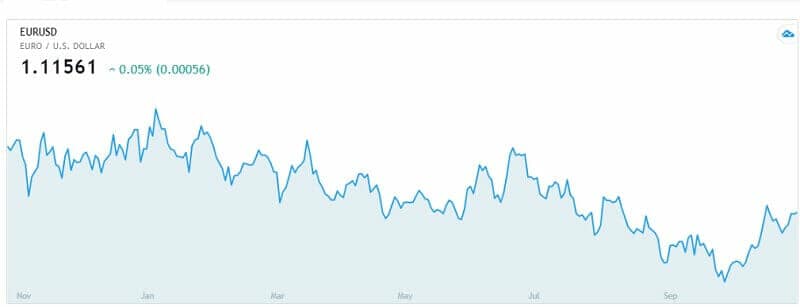
    For example, if the EUR/USD currency pair increases from 1.2530 to 1.32560. It is an increase of 30 pips for this currency pair. In Yen pairs, if the USD/JPY pair rises from 85.20 to 85.40, that is an increase of 20 pips for this pair.

    The value of a pip is different for different currency pairs.

    Let’s use the forex math formula to calculate the pip value of a currency pair:

    Value of a pip is calculated

    1 pip/exchange rate  x trade size

    We are going to use the EUR/USD currency pair with imaginary values.

    One Pip = 0.0001
    Base Currency: EUR
    Exchange Rate: 1.3500
    Trade Size:  1 lot meaning 100,000 units of currency
    Pip Value = 0.0001 / 1.3500  x 100,000 = 7,407 EUR

    How it works on the example on the USD/JPY currency pair

    One Pip = 0.01
    Base Currency: USD
    Exchange Rate: 85.50
    Trade Size:  100,000 units of currency which is  1 lot
    Pip Value = 0.01 / 85.50  x 100,000 = 11.468 USD

    Or let’s see this example GBP/CHF

    One Pip = 0.0001
    Base Currency: GBP
    Exchange Rate: 1.3840
    Trade Size:  100,000 ( 1 lot)
    Pip Value = 0.0001 / 1.3840  x 100,000 = 7.22 GBP

    Let’s talk about probability and numbers to see what lies behind the successful forex trading. Let’s find if a math talent necessary for good trading. We are focused on short-term forex strategies.

    So, this math guide for Forex trading led us to the margin and leverage.

    In Forex trading, leverage provides you to control a larger position. You will use a smaller part of your own funds and the rest you will borrow from your broker.
    Margin is the deposit demanded by your broker. He or she will ask you for a margin/deposit to allow you to open a position.
    Leverage is calculated by math formula:

    Trade Size/Account Size = Leverage

    In this math guide for Forex, here is a realistic example to illustrate this.


    For example, you want to enter the position with a value of $200,000. But you have $ 4,000 on your trading account. Your goal is to control $200,000 with the $4,000 you actually have. 

    $200,000/$2,000 = 50

    Your leverage in our example is expressed as 50:1.

    What will happen if you instead of $4,000 have $10,000?

    You will control $200,000 with the $10,000.

    $200,000/$10,000 = 20

    Your average will be 20:1.

    Brokers can offer from 50:1 leverage for forex trading up to 500:1. But think twice before you accept any offer. It is true that leverage may increase returns but also increase losses.

    Position Sizing

    This is one of the most serious and frequent estimations that you have to make if you want to be a forex trader. Actually, before you decide to enter any trade, you have to calculate the position size.

    We suggest you use one of the simplest calculations. It is a fixed fractional calculation strategy. The best is to risk 1-2% per trade, 1% is better and here is why. Take it as the rule for the fixed fractional risk.

    So, you have to decide how much you can afford to risk a per-trade. When you make this decision you have to decide where to place the stop-loss. 

    Take a look where the most current swings are. Find support and resistance points. When you settle a level where you want to place stop-loss, you have to measure the distance in pips between this level and the entry you plan. Write down that number.

    Then, discover the value of each pip. And you can calculate your position size.

    Math is in this formula.

    current account size x risk per trade/distance between entry and stop x value of the pip

    Let’s say your current account size is $20,000 and the fixed fractional risk per trade is 2%. The distance between entry and stop is 100 pips

    And the value of each pip is $20

    $ 20,000 x 0,2 / 100 x 20 = 0.80 lots

    This is just an example and you will find different situations but the principle is the same.


  • How to Find Big Opportunities in Investing

    How to Find Big Opportunities in Investing

    How to Find Big Opportunities in Investing

    Everyone would like to know how to find big opportunities in investing. That’s the point, right? One of the best ways is to notify where traders are overreacting to the news.

    By Guy Avtalyon

    To find big opportunities in investing, other traders’ extreme fears will help you. For example, traders reacted to news that brokers were cutting their fees. But did you notice a massive rise in their stock price? During the past few weeks, online brokerage stock took hits.

    Let’s go step by step. When Charles Schwab announced it would cut all commissions for all trading, E-Trade, Interactive Brokers and TD Ameritrade fell. This news sent brokerage stocks lower because the traders overreacted.

    In that period, for example, TD Ameritrade (AMTD) dropped from $48 to $33. The other brokerages experienced a decline in stock price too. Interactive Brokers (IBKR) fell from nearly $54 to almost $45, Charles Schwab Corp. (SCHW) dropped from $43 to $35, etc.

    The traders responded to news that brokers are cutting their fees. They had fears about brokerage future without that income and started to sell. But the point is to overcome the fears and recognize the opportunity. When you recognize the bottom in some stocks you actually can see great returns. And let’s take a look at our example again.

    What happened with these stocks a bit more after?

    Charles Schwab moved from $35 to $42, TD Ameritrade moved from $33 to $39, Interactive Brokers stock rose from $45 to $48, etc. How did this happen? There are no tricks. When some stock becomes oversold and gets stretched in one direction too quickly, too far, you will notice bounce back. That is exactly the time when you have to buy the stock. So, you are profiting while others are feeling fears. 

    It is simple to recognize when the stock dropped on extreme fears. How to find those big opportunities in investing?

    Key technical pivot points 

    Bollinger Bands

    Let’s say you noticed that traders picked a moving average of 20 with two regular deviations up and under that average. When a stock reaches or enters the lower zone, you can be sure the stock is oversold.

    RSI and W%R

    Use RSI to confirm the indicators that are higher. The oversold condition will appear when RSI goes to or below its 30-line, also when W%R (Williams’ %R) comes to or up the -80-line the stock is considered to be oversold.

    MACD

    Moving Average Convergence-Divergence is helpful and simple. It helps to confirm the info we get from previously mentioned indicators. MACD is calculated by subtracting the 26-period EMA from the 12-period EMA (Exponential Moving Average). 

    How to identify investment opportunities?

    You will need a bit of magic to find big opportunities in investing.

    These four indicators must be matched with one another if you want this to work. They have to be aligned. And moreover, you don’t want to rely on one indicator. You must have all four.
    So, what we had with brokerages in October this year? Just to be said, we can use other examples, but this is fresh. We saw the stock dropped due to the fees-pricing fight. Though, we saw the precise time of extreme fear and, at the same time opportunity.

    When you see the stock dropped to its lower Bollinger Band, it is a sign that the stock is oversold. Use historical data for that stock and you will find that whenever the lower Bollinger Band is reached or entered the stock turned and bounced back higher from that point.

    Use RSI to find big opportunities in investing

    But you have to check RSI also. Find the confirmation on what Bollinger tells you. If the RSI is a below-set line the stock is oversold. That the confirmation of Bollinger Band’s story. Check this info in historical data to have a sense of how the stock was performing in case it had lower RSI and if the stock moved to its lower Band.
    If you see the stock bounced back higher quickly that is the confirmation and you should buy. 

    And as we mentioned before MACD and Williams’ %R have to confirm the described condition to be sure you can trade with 85% of success.

    Examples of how to find big opportunities in investing

    The list is really endless. Big investments may come fro different fields, different companies. For example, some small but developing company can be a better choice than a famous brand.
    In case you don’t believe this, let’s see what stats tell us. Small companies are the spine of any national economy. That’s the fact. Small companies employ many people, actually the majority. So, it is easy to conclude that the can be a big opportunity to invest in.
    Just keep in mind before you invest in one of them to examine its potential for growth, financial strength. When you go through this process try to find out how passionate management is about business, sometimes that will tell how serious they are about future growth and the company’s future. Especially if you want to invest in some startup.

    Big opportunities in investing can be detected in up to 85% of cases.
    Put all these indicators together with extreme traders’ fears based on news, and you will see how to find big opportunities in investing.

  • Sterling is good, the US dollar is trading almost flat

    Sterling is good, the US dollar is trading almost flat

    Sterling is good

    EUR/USD is by far the most important and liquid pair

    The dollar index closed yesterday’s trading session in the red zone. The Fed cut its main interest rate range by 25 basis points. The central banks of Canada and Japan held the essential marks of monetary policy at the same level. The release of important economic reports is expected.

    Sterling stays good this week and it is possible to have another run at 1.3000 against the US dollar. 

    Sterling is good

    The EUR/USD pair is sitting moderately higher on the day at around 1.1160 levels. It is similar to where it was traded on Thursday during the European morning.

    Prev Open: 1.11528
    Open: 1.11517
    Day’s range: 1.11487 – 1.11688
    52 wk range: 1.0884 – 1.1623

    While buyers are looking to place more upside control with near-term resistance, closer to 1.1179,  the important level to look out for will be the 200-day MA 1.1196 and also the offers holding near 1.1200.

    Traders are currently 51% net-short GBPUSD.


    But wait for the US jobs report later at 1230 GMT.

    Buyers are keeping near-term control since the FOMC meeting concluded but unless they can break the resistance levels above, sellers will look to drive the price back lower in the future sessions.

    For now, large expiries are seen resting at 1.1150 and 1.1200 so that may factor into keeping the price within a more stingy range before they roll off later today. 

    The dollar was lower this morning but now losses are seen. 

    Sterling is good, majors have stabilized. Investors are waiting to see the publication of the US labor market report for October. That could have an important influence on the rate of adjustment of the Fed’s monetary policy. Current economic statements from the United States have been combined. Experts expect a decline in key indicators of the labor market. Presently, the local support and resistance levels on the EUR/USD currency pair are 1.11400 and 1.11750. We suggest opening positions from these marks.

  • UGAZ And DGAZ Stocks – How To Trade Them

    UGAZ And DGAZ Stocks – How To Trade Them

    (Updated October 2021)

    UGAZ And DGAZ Stocks

    UGAZ and DGAZ are ETNs tracking natural gas prices.
    Energy exchange-traded products (ETPs) might be a good trading opportunity as much as energy ETFs.

    UGAZ and DGAZ stock closely watch the US Natural Gas Fund (UNG) and UNG tracks the price movements in natural gas. 

    Let’s make a distinction between those two.

    The main purpose of UGAZ (VelocityShares 3x Long Natural Gas) is to increase the daily performance of UNG by three times. That’s 300%. To make this clear, if UNG price grows 1%, UGAZ will display a daily increase of 3%. The best time to trade UGAZ is when you have a bullish sentiment on UNG.

    The main aim of DGAZ (VelocityShares 3x Inverse Natural Gas) is to generate profits from the losses in the UNG fund. DGAZ will increase the losses by three times inversely. Meaning, if UNG price drops by 1%, DGAZ could bring you a gain of 3%. So, the best time to think about DGAZ is when you have a bearish sentiment on the UNG fund.
    As you can see, both UGAZ and DGAZ have 3:1 leverage. That can notably boost your potential profit.

    Trading UGAZ and DGAZ

    If you want to trade them, it’s vital to watch the UNG fund. UNG fund is the basis of ETF that runs both of them. This can be a complex fund but you can go short in the long term and consider both UGAZ and DGAZ. Natural gas is a highly volatile commodity and UNG is not straight associated with natural gas in the physical sense. So, UNG isn’t a clever investment if you keep in mind it fell by more than 90% after its start. Also, it doesn’t pay dividends. Instead, UNG uses future contracts and OTC exchanges to find and copy the natural gas price. It doesn’t hold stocks. So, we can say that UNG isn’t a good investment by itself. There is where UGAZ and DGAZ come to the scene. If you don’t care for dividends and just want to keep the position for a short-time the long-term volatility of FUNG will not affect your investment.

    As we said, UGAZ increases the UNG gains, while DGAZ goes up when UNG falls in price. But keep for the short-term, as long-term holding is never recommended.

    UGAZ and DGAZ trading opportunities

    These products can be risky. Well, you have to follow the news as ETNs give 3-time leverage in a single day. As we said, when the natural gas price rises by 1%, UGAZ will rise by 3%, and DGAZ will fall by 3%. To repeat, if you want to hold UGAZ or DGAZ the percentage performance will oppose your expectations.
    A lot of circumstances may influence these products. For example, politics, global economy, supply and demand, weather, interest rates, and many others.
    The way to trade USO or UNG is to trade options. That will allow you to achieve better risk-reward levels. The profit potential could be tremendous.

    Bottom line

    If you look at the historical data you will find peaks over winter, for example, but also, sometimes the price can make a sharp move down.
    Why does this happen? The natural gas price depends on weather forecasts. So, you have to watch that. If you see the meteorologists are expecting a warm winter you can be sure the demand will be lower. So, pay more attention to DGAZ.
    The other factor that may influence the gas price is the change in natural gas supply. So, you have to keep attention on weekly natural gas storage reports.
    Both will give you the future course of the natural gas price. And, to add more pain, remember, UNG isn’t always successful while mimicking the gas prices. You have to be ready for the UNG price failure.
    UGAZ is a tactical trading tool. It provides 3-time exposure to its reference index, the S&P GSCI Natural Gas Excess Return Index. This ETN is not designed like a buy and holds an investment. The return can differ hugely from its initial exposure.
    It consists of complex effects and extreme concentration on quick period natural gas prospects.
    DGAZ is the inverse product, it is intended to be a tactical trading tool, not a buy-and-hold investment. It is for a one-day holding period.