Tag: trading

All trading related articles are found here. Educative, informative and written clearly.

  • Artificial intelligence and machine learning we can apply on the financial markets

    Artificial intelligence and machine learning we can apply on the financial markets

    What is artificial intelligence and machine learning and can we apply it on the financial markets?How can we apply artificial intelligence to the financial markets

    By Guy Avtalyon

    What is artificial intelligence and machine learning and can we apply it to the financial markets?
    It took us 3 and a half years of research and development until we finally reached a point we can trust our software.

    Obviously you can find all sort of information on the internet about machine learning and AI, like these articles on Wikipedia for example, but the concept is quite simple: You run an algorithm (there are many) on the set of data, and once the algorithm is finished, the software will know how to run by itself on new sets of data, even if it’s never been seen.

    There are 2 types of algorithm methods –

    1.       Supervised – Similar to training a dog: if it does good you pet them, if it does wrong you scold at them. After a while, they will learn how to behave
    2.       Unsupervised – This is the most interesting algorithm out there. This means you give the algorithm a set of data but you DO NOT tell it what is wrong and what is good. It does it by itself.

    So, can you apply those algorithms in the financial markets?

    First, let’s start by learning a bit about how ML (Machine Learning) and AI (Artificial Intelligence) work and its purposes.

    To create simple computer software, we need to insert some scenarios we want it to handle, we add the way we’d like the software to act, and let it run.

    A “stupid” software will ONLY KNOW HOW TO WORK according to the scenarios we entered and taught it.

    An AI software will take the same scenarios we entered and ways to behave we told it to, and will be able to do it NOT only on the ones we told it to but also on SIMILAR scenarios.

    This is basically why AI and ML are the future in any way you can imagine – Because it’s not limited to what the programmer writes in the code, but also it can adjust and act to things that aren’t inside its code and also, over time, will be smarter in handling situations only by itself.

    OK let’s go back a bit

    Scenarios? Ways to behave? WHAT??

    Say we got a lifetime doctor’s records of some people. They are anonymous, of course, because we don’t care who they are. We only care about their DATA.

    Now we want to find something, like, maybe, can we find cancer disease BEFORE the person knows it’s happening – or in other words – Can we predict cancer?

    We can check – are they the cigarette smokers? If yes, how many had cancer?

    This has been the way until now.

    You probably can already guess why it’s not merely enough.

    If they don’t smoke – does that mean they won’t have cancer? We already know it’s not true.

    And sadly there’s a variety of cancers to almost every organ in the human body (cancer is when some cells of our own body stop dying unlike the other cells and the body starts to attack them. Basically, nature makes our body suicide from inside).
    So what can we do if we want to predict cancer?

    It’s simple – We take into consideration as many parameters we can. Like:

    Age, gender, place of living, place of working, family history, doctors’ appointments, and medical record, food and drink habits, etc.

    Those are the objective data.

    We need also subjective data such as happiness in life, the scale of pressure, type of person, etc.

    Once we have ALL this data for every person, we need to do 3 things:

    1.       Check which one of the parameters can, in fact, be some kind of prediction to cancer
    2.       Run a statistics machine learning algorithm (like Naïve Base)
    3.       Use the results to solve a worldwide problem  

    We wish, right?

    Now we get on to the problems of artificial intelligence (AI) and ML:

    1.  Data

    Data is extremely difficult to collect, and then to manipulate. In our example to get these data, we need to cooperate with medical services to get their clients’ data, create a questioner, and send it to all the clients and analyze the data. Though there is such cooperation around the world, it’s still not easy to also get subjective data.

    1. Analyzing big data

    Big data has become a known word around the world.

    There was a time companies said they work with big data and clients threw the money at them.

    But it’s not that simple. Every data you add for the algorithm to learn from – increases exponentially the time for the software to analyze…


    Inefficient software may take a very LONG period of time to run.

    Funny personal anecdote, our first AI software we developed to learn how to predict price changes in the stock market looked so genius at first, but after we started running that artificial intelligence and measuring the time it will take to finish, we saw it will take no less than 27,000,000,000,000,000 years from now(!!) Obviously, we couldn’t wait, and in future articles, I will explain how we lowered it to only a few hours running time.

    Let me give you an example of the difference between Big Data and just simple data with a game:

    I chose a number between 1-1000. You have to guess which one is it. But there’s a catch – you need to find the number in as little time possible. How would you do it?

    Think about it for a second.

    Got a solution?

    If you guessed that you should ask me “Is it higher than 500?” and then according to my answer (If I chose the number “990”), the answer is yes. Then your next question will be “Is it higher than 750″… You get the point.


    That’s easy, right?

    What if you got a number with 80 digits? Then it might take a long long time until we break this number, maybe even months. And that’s only one running time. What if we need it to create strategies for trading and investing and we need it to go over millions of possible strategies?

    It will take a lot of time.

    As humans, we can’t really comprehend really big (or small) numbers. Like these two questions, I like to ask people once I talk about large numbers.

    1.       If 1 million seconds is 12 days, how much time is 1 billion seconds?
    2.       And, if your salary is $100,000 each month, how long will it take until you reach 1 billion dollars (say you can save all of it each month)?

    You can easily calculate it, but it’s an intuition question, not a math one. Think for yourself, what’s your intuition answers are? The answers will be later on in this article.

    So we’ve talked about what’s machine learning algorithm and a bit on big data problems.

    Now, can we apply artificial intelligence to the financial markets?

    In short, yes.

    But it’s easier said than done.

    It took us 3 and a half years of research and development until we finally reached a point we can trust our software.

    Because other than the ML and big data problems, we face a whole different problem in the field of financial markets, since they act like in a chaotic environment it makes predicting a lot harder.

    And, (and it’s the most important and) because of the spread whenever you enter a position you face an average of 56% against you.

    That’s probably the time to say there are two kinds of players in the financial markets:

    1.       Investors – They invest their money for years ahead and they gain the average rate the market makes (around 8% a year). By the way, according to decades of studies, there’s one stock that if you’re an investor you should put all your money on, and that’s the S&P500 stock (Symbol SPY). In another post, I’ll prove this fact.
    2.       Traders – They usually use time limit (options) or profit/loss lines (if it reaches +X get out with a profit and if it reaches -Y get out in a loss)

    We are on the traders’ side.

    We want to gain more money, faster, and more chances of getting out in time.

    But unlike investors who buy now and then forget about it, as traders we must beat not only the commissions our broker offers us but also the spread (the difference between the lowest price a seller is willing to sell and the highest price a buyer is willing to buy). The spread is usually set by the broker and it’s one of the best ways for a broker to gain profits.

    So, we also know that like in gambling the house always wins, so as in the financial markets – the broker’s always gaining profits.

    Back to our financial algorithm – we found a broker service that lets us collect the financial data, and we’re saving it. Now, we need to analyze it to find patterns. But how?

    In an everyday changing environment, how can we rely on anything? 

    We solved that problem by relying on our algorithm on behavior analysis. We figure that even though the market can change, the forces that control it (the investors and traders) will stay the same (Obviously, they change too, but way slower).

    So we’re talking about collecting on average millions of data and parameters a day for each stock. Once we try to collect 1000 stocks for a few years time you can imagine how much data is inside, so it’s just a matter of creating a super-fast unsupervised machine learning algorithm with only one rule: The most money you can make is the better – and let it run and find the best way to trade by itself.

    Creating artificial intelligence

    In conclusion, it is possible to create an automatic software or some artificial intelligence to trade for you in the financial markets, but it’s EXTREMELY difficult. You need to overcome many problems in serval fields in order to do it. And after you do it, it’s unlikely that you will let anyone use it.

    But we’re different. We will let our subscribers use our algorithm for free, just to have a sense of how it works.

    Subscribe now to get more information about artificial intelligence in the financial markets and to get informed once our algorithm is ready for outside users.

    Our software will let you choose which assets you want to buy, and when – and it will tell you when to get out. Simple, yet important.

    By the way, the answers to the question before are:

    1.       One billion seconds are 32 years
    2.       It will take 830 years to gain one billion dollars if your salary is 100K per month

    Was that your intuition?

    Sign up below to our newsletter for a free test drive on our trading algorithm! Find more about artificial intelligence.

    Top Image Credit: Photo : iStock/MF3d


  • Capitulation of Bitcoin?

    Capitulation of Bitcoin?

    2 min read

    BITCOIN MINING EXPLAINED: HOW IT WORKS, HOW MUCH ENERGY IT USES AND WHAT NEEDS TO BE FIXED
    The bear market has seen the price of bitcoin decline more than 75% from all-time highs set in January. It is defined as a period of depressed activity and sentiment. A total of $60 billion has been erased from the value of all cryptocurrencies over the last week. That’s why many are wondering if the ongoing bear market for the asset class has finally come to an end.

    Bitcoin makes up more than 50% of the entire cryptocurrencies market, in terms of total capitalization. Our prediction is that the bear market may end when bitcoin bulls refuse to cede more ground.

    In the same period, traditional assets were down too. DOW had worst Thanksgiving week since 2011, oil is down 30% in 7 weeks, FAANGs (Facebook, Apple, Amazon, Netflix, and Google) is down almost 40%.

    But somehow, for many people, FAANGs get more attractive as they fall and Bitcoin gets less.

    Markets reverse

    Markets can be reversed in three ways: by the following capitulation, by following a strong trend-setting upwards break, by slowly rolling over reversal which is the hardest.

    Alex KrĂźger, economist and trader tweeted:

    ”Bitcoin crashed hard in the last month, yet the market has not seen capitulation yet. Market direction is uncertain.

    Trying to figure where will the market stops falling, its bottom, is beyond fruitless. Those charting and calling bottoms are best ignored.

    Capitulation of Bitcoin?
    BTC has extremely well-defined resistance areas.

    Books are so empty and volume so low that a whale can make a >5% pop/drop within a few hours.

    I’d expect more 2-way action now and still lower lows eventually.

    Wouldn’t be surprised to see 8200 within weeks.

    A $BTC ETF will launch, making crypto go viral again.

    Security tokens will go mainstream.”

    What is capitulation in the market?

    Capitulation is marked by extreme panic selling, consisting of extreme selling over a short time period. It is backed by high volume that builds momentum until an eventual “bottom” is found. The bottom is a price level where the asset looks too cheap or undervalued to investors for them to allow it to fall any further. In order for a true bottom to be found, many claim a capitulation needs to take the place because it is traditionally the last stage of a prolonged bear market. It’s difficult to consider something to have officially capitulated until after it has occurred. By looking at previous capitulation stages and market bottoms for bitcoin, there are a few similar signs traders and investors can watch out for. That may refer to an official market bottom. 

    Market conditions aren’t the same as they have been in past years. Bitcoin’s 2017 boom has brought new attention. Traders and investors who are left wondering if the asset can ever return to its former glory.

    Such an event can be measured and understood in real-time. But in order to predict bitcoin’s future, taking a look at its price history is perhaps the best place to start.

    It’s not an exact science, and there’s no guaranty history will ever repeat. That said, observing the bitcoin’s past price action yields three possibilities for potential market reversal worth of being discussed and considered.

    If there’s no bitcoin ETF approval, one could argue there’s no reason for bitcoin to resume its bullish uptrend until a market bottom occurs like it did in 2014-2015.

    Bitcoin falls under $4,000

    After days of stagnating at the $4,200 price level, on Saturday afternoon (EST), Bitcoin (BTC) suddenly fell under $4,000, a highly-touted level of support for the cryosphere’s foremost asset. It wasn’t clear why this bout of selling pressure occurred.  But within minutes, sell-side orders pushed BTC (on Coinbase) under $4,200, then $4,100, then $4,000, all the way to $3,800, where the digital asset is situated at the time of writing. Of course, this is worrying. It seems that a temporary floor has been found at $3,800. Crypto traders mentioned this key level before. It is unclear whether there was a catalyst that triggered this sudden loss of support, sending BTC plummeting into its third freefall in a week’s time.

    This rapid 10% loss can be caused by a number of supposed catalysts: the aftermath of the Bitcoin Cash’s November 15th fork, an influx of institutional selling orders, the Bakkt Bitcoin futures vehicle delay, regulatory measures from the SEC, and, arguably the most convincing, the final bout of capitulation from crypto’s “weak hands”.

    Many traders exclaimed that they didn’t expect to see BTC foray under $4,000 ever again.

    The fact of this most recent move downward is that many believe crypto’s bear market isn’t done yet. At least not until a bottom of $3,000 is reached, which is claimed by many traders, including Tone Vays, Anthony Pompliano, and other lesser-known yet knowledgeable industry analysts. That could mean that the $3,000 zone would be a good time to start accumulating.

    The bottom line

    If the current ascending trend line breaks, the price may not find its “bottom” until reaching the high of the prior “mega” bull run, which in this case lies in the $1,200 area. If prices fall to this level, the last hope will be to find new rising support for the entire “bull cycle” to repeat.

    Risk Disclosure (read carefully!)

  • Cryptocurrency Market – How It Works

    Cryptocurrency Market – How It Works

    Cryptocurrency Market
    This market is in permanent growth, its volatility and unpredictable liquidity are a reality.

    By Guy Avtalyon

    The cryptocurrency market has been segmented into mining and transaction, based on the process. In the mining process, there is a greater necessity for hardware than it is a case in the transaction process. Therefore, the market for hardware for the mining process is larger than that for software. Furthermore, a miner can take part in this process with a small investment.

    Cryptocurrency is used for various applications, such as trading, remittance, and payment. These applications drive the market for cryptocurrencies.

    Trading the cryptocurrency market

    Cryptocurrency trading cover exchanging fiat currency with crypto. Also, it refers to exchanging, buying, and selling of cryptocurrencies. It meets some similarities of foreign exchange or forex wherein fiat currencies we can trade 24 hours a day. The number of cryptocurrencies has increased exponentially; currently, there are more than 1,500 cryptocurrencies available. Some of these coins can only be vested using major cryptocurrencies such as Bitcoin or Ethereum. To contribute to initial coin offerings (ICOs), one needs to perform trades or use a blockchain company’s services.

    A large number of players are investing in developing payment gateways and platforms for the payment process of their currencies. When a customer makes a purchase using a cryptocurrency as payment, the transaction often goes through the payment gateway at a fixed exchange rate. It automatically converts to traditionally recognized fiat currency so the merchant can avoid the volatility of the cryptocurrency markets. The payment through cryptocurrency has several advantages. Enhanced transactional security, protection from fraud, decentralized system, low fees, quick international transfers.

    Why invest in the cryptocurrency market?

    Volatility and unpredictable liquidity are a reality of the cryptocurrencies market. You could have made tons of money if you had invested in bitcoin earlier but you would’ve lost a lot of money if you had started investing in the last few months. Because when investing in cryptocurrencies, many traditional assumptions fall flat. Managing risk in financial markets is a well-established discipline. Whether investing in equities, bonds, or currencies usually practices protect market practitioners when they are buying, selling, or intimidating. Risks are typically aligned into different categories. Market risk, credit risk, and operational risk, and complex formula are used to determine how much capital should be kept in reserve to absorb losses. The historical progress in bitcoin has increased risk appetite both for existing and newer traders. It comes with the realization that even a small exposure to cryptocurrencies could turn out to be lucrative.


    The cryptocurrencies market is still developing. There are concerns about the potential for fraud and market manipulation. So, investors must take the necessary precautions. These individual risks are much more difficult to measure and manage when investing in cryptocurrencies.

    Institutional demand for digital currencies 

    So far, most institutional investors, including banks, insurance companies, pensions, and hedge funds, have avoided cryptocurrencies. But, that attitude is beginning to change and institutional investors will soon be entering the market in a major way.

    This year (2018) has been challenging for crypto investors. Global market capitalization fell amidst worries over fraud risk, escalating token issuance, and ever-shifting cyber-security threats. Accusations of market manipulation and concerns around potential naked short selling are also doing little to lessen institutional investors’ concerns about cryptocurrencies.

    The effect in the market

    Every big trader can exploit market illiquidity and shifting margin rules and contract limits at inexperienced cryptocurrencies exchanges. This causes a domino effect in the market and institutional investors rather stay away. The complexities and shy institutional uptake for the new cash-settled bitcoin futures products demonstrate that. But the industry must move towards a futures contract that is settled with proper warehousing standards.

    Counterparty risk and custody provisions are even bigger worries for institutional investors. Although cryptocurrency exchanges are significant new platforms, they have been largely designed by the younger generation of developers. Financial institutions care more about the return of capital rather than return on capital. They are wary of the professional indemnity behind these platforms. We believe that now’s the right time for institutional investors to look seriously at making investments into cryptocurrencies. They should take part in the cryptocurrencies market.

    Cryptocurrency market – potentially unlimited upside

    The unpredictability of risk and the potential for high returns is the main characteristic of cryptocurrencies market. The most intelligent approach for new investors might be to hold a very small proportion of their portfolio in cryptocurrencies. This would give some exposure without excessive risk as the market continues to mature.

    By the end of 2017, a lot of portfolio managers had to explain to their clients why they had only achieved single-digit returns in traditional asset classes. At the same time, some crypto funds had earned up to 2,000 percent from volatility. This shows, there is a little downside from investing 1% of the portfolio in cryptocurrencies, but the potential upside is almost unlimited.

    The cryptocurrency market continues to attract new participants and liquidity should improve. This will take the time that’s the truth. Within a couple of years, cryptocurrencies will become a standard part of a diversified portfolio.

    The stock market has a rich and mature history. It has seen many bubbles, market crashes, and economic recoveries. The growth of the cryptocurrencies market continues. If traditional stock exchanges continue to keep away from cryptocurrencies, they’ll miss out on a growing and profitable market.

    Finally, the financial crisis of 2008  actually gave birth to Bitcoin.

  • Margin Trading Definition

    Margin Trading Definition

    2 min read

    Margin Trading Definition
    Margin trading isn’t without risks involved, so pay more attention to it

    Margin trading is simply the process where investors buy more stocks than they can afford to. It also refers to intraday trading in India and various stockbrokers provide this service. It can increase your profits on the upside, but also expand your losses on the downside. Margin trading means buying and selling stocks or some other assets in one single session. This process requires a trader to guess the stock change in a particular session. It is an easy way of making a fast buck. It is now accessible to even small traders.

    What is margin trading?

    Margin trading is also called buying on margin. It is a method of buying shares that involves borrowing a part of the sum needed from the broker executing the transaction. The collateral for the loan is normally securities in the investor’s account. The trader has to deposit an initial amount of cash or securities into a margin account with the broker. And has to keep a minimum amount of cash or securities in the account as collateral. If the balance of a margin account falls below the minimum maintenance amount, the broker makes a margin call to the trader for the funds needed. Margin balances can be adapted to follow market values by adding or subtracting variation margins.

    What is buying on margin?

    Buying on margin gives the investor leverage as any capital appreciation or dividend income is on the total amount purchased. Even after the amount borrowed has been repaid to the broker, with interest, the investor could still be better off than if he/she had personally financed the purchase of a smaller amount of shares. That depends on how much the shares gain and how much they yield. There are some risks with margin trading – if the shares fall in value, the investor suffers a capital loss while also facing potential margin calls from the broker.

    An example of margin trading

    Margin trading is meant for traders who are looking for a simple way to increase their earnings. And also, they have a reasonable level of risk appetite but do not have enough capital.
    Let’s say you are 100% bullish for the big company and believe the stock is going to pick up.  You want to buy 1000 shares of that company and each share is priced at $200. You would need a capital amount of $200,000 to enter that position.
    Assuming you have $150,000 and want to borrow the rest of the capital. With margin trading, your broker can help you with the rest of the funds while charging you a specific interest percentage.

    How does margin trading work?

    The whole process is quite simple. Margin trading is legal buying stocks or other securities, but instead of your own money, you borrow it from your broker.
    Think about buying stock on margin as buying a house with a mortgage. A margin account provides you the financial support to buy more stocks than you can currently afford. For this purpose, the broker will lend you money to buy shares and keep some amount as collateral.
    If a trader wants to trade with a margin account, the first requirement will be to request a broker to open a margin account. This requires paying a specified amount of money upfront and in cash. That is so-called the minimum margin. If a trader has a losing bet and ends in losses, and fail to pay the debt, the broker will get it out from the margin account.
    When you open the margin account, you’ll have to pay an initial. This is a specific percentage of the total traded value and pre-determined by the broker. Before you start margin trading, you need to keep in mind these important steps.
    First, you need to secure the minimum margin (MM) through the trading session. The reason behind this: if the stock is very volatile, the price can fall more than you had expected.
    Second, the broker has the right to ask you to increase the amount of capital you have in your margin account. Also, the broker has the right to sell any of your securities if feels its own funds are at risk. The broker can even sue you if you don’t fulfill a margin call or if you are carrying a negative balance in your margin account.

    Margin trading if the stock price goes up

    This is the best outcome for you.  Let’s do some math (I adore math).

    Say you bought 100 shares for $4000. But you had $2000 and broker loans $2000. If the price goes to $50 per share, your investment will be worth $5,000. Your outstanding margin loan will be $2,000. If you sell, the total proceeds will pay off the loan and leave you with $3,000. Because your initial investment was $2,000, your profit is a solid 50%. Your $2,000 principal amount generated a $1,000 profit. However, if you pay the entire $4,000 upfront without the margin loan your $4,000 investment will generate a profit of $1,000, or 25 percent. By using a margin, you could double the returns.

    The stock price fails to rise

    If the stock stays at the same price, you still have to pay interest on that margin loan. You are in a better situation if the stock pays dividends because that money can pay some of the costs of the margin loan if not all. In other words, dividends can help you pay off what you borrow from the broker.

    Margin Trading 1
    When the stock doesn’t change in price it is a neutral situation, but you’ll pay interest on your margin loan for each day. Margin trading can be a good plan for traditional investors if the stock pays a high dividend. Many times, a high-payed dividend, for example, $5,000 worth stock, can exceed the margin interest you have to pay. For example, if you had $2.500 and you borrowed the other $2,500, which is 50% of stock’s value. But you expect to receive $3.000 as a dividend, so you’re safe.

    Margin trading when the stock price goes down

    If the stock price drops, buying on margin could work against you. What if the price in our example goes to $38 per share?
    The market value of 100 shares will be $3.800. So, your capital will shrink to just $1,800 because you have to pay your $2,000 margin loan to your broker. This isn’t real trouble at this point, but you should be cautious. The margin loan is 50% of your investment. If it goes lower, you may get the margin call. The broker will demand you to keep the ratio between the margin loan and the value of the securities the same as it was when he lends you money. That’s why margin trading can be very dangerous.

    How to maintain the balance in margin trading?

    When you buy stock on margin, you must maintain a balanced ratio of margin debt to equity of at least 50 percent. If the debt portion exceeds this limit,  you’ll be required to restore that ratio by depositing either more stock or more cash into your brokerage account. The additional stock you deposit can be from another account. If you can’t come up with more stock, other securities, or cash, you have to sell stock from the account and pay off the margin loan. For any trader, it means having a capital loss. For you also, because you lost money on your investment.

    The bottom line

    As you can see,  the margin can increase your profits on the upside but also increase your losses on the downside. If your stock drops drastically, you can end up with a margin loan that exceeds the market value of the stock you used the loan to buy. In the bear market of 2000, for example, many people realized stock losses. The majority of these losses came as a consequence because traders did not manage properly the obligations associated with margin trading. To avoid this kind of problems you must have sufficient reserves of cash or marginable securities in your account.
    For example, buying dividend yields that exceed the margin interest rate could be the right choice so the stock could pay for its own margin loan. Just keep in mind to set up your stop-loss orders. Your goal is to make money, and paying interest could eat your profits.


  • What is a Trade and how to Trade

    What is Trade
    To understand what is the trade we must have some historical and economic facts in our minds.

    By Guy Avtalyon

    What is trade? For some of you, this question may seem like nonsense. But, do we all know what is a trade for sure? So, let me explain this. Trade is a basic economic concept that involves the buying and selling of goods and services. Trading points to the buying and selling of securities, for example, buying and selling stock.
    Answer to this question could be: Trade is a transfer of goods or services in return for money, services or goods. In other words, trade refers to give and take. In the old days, trade took place with the exchange of goods without the exchange of money. With the invention of money, the trade appeared as an exchange of things for money.

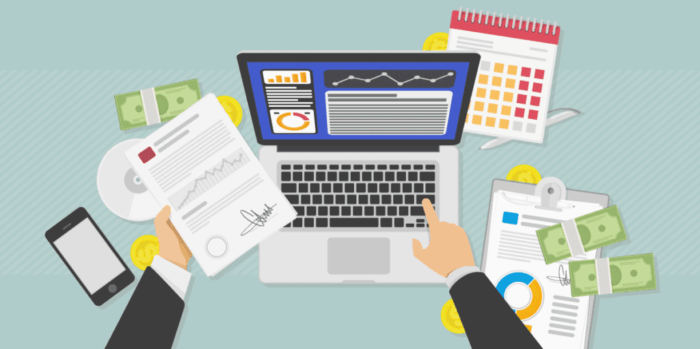
    Trade is buying and selling on stock market transactions with the help of stock market brokerage houses. To trade in capital markets, one has to learn technical analysis first. Then apply those learned technical analysis concepts through paper-trading for a few weeks then open a trading account thru a broker and slow start the first real trade.

    Everybody knows what the term “trade” means. We are trading in our everyday life, while we may not even register that we have done so. Basically, everything we buy in a market is trading money for the goods we need.

    So, what is the trade?

    The word “trade” simply means “exchange one thing for another”. We normally get this to be the changing of goods for money or in other words, simply buying something. The same principle is applied when we trade in the financial markets. Let’s say someone trades shares. What traders and investors are really doing is buying shares of some companies. When the value of the shares rises, they will make money if sell them at a higher price. This is trade. You buy something for one price and sell it again for another, hence making a profit or loss.

    Why traders trade

    Every single trader is buying the shares in the hope that the price will rise. But why would the value of the shares go up? The answer is simple: the value changes due to supply and demand, meaning the more demand there is for something, the more people are willing to pay for it.

    Trade is conducted not only for the sake of earning a profit; it also provides service to the consumers. Trade is an important social activity because society needs an uninterrupted supply of goods forever increasing and ever-changing but never-ending human wants. Trade exists from the beginning of human life and will obviously last as long as human life exists on the globe. It enhances the standard of living of consumers. Thus we can say,  answering the question of what is the trade, that trade is a very important social activity.

    The examples of what is a trade

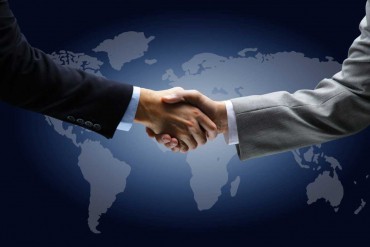
    Trade is when two parties agree on the price of a financial instrument but they perceive it’s valued differently.

    For example, say, trader A wants to buy stock with the current market price of $800. So, when trader A buys a stock at $800 there is a seller trader B at the same price. Hence, both of them have an agreement at the price of $800. But the buyer, trader A values is higher than the seller, trader B at that point.

    Let’s say that suddenly the owner of another stock comes into the market and has even more stocks to sell. The supply of stocks has now increased dramatically. Now, it’s reasonable to expect the second trader will want to sell that stock at a lower price than the first one to attract the other traders to buy that stock. And such will be right. The other traders would reasonably want to buy at the lower price, why not. Let’s see what happened with the first trader. The first trader will lower the stock price also.
    Can you see how the sudden increase in supply has brought the price of the stocks down?
    When the asset’s price at which demand matches supply is known as the “market price”. In other words, that is the price at which traders agree on both sides, sellers and buyers both.
    Trade is executed with the payment of money, the transaction of goods and services, or virtual currency.

    What is the trade of virtual currencies

    Those who want to trade cryptocurrency should start by picking a company with a good status that gives an exchange and wallet. The beginners should start by trading leading coins. Currently, we are referring to coins like Bitcoin (BTC) and Ethereum (ETH). In the future, this could change.

    Cryptocurrencies are still new to some people, so trading in this novelty can certainly generate good outcomes. But it is important that you know very well what any virtual currency gives and know the features of each coin. It is necessary for you to make trading informed decisions, evaluating carefully the risks/benefits of each coin. Using a reputable cryptocurrency exchange platform could support you in order to take the best possible of cryptocurrency trading.

    Virtual currencies

    Virtual currencies do not expose holders to foreign exchange risks and provide anonymity between trading partners.  Some online resellers provide buyers to conduct their transactions using virtual currencies. If you want to trade cryptos you can also find platforms that convert virtual currencies into gift cards. Virtual currencies are often popular with small businesses, because of the lack of processing fees.

    Trading cryptocurrency isn’t hard to start, but there are some basic aspects to understand before you start trading with a wallet-exchange.

    The main thing to note is that there are countless options for setting up wallets and trading currency.

    The bottom line

    When we ask what is the trade we should have some historical and economic facts in our minds. The process of economic specialization and trade leads to much higher levels of production of goods and services. It is this process that creates and sustains the markets of the “free market” system. The development of this system brought about the dramatic and revolutionary improvements in living standards that characterize the modern age.
    Free and open trade has fired competition, innovation, and economies. It allows individuals and businesses to take advantage of lower prices and increased choice. As a consequence, millions of people all over the world have overcome the restrictions of subsistence farming and severe poverty that defined the lives of most of humankind during history.


  • Stock Options Everything You Need to Know

    Stock Options Everything You Need to Know

    Stock Options
    The stock options give the holder the right, but not the obligation, to buy (or sell) 100 shares on or before the options expiration date.

    By Guy Avtalyon

    Stock options are financial instruments. That can provide the investor with the flexibility need in almost any investment situation.

    Stock options are contracts that convey to its holder the right, but not the obligation, to buy or sell shares of the underlying security at a specified price on or before a given date. After this specified date, the option stops to exist. The seller of an option is, in turn, obligated to sell (or buy) the shares to the buyer of the option at the specified price upon the buyer’s request.

    The stock options give the holder the right, but not the obligation, to purchase (or sell) 100 shares of a particular underlying stock at a specified strike price on or before the option’s expiration date. The seller of the option is one who grants this right.

    You can recognize two kinds of stock options: American and European. American options are different from European options. The European options permit the holder to exercise the option only on the date of expiry.

    How do stock options work?

    All options are derivative instruments. That means that their prices are derived from the price of another security. More precisely, the underlying stock price will determine the options price, it is derived from the stock price.

    As an example, let’s say you purchase a call option on shares of Intel (Nasdaq: INTC)  with a strike price of $40 and an expiration date of April 16. This option gives you the right to purchase 100 shares of Intel at a price of $40 on or before April 16th. Of course, the right to do this will only be valuable if Intel is trading above $40 per share at that point in time.

    Every stock option represents a contract between a buyer and a seller. The seller has the obligation to either buy or sell stock to the buyer. Of course, at a specified price by a specified date. The buyer, on the other hand, has the right but not the obligation, to execute the transaction. On or before a specified date. If it isn’t in the best interest of the buyer to exercise the option when it expires, the buyer has no further obligations. The buyer has bought the option to execute a transaction in the future. Hence the name – option.

    What is underlying security?

    The particular stock on which an option contract is based is usually known as the underlying security. Stock options are categorized as derivative securities because their value is derived in part from the value and characteristics of the underlying security. A stock option contract’s unit of trade represents the number of shares of underlying stock which are covered by that option. The stock options unit of trade is 100 shares. This indicates that one option contract signifies the right to buy or sell 100 shares of the underlying asset.

    What is the strike price?

    The strike price, or exercise price, of stock options, is the specified share price at which the shares of stock can be bought or sold by the holder, or buyer, of the option contract. To exercise your option is to exercise your right to buy or sell the underlying shares at the specified strike price of the option.

    The strike price for an option is initially set at a price that is reasonably close to the current share price of the underlying security.

    What is the stock options contract?

    A stock options contract is defined by the following elements: type (put or call), style (American, European and Capped), underlying security, a unit of trade (number of shares), strike price, and expiration date. All stock options contracts that are of the same type and style and cover the same underlying security are referred to as a class of options. All stock options of the same class are referred to as an option series. They have the same unit of trade at the same strike price and expiration date

    Stock vs stock options

    The difference between stocks and stock options is that stocks give you a small piece of ownership in the company, while stock options are contracts that give you the right to buy or sell the stock at a definite price by a particular date. There are always two sides to every option transaction: a buyer and a seller. For every call or put option bought, there is always someone else who is selling it. Many traders think of a position in stock options as a stock surrogate that has a higher leverage and less required capital. They can be used to bet on the direction of a stock’s price, just like the stock itself. But stock options have different characteristics than stocks.  And there is a lot of terminologies that options traders must learn.

    What are Put and Call?

    A call is the option to buy the underlying stock at a predetermined price by a predetermined date. The buyer has the right I explained above. The seller of the call who is also known as the call “writer” is the one who has the obligation. If the call buyer decides to buy, the call writer is obliged to sell shares to the call buyer at the strike price. A call option contract grants its holder the right to buy a certain but specified number of shares of the underlying stock. That right has to be executed at the settled strike price on or before the date of the expiry of the contract.

    For example, you bought a call option on ABC company with a strike price of $40, expiring in two months. That call buyer has the right to exercise that option, paying $40 per share, and receiving the shares. The writer of the call would have the obligation to deliver those shares and receive $40 for them.

    Put options are the options to sell the underlying stock at a predetermined strike price. Until a fixed expiry date. That put buyer has the right to sell shares at the strike price. And the put writer is obliged to buy at that price.

    Calls and puts, individual, or in combination, can provide different levels of leverage or protection to a portfolio.

    What are employee stock options?

    Many companies issue them for their employees. When used appropriately, these options can be worth a lot of money for you. With an employee stock options plan, you are offered the right to buy a specific number of shares of company stock.

    All employees’ options have a vesting date and the expiration date. It’s impossible to exercise these options before the vesting date or after the expiration date.
    You’ll recognize two types of stock options companies issue to employees:

    NQs – Non-Qualified Stock Options
    ISOs – Incentive Stock Options

    With a non-qualified type, taxes are taken from your gains after you exercise the options. However, keeping too much company stock is considered risky. For example, if the company has financial problems, your future financial security could be in danger.

    When long-term investors want to invest in a stock, they usually buy the stock at the current market price and pay full price for the stock. An alternative is to use stock options. Buying them allows you to leverage your purchases. Far more than is possible in even a margined stock purchase. In several investment situations, it might make sense to invest in stock options. Hence, rather than the underlying stock. Note,  the basic fact of stock options trading. You are highly leveraging your investment. And it means your investment risk is also substantially increased.

  • Types of Trade

    Types of Trade

    3 min read

    Types of Trade 3

    • Study your previous trades and recognize the types of trade you were entering.

    Regardless of personal experience in trading, conversations and exchange of views with other traders are valuable. In one of such conversations, the topic was the types of trade. After many hours and a lot of coffee, we had one conclusion: There are 3 types of trade.

    I need your attention for a minute. Let me explain this.

    True is, whatever measure, guide or indicator you are looking for, whatever the time frame, there are only 3 types of trade.
    I meet a lot of people thinking they’ve mastered trading. The problem is they didn’t understand the differences between the trades they took.

    Sure thing is, it will be easier for you if you know the ultimate goal and what can you expect from the trade you took. And it is possible if you know the type of trade you just implemented. This is very important because your knowledge is what determinate where to place your stop loss and your take profit.

    When a professional trader enters a trade, he knows exactly what he’s trading. And my trading friends and me, we can recognize 3 types of trade.

    1. Reversal trade
    2. Breakout trade
    3. Pullback trade

    Each of those trades has some special characteristics (I’ll tell you more about each of them). Depending on the market you’re trading, the success of each type of trades may be different. In Forex trading, the 3 types of trade work good.

    Some traders are attracted to trade all of those types for a limited number of currency pairs. But others are specialized in only one of those trades. When a professional trader enters some trade, he must know what he is trading.

    REVERSAL TRADE as the type of trade

    A lot of traders think that implementing Reversal trades is composed of “calling a top” or “calling a bottom”. This isn’t quite true. Actually, the entry price of a reversal trade is often in a previous zone of support or resistance. Reversal trades are among the most popular types of trade because of their ability to be easily spotted. They take place in a ranging market.

    Reversal
    As you can see the buyers were very aggressive on the chart above because they pushed the price up all the way to point 1 from an original support zone.

    But, once the price hit a resistance zone (marked as 1), buyers started to take profit. And several traders began to short the currency pair and got more aggressive. They took control of the market. This had for the result to create a strong rapid decrease in price.

    At point 2, the same result came, which was a good opportunity to enter a Reversal trade. The sellers placed their orders at that level and the buyers began to take profit because they knew the price had reversed in the past at the same level.

    The stop loss would usually be placed above the highest point (A) and the take profit somewhere below the resistance zone. It is tolerable to expect a risk-to-reward of 1:2.

    BREAKOUT TRADE as the type of trade

    Breakouts trades as one of the types of trade are usually made by a strong continuous movement in a direction. Some traders call it an acceleration because the movement is fast.

    Types of Trade

    As you can see, the main resistance zone is marked by green.

    This is a typical example of Breakout trade.

    Take a look, the bulls were confident and kept pushing the price higher and higher to point 1. At that price, the sellers became more aggressive and took control of the market until the buyers showed even more power. The level pointed with a 2 shows a price at which bears are known to get more aggressive in the market. But, they were not aggressive when the price reached that level.

    Because there were no traders wanting to sell the currency pair aggressively, more and more traders went long, thus pushing the price higher and breaking through the resistance level.

    The stop loss on that trade would usually go slightly below the resistance zone that was broken and the take profit somewhere above the zone. It is tolerable to expect a risk-to-reward of 1:2.

    PULLBACK TRADE as one of the types of trade

    Pullback trades are usually more solid because the retracement back to a previous price level represents a certain confirmation. ( Retracement is a temporary reversal in the direction of a stock’s price that goes against the prevailing trend. A retracement does not signify a change in the larger trend.)

    Types of Trade 1

    As you can see, a pullback trade is characterized by a retracement, often to the previous support or resistance zone.

    Take a look to the chart above, the price kept ranging between a support and resistance zone. At point 2, no one was aggressive enough to move the price significantly higher or lower.

    Once the price broke above the resistance zone at point 3, several traders began to feel excited about their profit so far. Most of them thought that this high price might be a good opportunity to take a profit. But, as more and more people took profit on long trades, the price slowly decreased.

    When the price got back to the previous resistance zone, some traders began to feel that this price was too low. Those traders then bought the currency pair once again (at point 4) to push the price up.

    The stop loss on that trade would usually go slightly below the resistance zone that was broken and the take profit somewhere above the zone. It is tolerable to expect a risk-to-reward of 1:2.

    But there are some other styles of trade speaking about styles of trade.

    RUNAWAYS

    A stock that goes up or down too fast has a greater potential for a short counter-trend. This is caused by investors who take profits. If you bought a stock and make a very good return in a short amount of time, you will likely want to exit the trade to lock in profits.

    One type of trade is to play this process, shorting a stock that goes up too quickly or buying a stock that goes down too fast. This trade goes against the longer term momentum of the stock and is only a short-term trade. For savvy traders, it can be a lucrative move.

    ANTICIPATIONS

    Some chart patterns show a mood but lack a trend. For example, those familiar with charts will know that ascending triangles show optimism and descending triangles pessimism. However, they are consolidation patterns, which means the price, in general, is going sideways over time.

    One of the types of trade is to anticipate a breakout by buying stocks in ascending triangles or shorting stocks in descending triangles. Since price volatility is low, the risk of the trade is less and the upside greater if the stock does what we expect of stocks in these patterns, breakout. This is for advanced traders.

    How to use all these types of trades?

    Look at the top of this post. When a professional trader enters a trade, he knows exactly what he’s trading.
    But do you know too?

    Study your previous trades and recognize the types of trades you were entering. Then ask yourself this simple question:
    ”Did I make this as well as I could?”

    If you get YES as the answer, you are a very good trader. But if your answer is NO this will help you to make progress.

    Risk Disclosure (read carefully!)

  • Tricks of The Trade

    Tricks of The Trade

    Tricks of The Trade
    Don’t eve try to find or use tricks in the trade, here is why.

    By Guy Avtalyon

    There are no tricks of the trade. You will find no hacks or cheat-sheets. All you can find are countless strategies to choose from depending on your trading style and many wise practices to follow.

    In short: Learn before earn. Whenever it seems something is very obvious, first see how the market is behaving before making up your mind to go long or short. Start with paper trading. Learn Technical and Fundamental analysis. Access your risk ability and only take positions in which you are comfortable with possible loss.

    After many hours and a lot of coffee, we had one conclusion: There are 3 types of trade. You have to choose your strategy. If you make the right pick and learn a lot you have a chance to become a master in it.

    At first, you should get theoretical knowledge about the market.

    Educate yourself and read special books. Read blogs. You can find a good piece of advice there. Make out a trading strategy or taking an already working one (find it on the Internet), test it, and see how it works. Try to master it. But don’t go away from its rules (you can change the rules, of course).

    Practice. You need practice. Start with a demo account. All of them are free and you can get even several accounts from different brokers to compare them and find the best one for you. Then continue with trading real money, decide what strategy is yours, and start making money!

    Remember, that you should keep in mind all the tips or tricks of the trade which you will learn from literature. You will have to make all your decisions logic and automatic. After some time, when you’ll be experienced enough, you should feel the ground. Meet your losses and wins as a lesson.

    Define your goals and choose a trading style

    It is important to have some idea about where are you going. You have to have clear goals. Then check your trading method is capable to achieve these goals. Each trading style has a different risk profile. That requires a certain attitude and approach to trade successfully.


    You have to be sure your character fits the style of trading you deal with. The mismatch will lead to stress and definite losses. Learn and practice.

    It is better than trying to find tricks of the trade.

    Take this small tip regarding calculating expectancy:

    Expectancy is the formula you use to determine how reliable your system is. You should go back in time and measure all your trades that were winners versus losers. Then determine how profitable your winning trades were versus how much your losing trades lost.

    Take a look at your last 10 trades. If you haven’t made actual trades yet, go back on your chart to where your system would have indicated that you should enter and exit a trade. Determine if you would have made a profit or a loss. Write these results down. Total all your winning trades and divide the answer by the number of winning trades you made.

    Choose an appropriate trading platform

    Choosing an online broker seems like a simple process. But in reality, it can be a nightmare because finding the right broker is not easy. In the very beginning, you want to be sure that the broker has the right credentials, understands the market, has similar wealth-building beliefs as you do. The most important question is about what type of trader you want to be. Are you an active trader or buy-and-hold investor? Whatever you are, it will affect your choice of broker. If you are a buy-and-hold investor and invest in index funds, making a few trades per year, fund selection may be more important to you than low transaction fees. If you like to trade off of Fibonacci numbers, be sure the broker’s platform can draw Fibonacci lines. These are the best tricks of the trade.

    Choosing a respected broker is of main importance. Researching the differences between brokers will be very helpful. You must know each broker’s policies.

    Have a plan before executing a trade

    You don’t need a million bells and whistles to make money, just one simple tactic that works. One of the biggest problems a trader faces is bridging the gap between trade planning and execution. Getting from a strategy looking good on paper to real-world trading performance is what it’s really all about. Without question, all the planning in the world will not do you any good if you can’t execute and reap the benefits of your work. Wins and losses come in a random distribution. It is not unreasonable to sit through a series of losing trades even if you did everything according to plan. One issue to consider is that people aren’t particularly confident in what they’re doing and this can be rectified with a little guidance.


    Understanding what it is that you are trying to achieve and what constitutes reasonable results can go a long way towards settling nerves and allowing a trader to execute how they have planned to do so. Clarity of mind and consistency of approach will help you to start to realize the potential of your strategy.

    OK, there is one trick of the trade: “one punch, one kick.”

    The idea is to accomplish the job as quickly as possible with very minimal effort.  Find your edge in the market, a technique that works and sticks to your plan. If you don’t have a strategy then you shouldn’t be on the battlefield. Traders who execute random orders without a plan usually lose their money. Who needs a flying roundhouse kick, when a straight stomp to the knee will incapacitate your opponent with one simple move.

    Trade quality over quantity

    One general mistake is the need to always be in a trade. Some traders get whiplash by chasing the market during choppy conditions. Advanced traders are very picky about when to pull the trigger.

    Most of the time the markets produce a 50/50 possibility for success. You want to be patient and wait for trades that have a higher probability than a coin toss. The trick of the trade is to find good trade setups not treat the markets as a roulette table.

    That said, even quality trades have an element of chance, therefore you always need to have an exit strategy to manage risk.

    Traders tend to make money when the markets are inefficient unless you’re running an algorithm that scalps a flat market, stay away from choppy or stable price action. Only trade in market conditions that are conducive to your particular trading strategy.

    As we said before, there are no tricks of the trade. Trading is an art. The only way to become skilled is through consistent and disciplined practice. That’s the trick of the trade.


  • Stop Loss Order – What is It?

    Stop Loss Order – What is It?

    2 min read

    Stop Loss Order - What is It?
    A Stop Loss is a type of closing order to automatically close a trade once prices hit a specific level in the market, normally for a loss It is one of the most popular tools for traders to minimize their risk

    A Stop Loss order is automatic – so you don’t have to manually monitor your positions. This provides a certain level of control and comfort.

    Experienced traders will testify that one of the keys to achieving success in financial markets over the long term is prudent risk management. Utilizing a stop loss is one of the most popular ways for a trader to manage their risk, around the clock.

    What is a Stop Loss order?

    A stop loss is a type of closing order. It allows the trader to specify a specific level in the market where if prices were to hit. The trade would be closed out by systems automatically, typically for a loss. This is where the name Stop Loss appears because the order effectively stops your losses.

    In simple terms, Stop-Loss is an automatic order to buy or sell an instrument once its price reaches a specified level, commonly known as ‘the Stop Price’. The order is executed automatically, which saves you having to constantly monitor your deals. It also serves as protection from excessive losses.

    Stop Loss Order - What is It? 1

    When it comes to a market as volatile as a cryptocurrency, the hardest part is to reduce your losses. Many novice investors have quickly learned the importance of controlling losses. Some may have, sadly, had to learn it the hard way.

    A stop-loss order is an order placed with a broker to sell a security when it reaches a certain price. They are designed to limit an investor’s loss on a position in a security. Most investors associate a stop-loss order with a long position. But it can also protect a short position. In this case, the security gets bought if it trades above a defined price.

    How does a Stop Loss order work in practice?

    The concept of a stop loss is quite flexible in terms of application in practice. In fact, there are a variety of applications to the concept of stop loss. Firstly, you can use it to keep a check on the risk of your trading positions. This is the basic role of a stop loss. Secondly, you can also apply this concept when the stock price is rising and use the concept of stop-profit or trailing stop losses to constantly keep upping your targets with inbuilt risk management.

    The price at which a stop loss order is placed is a personal decision and depends on the trader’s risk tolerance. Traders should consider not setting their limit too low. Doing so would result in the orders getting filled too fast, even with normal market volatility. The price at which stop orders are placed should allow room for a currency pair to rebound in a favorable direction while providing protection from excessive loss.

    What this means is that stop loss is not meant to eliminate all risk. The price should be set far enough into the ”loss” territory or at a place from where a return to profitability for that trade seems unlikely. A Stop Loss helps to manage your risk and keep your losses to an acceptable and controlled minimum amount.

    How to set up a Stop Loss order

    Setting a Stop Loss order is very easy. When you open a deal, you will see an option to ‘Add Stop-Loss’. Simply choose an amount you are willing to lose on the specific deal. Alternatively, set an exact in which the deal will automatically close.

    The real challenge with Stop Loss is figuring out which rate to set, but with a bit of practice, you will discover that automatic orders are extremely useful.

    Do stop losses provide complete protection?

    They are one of the best ways to ensure your risk is managed and potential losses are kept to acceptable levels. Stop losses orders are great and can assist in a variety of ways including preserving your money, preventing your position to become worse or for guaranteeing profits. But they don’t provide 100% security.

    They protect your account against adverse market moves, but they cannot guarantee your position every time. If the market becomes suddenly volatile and gaps beyond your stop level it’s possible your position could be closed at a worse level than requested. This is known as price slippage.

    The advantages and disadvantages of the Stop Loss order

    Novices will just bump the keyboard and hope their money is still there tomorrow.  But not you. You’re ready to make some smooth love to the charts. Stop Loss order is an extremely important tool for traders. Experienced traders understand that Stop Loss orders are not a perfect solution. They should be used carefully because they can also limit potential profits by effectively closing a deal too soon.

    The advantages: Stop order offers protection from excessive losses and enables better control of your account. It helps monitor multiple deals. Stop order is executed automatically, at any time and it’s easy to implement. And allows you to decide what amount you are willing to risk.

    The disadvantages: Stop Loss order could result in deals closing too soon, hence limiting profit potential. Traders need to decide which rate to set, which could be tricky.

    The bottom line

    Having a losing position is certain, but you can control what you do when you are caught in that situation. The ultimate goal for online traders is to take advantage of price changes in order to profit. By carefully using Stop Loss order you can both minimize risks and maximize your profit potential.

    Risk Disclosure (read carefully!)

  • Fibonacci retracement – Know When to Buy and sell

    Fibonacci retracement – Know When to Buy and sell

    2 min read

    Fibonacci retracement - Know to Enter a Trade

    Fibonacci numbers are 1, 1, 2, 3, 5, 8, 13, 21, 34, 55, 89, etc. The sequence occurs by adding the previous two numbers (i.e. 1+1=2, 2+3=5). The main ratio used is .618. This is found by dividing one Fibonacci number into the next in sequence Fibonacci number (55/89=0.618). 

    The logic by Fibonacci based traders is that Fibonacci numbers occur in nature. And the stock, futures, and currency markets are creations of nature – humans. Therefore, traders can apply the Fibonacci sequence to the financial markets.

    There are many Fibonacci tools such as Fibonacci Retracements used by traders.

    In finance, Fibonacci retracement is a method of technical analysis for determining support and resistance levels. They are named after their use of the Fibonacci sequence. Fibonacci retracement is based on the idea that markets will retrace a predictable portion of a move. After which they will continue to move in the original direction.

    Use Fibonacci Retracements to Enter a Trade

    First of all, no indicator should be used in isolation. But by combining it with trend analysis it helps highlight logical areas for entering trades.

    Fibonacci Retracements are considered a predictive technical indicator as they attempt to identify a future exchange rate. The theory is that after a rate spike in either direction, the rate will often return or retrace. Part way back to the previous price level. Before resuming in the original direction.

    When the price of an asset pulls back, it typically has a mathematical relationship to the price wave that preceded it.

    Moves lower off a recent high, or moves higher off a recent low. 

    This relationship is based on the “Golden Ratio” and a series of “Fibonacci Numbers” that help define the numerical relationship of one thing to another.

    Interpreting Fibonacci Retracements

    Given their popularity and widespread usage by technical analysts, it is good to know how to interpret Fibonacci retracements. However, as with any indicator, it is wise to seek confirmation from additional sources. Just to bolster Fibonacci analysis before basing a large trade.

    Once an impulse wave has occurred, the price will quite often move to and stall at one of the Fibonacci Retracement levels. If the price falls through one level it will likely proceed to the next level. Sometimes, a price may stall at one level, then proceed to the next, stall and proceed to the next and so on.

    During such periods it is important to have some guidelines. To know on which levels are likely to be most important in certain market conditions. This will require a lot of practice reading price action.

    When there are strong trends, what to do?

    In a very strong trend, you should expect shallow pullbacks, to 23.6, 38.2 and sometimes 50. In regular trends, or during the middle of a trend expect a pullback to the 50 or 61.8 levels. Early in the trend, late in the trend or during weak trends expect retracements/pullbacks to reach the 61.8 or 78.6 levels.

    We can’t know in advance which Fibonacci level will reverse the pullback. Since there are multiple levels, which one it stops can be random. This is why we need some other tools to help make trading decisions. If we opt to use retracement levels.

    When it comes to using Fibonacci Retracements as a technical indicator, trader discretion is advised.

    The Fibonacci tool works best when the forex market is trending.

    Fibonacci retracements provide some areas of interest to watch on pullbacks. They can act as a confirmation if you get a trade signal in the area of a Fibonacci level.

    The idea is to go long (or buy) on a retracement at a Fibonacci support level when the market is trending up. And to go short (or sell) on a retracement at a Fibonacci resistance level when the market is trending down.

    Fibonacci retracement - Know to Enter a Trade 1
    Fibonacci Retracements are ratios used to identify potential reversal levels. These ratios are found in the Fibonacci sequence.

    The most popular Fibonacci Retracements are 61.8% and 38.2%. Note that 38.2% is often rounded to 38% and 61.8 is rounded to 62%. After an advance, chartists apply Fibonacci ratios to define retracement levels and forecast the extent of a correction or pullback. Fibonacci Retracements can also be applied after a decline to forecast the length of a counter-trend bounce.

    These retracements can be combined with other indicators and price patterns to create an overall strategy.

    Unlike moving averages, Fibonacci retracement levels are static prices. They do not change. This allows for quick and simple identification. And allows traders and investors to react when price levels are tested.

    Because these levels are inflection points, traders expect some type of price action, either a break or a rejection. The 0.618 Fibonacci retracement, that stock analysts like to use, approximates to the “golden ratio”.

    Basic Fibonacci Retracement Strategy

    Fibonacci Retracements are a guide; don’t expect the price to stop exactly at a certain level. For example, the price slightly overshoots at the 61.8 level. It is typical for the price to stall just above or below a Fibonacci level.

    Buy when the price pulls back and stalls near one of the Fibonacci retracement levels. And then begins to move back to the upside. Place a stop loss below the price low that was just created. Or below the lower Fibonacci retracement level to give more room. In perfect position, the retracement level you buy at is one that the asset has a tendency to reverse it.

    Look for some sort of trade trigger to occur near the Fibonacci level. For example,  the price is up and the price has pulled to near a key Fibonacci level. You should wait for the price to consolidate. And then break out of that consolidation to the upside. This adds a second layer of confirmation. Also, you can watch patterns to trigger a trade.

    Without this trigger itis hard to trade Fibo levels on your own.

    How to apply 

    In a downtrend, sell when the price pulls up and stalls near one of the Fibonacci retracement levels. And then it begins to move back to the downside. Place a stop loss just above the price high that was just created. Or above the higher Fibonacci retracement level to give a bit more room.

    Again, add in a trade trigger or some other element of confirmation.

    Looking at how strong the trend is can help determine which Fibonacci levels are most likely to stall and hopefully reverse the pullback.

    The bottom line

    You can apply Fibo to any time frame, including ticks charts, 1-minute charts or weekly charts. Also, you can use retracement levels on any liquid market. And can be applied to individual price waves or multiple price waves. 


    You might also like:

    >>> Best Trading Strategy Without Indicators In Forex

    >>> How to Use Technical Indicators to Analyze Stocks?

    >>> MACD Indicator – Moving Average Convergence Divergence

    >>> Indicator Trading And How To Use It

    >>> P/E Ratio An Quick Method to Value a Stock