
2 min read
Fibonacci numbers are 1, 1, 2, 3, 5, 8, 13, 21, 34, 55, 89, etc. The sequence occurs by adding the previous two numbers (i.e. 1+1=2, 2+3=5). The main ratio used is .618. This is found by dividing one Fibonacci number into the next in sequence Fibonacci number (55/89=0.618).
The logic by Fibonacci based traders is that Fibonacci numbers occur in nature. And the stock, futures, and currency markets are creations of nature – humans. Therefore, traders can apply the Fibonacci sequence to the financial markets.
There are many Fibonacci tools such as Fibonacci Retracements used by traders.
In finance, Fibonacci retracement is a method of technical analysis for determining support and resistance levels. They are named after their use of the Fibonacci sequence. Fibonacci retracement is based on the idea that markets will retrace a predictable portion of a move. After which they will continue to move in the original direction.
Use Fibonacci Retracements to Enter a Trade
First of all, no indicator should be used in isolation. But by combining it with trend analysis it helps highlight logical areas for entering trades.
Fibonacci Retracements are considered a predictive technical indicator as they attempt to identify a future exchange rate. The theory is that after a rate spike in either direction, the rate will often return or retrace. Part way back to the previous price level. Before resuming in the original direction.
When the price of an asset pulls back, it typically has a mathematical relationship to the price wave that preceded it.
Moves lower off a recent high, or moves higher off a recent low.
This relationship is based on the “Golden Ratio” and a series of “Fibonacci Numbers” that help define the numerical relationship of one thing to another.
Interpreting Fibonacci Retracements
Given their popularity and widespread usage by technical analysts, it is good to know how to interpret Fibonacci retracements. However, as with any indicator, it is wise to seek confirmation from additional sources. Just to bolster Fibonacci analysis before basing a large trade.
Once an impulse wave has occurred, the price will quite often move to and stall at one of the Fibonacci Retracement levels. If the price falls through one level it will likely proceed to the next level. Sometimes, a price may stall at one level, then proceed to the next, stall and proceed to the next and so on.
During such periods it is important to have some guidelines. To know on which levels are likely to be most important in certain market conditions. This will require a lot of practice reading price action.
When there are strong trends, what to do?
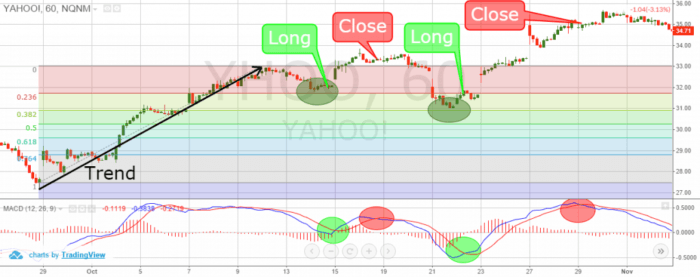
In a very strong trend, you should expect shallow pullbacks, to 23.6, 38.2 and sometimes 50. In regular trends, or during the middle of a trend expect a pullback to the 50 or 61.8 levels. Early in the trend, late in the trend or during weak trends expect retracements/pullbacks to reach the 61.8 or 78.6 levels.
We can’t know in advance which Fibonacci level will reverse the pullback. Since there are multiple levels, which one it stops can be random. This is why we need some other tools to help make trading decisions. If we opt to use retracement levels.
When it comes to using Fibonacci Retracements as a technical indicator, trader discretion is advised.
The Fibonacci tool works best when the forex market is trending.
Fibonacci retracements provide some areas of interest to watch on pullbacks. They can act as a confirmation if you get a trade signal in the area of a Fibonacci level.
The idea is to go long (or buy) on a retracement at a Fibonacci support level when the market is trending up. And to go short (or sell) on a retracement at a Fibonacci resistance level when the market is trending down.
Fibonacci Retracements are ratios used to identify potential reversal levels. These ratios are found in the Fibonacci sequence.
The most popular Fibonacci Retracements are 61.8% and 38.2%. Note that 38.2% is often rounded to 38% and 61.8 is rounded to 62%. After an advance, chartists apply Fibonacci ratios to define retracement levels and forecast the extent of a correction or pullback. Fibonacci Retracements can also be applied after a decline to forecast the length of a counter-trend bounce.
These retracements can be combined with other indicators and price patterns to create an overall strategy.
Unlike moving averages, Fibonacci retracement levels are static prices. They do not change. This allows for quick and simple identification. And allows traders and investors to react when price levels are tested.
Because these levels are inflection points, traders expect some type of price action, either a break or a rejection. The 0.618 Fibonacci retracement, that stock analysts like to use, approximates to the “golden ratio”.
Basic Fibonacci Retracement Strategy
Fibonacci Retracements are a guide; don’t expect the price to stop exactly at a certain level. For example, the price slightly overshoots at the 61.8 level. It is typical for the price to stall just above or below a Fibonacci level.
Buy when the price pulls back and stalls near one of the Fibonacci retracement levels. And then begins to move back to the upside. Place a stop loss below the price low that was just created. Or below the lower Fibonacci retracement level to give more room. In perfect position, the retracement level you buy at is one that the asset has a tendency to reverse it.
Look for some sort of trade trigger to occur near the Fibonacci level. For example, the price is up and the price has pulled to near a key Fibonacci level. You should wait for the price to consolidate. And then break out of that consolidation to the upside. This adds a second layer of confirmation. Also, you can watch patterns to trigger a trade.
Without this trigger itis hard to trade Fibo levels on your own.
How to apply
In a downtrend, sell when the price pulls up and stalls near one of the Fibonacci retracement levels. And then it begins to move back to the downside. Place a stop loss just above the price high that was just created. Or above the higher Fibonacci retracement level to give a bit more room.
Again, add in a trade trigger or some other element of confirmation.
Looking at how strong the trend is can help determine which Fibonacci levels are most likely to stall and hopefully reverse the pullback.
The bottom line
You can apply Fibo to any time frame, including ticks charts, 1-minute charts or weekly charts. Also, you can use retracement levels on any liquid market. And can be applied to individual price waves or multiple price waves.
You might also like:
>>> Best Trading Strategy Without Indicators In Forex
>>> How to Use Technical Indicators to Analyze Stocks?
>>> MACD Indicator – Moving Average Convergence Divergence
>>> Indicator Trading And How To Use It
>>> P/E Ratio An Quick Method to Value a Stock
Leave a Reply