Tag: trading

All trading related articles are found here. Educative, informative and written clearly.

  • What is Alpha in Trading?

    What is Alpha in Trading?

    What Exactly Is Alpha?

    The ability of an investment strategy to beat the market, or its “edge,” is referred to as alpha (α). As a result, alpha is also known as “excess return” or “abnormal rate of return,” which alludes to the assumption that markets are efficient and that there is no way to systematically achieve returns that are higher than the overall market. Alpha is frequently used in conjunction with beta (the Greek letter), which quantifies the overall volatility or risk of the market as a whole, also known as systematic market risk.

    • Excess returns earned on an investment over the benchmark return are referred to as alpha.
    • Diversification is meant to eliminate unsystematic risk, and active portfolio managers strive to produce alpha in diverse portfolios.
    • Because alpha measures a portfolio’s performance against a benchmark, it’s commonly thought of as the value that a portfolio manager adds to or subtracts from a fund’s return.

    To put it another way, alpha is the return on an investment that is not influenced by broader market movements. As a result, an alpha of zero means that the portfolio or fund is perfectly mirroring the benchmark index and that the manager has contributed or lost no additional value over the general market.

    Advantages of Alpha

    Fund managers can use alpha to get a sense of how their portfolios are doing in comparison to the rest of the market. Alpha can be a useful tool in trading and investing for determining market entry and exit opportunities.

    The disadvantages of alpha

    The drawbacks of using alpha as a way to measure returns include that it can’t be used to compare different investment portfolios or asset kinds because it’s limited to stock market investments.

    Beta vs. Alpha

    To compare and analyze portfolio results, alpha and beta are utilized together. While alpha is a measure of a portfolio’s performance, beta is a measure of its historical volatility – or risk – in comparison to the overall market. For example, a beta of 1.2 indicates that the stock is 20% more volatile than the market.

    Conclusion

     Alpha is a technical analysis ratio that shows how a stock has performed or given outcomes when compared to a benchmark or market index. The alpha percentage, which is commonly expressed in simple numbers like alpha 4 or 5, or alpha -1, is the amount by which a stock or portfolio has excelled or underperformed its benchmark. A high alpha indicates a strong stock, while a low alpha indicates a bad stock.

  • Lies That Traders Like To Tell To Competitors

    Lies That Traders Like To Tell To Competitors

    Lies that traders like to tell
    Some traders’ and investors’ lies will confuse you; the other will take your money. Be aware!

    By Guy Avtalyon

    Maybe it’s tough to say, but there are too many lies that traders and investors like to tell. It doesn’t matter if they are lying to their rivals or the audience. I’m always astonished how people pinch every cent at the supermarkets but will let someone they hardly know take their money. Why would you believe anyone you barely know?

    Actually, I can’t even imagine why anyone likes to tell me lies. Do such people want to make a false picture of themselves? What do they think after telling some lies? Are they bigger in their own eyes? More successful? Smarter? Someone might say they are not lying; they are creating a parallel reality. But why? 

    Keep in mind, you have to check everything, or you’ll end up losing your assets. 

    This post aims to unmask the big lies that traders and investors like to tell, yes. All the little lies, the myths, and misleads of traders and investors. I’ll give you the list of traps, so you’ll avoid falling in them.

    What are the lies that traders like to tell?

    Most of us are self-taught traders. We are learning to trade by reading books on trading; we are watching videos, we like to talk with successful traders and investors. In other words, we’re gathering knowledge from every possible source. And we believe they are trustworthy. 

    On the other hand, I’m up for the challenges. When someone tells me that something cannot be performed, I’ll spend hours and days showing how wrong such thinking is. That’s in my nature.

    When I hear someone is picturing him or herself as a professional trader, my alarm turns red. I know they are convinced they are the best, but the truth is something else. For example, some traders would tell lies to give excuses for their lack of profit. Such traders will tell you that some strategy isn’t good enough or impossible to perform, only because they failed to succeed. If you believe them, take a step back, and think twice. Don’t let other traders’ failures stop you. It could cost you money, or, at least, you could waste your precious time.

    If anyone in the world did it, then the contrary is a lie. I always tried to show them how wrong they are. Never believe when someone tells you, “you cannot do it.” Try it; instead, never leave the battlefield. If you know that anyone did it before, find out how it is possible and explore the strategy, method, and approach.

    You will never make money in a short time

    This is a true lie. Why shouldn’t you make money in a short time? You can do it in any trading period of time. We’re living in a high-tech era; we have computers, phones, laptops, we can trade from any place on the Earth at any time. For some trades, you’ll need a few seconds; for others, you’ll need months or years. Where is the problem? 

    Remember, you’re the one who chooses the timeframe. Choosing your trades’ timeframe depends on your budget, personality, trading style, goals, etc. That’s why we have short-term traders and traders with long-term timeframes. It’s completely great to have a trading strategy that combines the short timeframes. So, of the lies that traders like to tell is that you cannot make money in a short timeframe.

    Lies that traders like to tell: you have to analyze the market full-time

    C’mon! Once you understand how the market price is acting, it’s totally possible to turn on your computer at any time and enter the trade. It is actually recommended when you notice the price in the right position or see a good candlestick bar. What is the other way to make a good trade? There is no other way. Just turn on your computer at the right time, enter the trade, and make a profit with the right settings.

    Of course, you’ll need to know a lot about price action and trading to enter the trade at the right time. But the truth is, you don’t need to look at your screen all day long or to study the market full-time. All you need is a good strategy to have more wins than losses. Keep in mind; trading has nothing with certainty; it’s all about probability.

    You can’t profit with a small trading account

    Really? When I hear something like this, I have to ask: Can you tell me what is the right trading account, please? For some traders, $100.000 is nothing. Well, guys, during my early days as a trader, $100 was big money for me. Honestly, it was all I can put into the trade. 

    Moreover, some of the most successful traders started with much less money. And look at them now!

    The truth is that you need to know how to manage your trades to protect your capital invested. Always keep in mind the size of your position. That’s the key. Your primary goal should be to protect your capital. Your account will grow with the winning trades. As the old song says, the winners take it all.

    Automated trading algorithms control the markets

    The truth is that automated trading algorithms do over 70 percent of all trades. Also, the truth is that they are not the largest part of the trading volume. Large institutions do account for the majority of the trading volume in the market. No one can say that algorithms control or run the market. That would be stupid. But it is one of the lies that traders like to tell when they fail. 

    How many times did you hear: What can I do against algorithms? They are smarter than I am? Oh, dear man, algorithms are made by people, like you and me, but they are smarter, that’s true. No jokes, these guys are programmers, developers very familiar with complicated mathematical operations, but there is a different case with the markets. Every second of a trading day, you can see traders taking the bull or bear side on every trade. What can you do as a home-based trader? Follow them. Copy their actions. The main goal in trading is to take the winning side—nothing less, nothing more.

    One of the lies that traders and investors like to tell, especially to their competitors, is that they can’t learn to trade. They will try to discourage you by saying that you do or do not have the talent or abilities for successful trading. It’s BS, trash, pardon my French! Everyone can lose money; it’s the part of trading. No one is profitable all the time. Losing trades are normal. The goal is to have more winning than losing trades in sum.

    Take your time, don’t waste it on lies that traders like to tell, build your confidence, learn as much as you can, and enter the trade.

  • How to improve risk management in trading?

    How to improve risk management in trading?

    How to improve risk management in trading?
    Improving risk management in trading could be a life-changing factor.

    By Guy Avtalyon

    I’ll start straight to the point on how to improve risk management in trading. Risk management in trading very often stands very low on the priority list for many traders. The main concern is the entry signal or other indicators. I have to tell you this isn’t the right way. Nothing is wrong with waiting for the proper indicator, but if you don’t have decent knowledge about risk management in trading, you will not have profitable trades. The point is to know how to manage your risk, size your position for each trade, and set your orders accurately if you want to make a profit in trading.

    And you might think it is unnecessary, and it isn’t so important. If that is your case, feel free to not continue with reading this post. But I have to warn you that if you never improve risk management in trading, you’re at risk of becoming a steady loser. 

    And why should you be that if there are some tips to avoid the most common problems?

    Tips to improve risk management in trading

    If you adopt some of these tips or approaches, you’ll stop losing your hard-earned money.

    First, you must realize how you let the trade get out of your hands. Yes, it’s kind of looking back but never think about this as wasting your time. If you make a scrutinizing evaluation of your past trades that ended in losses, you’ll find the reasons behind them, and you’ll find the pattern. The main benefit of this introspection is to avoid similar behavior in the future. Knowing how and why you made mistakes, you’ll be prepared and will never repeat the same trading mistake in the future.

    Setting orders and the risk/reward ratio

    When you identify an entry signal, do you know where to set your stop-loss and take profit orders? You have to know that even before you enter the trade. How to do that? Let’s assume you know where to set the stop loss and take profit orders after determining the appropriate price levels. The next step should be to measure the risk/reward ratio.

    If you find out the risk is bigger than the reward, just skip the trade. The worst thing you can do is stretch the take profit order or squeeze your stop loss to reach a higher risk/reward ratio.

    Keep in mind; trading is mostly unpredictable, so the reward isn’t assured. The only thing you can control is the risk involved in your trades. You shouldn’t neglect that and act unreasonably. I’m a hundred percent certain that most of you determine the risk/reward ratio randomly and adjust your stops and profit orders to reach that ratio. Guys, it’s an entirely wrong way.

    Compare win rate and risk/reward ratio together

    Many traders insist that figuring out the win rate is pointless. But they miss out on a crucial point. Watching the win rate alone has no value, but if you observe win rate and risk/reward ratio together, you’ll be closer to winning trades. Having winning trades is every trader’s dream.

    I want to be clear with this, you shouldn’t necessitate an excessively high win rate. For instance, a trading strategy with a win rate of 40 percent requires a risk/reward ratio below 0.6 to be profitable.

    A win rate of 40 percent is average for the most profitable traders. Why should you want an insanely high win rate? That’s wrong and could lead you to significant losses.

    Balance win rate and risk/reward ratio

    You must find a balance between the win rate and the risk/reward ratio. For example, the high win rate could mean that the risk/reward ratio also is high. 

    Suppose you found a stock that is trading at $20, down from a recent high of $25. And you bought 50 shares because you had $1,000 for that purpose.

    If the stock price went up to $25, you can make $5 for each of your 50 shares, and in total it is $250. You paid $1,000 so you have to divide 250 by 1,000 and the result is 0.25.

    That means that your risk/reward is 0.25:1. It is a very low risk/reward ratio.

    Assume that you have made 15 trades, of which 6 were winners and 9 were losers. So, the win/loss ratio is 6/9, or 2:3. In percentages, the win/loss rate is 6/9 = 0.66. This means you are losing just over 66 percent of the time. Using your total number of trades which is 15, your win-rate would be 6/15 = 0,4×100 = 40%.

    You can be profitable with a 40 percent win rate if risk/reward is below 0.6. As can be seen from the formula for calculating the needed win rate for profitability based on the risk/reward ratio, 1/(1+ risk/reward ratio).

    The risk/reward decreases when the win rate decreases. In other words, if you have more losses, your winners must be bigger to be profitable.

    Size your position

    I’ve met many traders that size their positions randomly picking some levels of 2 percent, 4 percent, and never change that. It’s totally insane. You have to estimate the chances to win because trading is all about possibilities. It’s normal to change position sizing for every trade if it is necessary, and mostly it is. Why should you hold the same position size when you see virtually no chances of winning? 

    In trading, every strategy has a different win rate. So, the risk/reward ratio for each of your trades will vary. This is especially important if you trade using many strategies or setups.

    The point is to reduce the trades’ position size with low win rates and increase it for the trades with higher win rates.

    If you want to improve risk management in trading, you should never overlook the risk/reward ratio and money management. Otherwise, you’ll blow your account. If you take too much risk to make a quick profit, you’ll likely end up in losses. 

    You’ll go bankrupt because of a lack of knowledge about risk management. Now onwards, you have to rigorously adhere to position sizing and risk management if you want to be a profitable trader.

    Pay attention and improve risk management in trading

    You might love your trading style or some strategy, particularly, but you should consider improving it to achieve more profitable trades. After some time, everyone should jump to the next level. I know you could be impressed by indicators, waiting for the right signals to show you the right time to enter the trade. It’s so exciting and sexy, right?

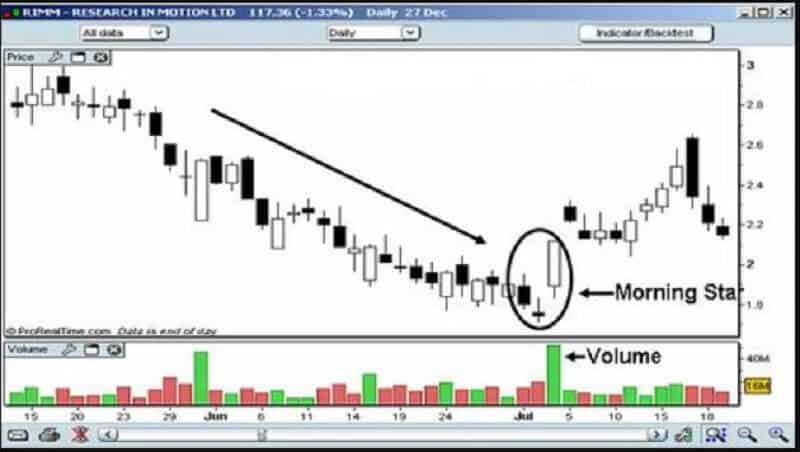
    Well, it’s also risky if you never improve your risk management. It isn’t so exciting as watching the charts, candles, following the news, and waiting for the indicators, but it is essential for your future trades and your profits. Blinking indicators and trading strategies will benefit you for some time, but the real difference comes with improved risk management.

    Don’t be worried. A small number of traders really pay attention to this matter unless they have a series of losing trades. Then and only then. they will start thinking about how to improve risk management in trading. But you have a chance to shortcut this path. Why suffer losses if you can trade with more attention to the risk management from the beginning instead. 

    It doesn’t take too much. 

    Did I miss something? Share your opinion with me, leave a comment, ask me what else you would like to know. I’m here for you, guys.

  • How To Trade On A Laptop?

    How To Trade On A Laptop?

    How To Trade On A Laptop?
    A trading laptop has to be able to process a large amount of data quickly. You’ll need multiple windows open or you’ll need a few monitors. Here is how to set up your laptop for day trading.

    By Guy Avtalyon

    Can I trade on my laptop, asked me dozens of readers and I said yes, but you must know how to trade on a laptop. Well, I saw here some misunderstandings about what is the best computer configuration you need for a day trading. Technology is continually advancing, so you’ll need a computer with adequate memory. Also, the processor must be really fast. 

    Guys, you wouldn’t like your computer lagging all the time. Or even worse, stalling when you need to act quickly. Markets will not stay the same while your computer is trying to load or crashing every several minutes. The trading software will need a great memory and processor. For charting, you’ll need the same. Especially your processor must be fast and up to date.

    The simple answer to the question How to trade on a laptop would be: by something really good. Yes, I know. It might cost you a lot but think. If you have a fair enough good machine you’ll be able to trade in a proper time and, this is very important, you’ll be able to use all the necessary toolsFor example, day trading is something most traders want. The point is that it demands that you have a whole tools kit. Otherwise, you’ll never do this job well. 

    How to trade on a laptop easily?

    These days’ trading is based on electronics. You enter the markets over the internet, right? So, you need a computer or laptop to make a trade and have direct access to your brokerage. The other tools you’ll need are market data in real-time, and great trading platform. But keep in mind, these are basic tools. You’ll also need a charting platform and many other trading tools. The common thing for each of them is that all of them require great computer performances. 

    So, how to trade on a laptop?

    Isn’t it easier to have two or more monitors since you’ll maybe need to look at charting software monitors, broker’s website, market data? Well, having a few monitors isn’t a necessity but is an advantage.

    Well, I have to be honest. Trading with a desktop PC is easier and cheaper than with a laptop. Do you remember what I’ve said about requirements toward memory and speed? Well, a PC is more favorable since it can be configured for more speed and processing ability than a laptop. 

    What are the main problems with laptops? First of all, they have limited space, the components are smaller but more expensive. So you’ll need more money to spend if you want to have a high-end laptop. It could be cheaper to buy a PC with similar performances.

    The other problem could be to connect several monitors. Let’s say your laptop’s screen is smaller than the monitors you can connect via DVI port, for example. So, it could be exhausting trading while looking at a small laptop screen and large monitor next to it. 

    Well, not all is better if you use a standalone PC. Let’s say they are robust, in the first place. And you don’t like to sit in front of it the whole day or even longer while monitoring your trade. You really don’t need it if you trade on a laptop. It gives you mobility. Especially if you prefer automated trading that is known as robo or algorithmic trading, also.

    So, how to trade on a laptop? Yes, I see you’re impatient. You have to install your system on a virtual private server (VPS). What is this? It is a remote server that is located near or close enough to the broker’s server. You’ll have a minimum of latency, minimum delay in placing your trade orders. In essence, your trades will come from the remote server connected to your laptop.

    What do I have to do to trade on a laptop?

    If you have a high-end laptop the only thing you’ll need extra is a separate monitor connected to the right port. The other solution, if you want to connect more monitors, is to buy one USB video adapter for each monitor you want to connect. 

    Yes, you might say your laptop doesn’t have several ports. Well, there is a solution also for that issue. Just get a USB hub and voila, your two or more extra monitors are connected.

    Hey guys, one thing more! Don’t try this if your laptop doesn’t have enough RAM, for example, 8 GB at least. 

    What tools will you need for trading on a laptop?

    As I said before, you’ll need a powerful laptop. The other important tool is a trustworthy platform to trade. Numerous brokers will give you access, you have to be smart and choose one with good charting software. Why is this important? Because if you want to be a profitable day trader you’ll need to act quickly and how to do that if you don’t have an option to see the tick charts and timed charts. For day trading it is imperative to have 1-minute, 5-minute, hourly charts.

    As a day trader, you’ll need software that allows you to place trades quickly. Your trading success heavily depends on your strategy but if you don’t have advanced software you won’t be able to execute your strategy properly. 

    The main goal here is to find the best software to meet your needs and to connect it with your trading service. That is how you can trade on a laptop.

    The problem may arise if you don’t have fast internet. With a slow internet connection, it is impossible to trade. In day trading, hundreds and hundreds of data will stream directly to your laptop every second. What do you think, is it possible to follow the price moving in real-time with slow internet? Of course not! So a fast internet is an important tool for your trading success. Otherwise, you’ll receive out of date data and your trading will fail. You’ll lose your money.

    Also, you’ll need to backup your internet access in case of service’s outages. Yes, shit happens! Use your smartphone as a backup. You can create a hotspot and continue to use your laptop or you may have direct access from your smartphone to your trading platform. Never use the same internet provider for your laptop and for your smartphone for this reason.

    Appropriate market data is a necessary tool

    Day trading demands a perpetual stream of market data, info about the price movement. Your broker will give you market data, but it’s up to you to demand the kind of data you need. For example, if you trade forex, you’ll need forex market data. Forex brokers give data for free for all forex pairs which is convenient because all you need to do is to open a chart and you’ll see the price data. 

    For the stock market, you’ll have to subscribe to the data you need. Don’t add too many.

    It is possible to trade on laptop 

    When you ask me how to trade on a laptop I have only one answer. I’m trading on a laptop. I’ve never used a PC. Is it a harder or simpler solution I don’t know since I never made a comparison. And know what, I’m satisfied. This doesn’t mean you’ll be also. But this post is written because you asked me. So, this was how to trade on a laptop.

    Happy trading, guys!

  • How to Find a Stock Worth Trading?

    How to Find a Stock Worth Trading?

    How to Find a Stock Worth Trading?
    To find a stock worth buying several parameters should be estimated and examined. Here is what really matters.

    By Guy Avtalyon

    If you want to know how to find a stock worth trading, think about the stock’s valuation, strategy, plans for diversification, and your appetite for risk.

    The first consideration on how to find a stock worth trading should be the company’s earnings. Profitability is important because when you buy a stock, you’re buying a part of the company. Calculate its P/E ratio, just divide the share price by a company’s annual net income. 

    For example, if a stock trades at $30 and has an annual net income of $3 the P/E ratio is 10. The general rule of thumb: if the stock’s P/E ratio is higher than the broader market P/E, it is considered expensive and vice versa.

    But the P/E ratio isn’t a perfect measure. For example, a small, fast-growing company may have an extremely high P/E ratio but earnings are poor while the stock price can be high. You have to gauge if there is any potential for strong growth and if there is, such stock may not seem expensive.

    So, look for trends in a company’s earnings growth. Find do the earnings regularly increase. If you have a confirmation for that, get it as a good indication that the company is operating well. There is no need for an incredible increase, even a small increase can be an indicator of a positive outlook, but only if it is consistent over a long time.

    Volatility matters

    The volatility in the stock market is natural. The companies are losing value in the markets from time to time but also could increase the value. Every trade you make in the stock market is actually kind of betting on the market direction, on the volatility, or both.

    For stocks trading, volatility is good for the long term because you have to make a profit. And you can do that only if the stock price fluctuates. If you really want to find a stock worth trading, seek the high volatile stocks.

    If the stock has a high volatility the value could be spread over a large span of values. This means the price of the stock could fluctuate drastically in a short time, which is ideal for fast-moving trading. Contrary, if the volatility is low, the stock’s price will stay almost steady which offers fewer chances for a quick profit.

    Beta as a measure of volatility

    Use beta as a measure to unveil how volatile the particular stock is.

    The beta can predict the total volatility of a stock’s returns against the returns of a related benchmark, for example, the S&P 500. If you find that beta value is, let’s say 1,3 that means the stock price moved about 130% for each 100% in the related benchmark index. Hence, if the beta value is 0.6 that would mean that stock has moved just 60% for each 100%  in the related benchmark.

    Trade volume matters

    Volume is the total number of shares traded in a market during a particular period. Each transaction adds to the total volume. For example, if during one trading day there are 100 transactions, the trade volume for that day would be 100. How to find a stock worth trading when using trade volume? Volume works as a great indicator that adds weight to the market move. For example, if some sudden spike appears, the strength of that movement depends on the volume during the time observed. 

    When picking a stock worth trading, pay attention to how great is volume. The greater volume, the more important the move is.

    How to find a stock worth trading?

    So finding a stock worth trading is a matter of combing for stock with large volume, a current spike in volume, and a beta higher than 1.0. The stock that lacks these elements will be very difficult to trade successfully.

    The way you use these factors will affect your possible profit. The trading style depends on your trading strategies. You have to find a stock whose price changes to profit from that fluctuation. It is impossible to profit from trading stocks if there are no changes in price. Also, the same comes if the volume is low. The low volume shows a lack of buyers and sellers. How to profit from that?

    Stock Price

    You may consider the stock price. Some companies could distribute additional shares and increase the number of available shares but lower the price per share in the market. Some will never do that. It is considered better for investors because such stock could rise more in price and worth more after some time. Anyway, the stock price will show you how many shares of a particular stock you can buy for the capital you have. Pay attention to stock price historical performances. That will give you a clue how the stock is possible to play in the future and is your chosen stock worth buying.

    But active traders will prefer, for example, stocks in play but they’ll need to carefully watch the news because such stocks are not the same every day. 

    How to find a stock in play worth trading?

    These stocks are suitable for day traders because they are changing dramatically sometimes during the trading day. Also, they carry enough volatility to generate favorable risk and reward trading ratios.
    Day traders will normally look for stocks that have big price changes during the one trading day. These stocks are not a good choice for investors with a long time investment horizon.
    Active traders expect more action. They exit the trade much before the end of the trading day, sometimes a few minutes after they enter the trade. These trending stocks can be found on many broker’s trading platforms. There you’ll find stock worth trading.

    Bottom line

    Trading, even if it is considered as a risky strategy, can be highly profitable. Of course, if you know how to find stock worth trading. As we mentioned above, pay attention to trading volume, volatility, liquidity, and price. All of these criteria together will help you to find the stock worth trading.  

  • Morning Star Pattern How To Trade It?

    Morning Star Pattern How To Trade It?

    Morning Star Pattern How To Trade It?
    How to identify the Morning Star pattern, how to trade it? Is it bullish or bearish? Is the Morning Star pattern good or bad when seen in the chart?

    To know how to trade this pattern we have to know what the Morning Star pattern is. First of all, you have to look at three candles and are near the support level. If yes, to have the Morning Star pattern, the first candle has to be bearish, the second has to be doji, and, finally, the third has to be a bullish candlestick. This third candlestick is important because it creates a bullish reversal pattern. So, logically, the Morning Star pattern is a bullish reversal pattern. At first glance, it may not look as bullish but we’ll explain to you how to recognize this pattern when it appears. Also, Traders-Paradise will introduce you to some trading techniques related to the Morning Star pattern. 

    This pattern will always tell you that something good is on its way. Bullish traders will always look for this pattern because a great reversal may occur. 

    The advantage of Japanese candlestick patterns is that even one candle has the whole story but when they are arranged together, you’ll have the novel. In terms of trading stocks, you’ll have the pattern that will tell you when your stock is going to breakout or breakdown. What is more important, when using the Morning Star pattern, you’ll know everything about the emotions of traders. For example, if you see long-legged candlestick, you’ll know that there was a hard battle among bulls and bears but without progress or change. At the end of the trading day, they are both pushed to the starting levels. 

    Therefore, understanding of candlesticks and their purposes is essential.

    What is a Morning Star pattern?

    We’ll need three trading days to be sure the Morning Star pattern appears. As we said earlier, this pattern is bullish but the first candlestick is large and bearish. That is due to the current trend and the first candle is in harmony with the trend. The second candle you’ll recognize when you see a small real body. It is a doji. This doji reveals hesitation and it’s followed by the third candlestick which is bullish. This third candle should be a large bullish one (the charts aren’t perfect, so how big is this third one, doesn’t really matter at this moment), so it tells us the bulls are coming back. They want to take over.

    So, the first day the bears have absolute control. The candlestick from the next day will tell us that there was a battle between bears and bulls and one of them is in control but yet it isn’t known which one. That’s something that doji tells. Still, we don’t know who is the winner so we have to look on the second day as on the day of indecision. We’ll understand who has a control on the third day when the bulls actually are knocking down the bears and winning the battle. So, the new direction on the stock price is starting. The price reversal is here.

    How strong is the reversal? 

    Well, we have to consider several signs to be able to conclude that.

    The longer the candles, the higher reversal. Further, the reversal will be higher if there is any gap on both sides of the middle candlestick of the Morning Star pattern. 

    To make this clearer, the second candle is the star. It has a short real body, separated from the real body of the first candlestick. The gap between the real bodies of the two candles separates a star from a doji or a spinning top. The star may appear in the shadow of the first candle, it isn’t necessary to form below the low of the first candle.

    The appearance of the start is the first sign of bears’ weakness. They are not strong enough to push the price lower than the closing price on the prior day. The third candle will confirm their weakness. This third candle has to be lighter in color. Actually, the middle candle can be red or green or black or white because the bulls and bears are going to balance out across the session.) in the charts and pierces into the body of the candle from the first day. 

    Also, if there is a gap between the first and second days. Here we came to the size of the third candle. If this candle is higher than the candle from the first day, that means the greater the bullish takeover. 

    How to trade Morning Star Pattern?

    We already said the Morning star pattern is a sign for the start of a trend reversal. From bearish to bullish. Well, you have technical indicators on disposal that may help you to unveil the Morning Star is going to form. For example, when the price is nearing a support zone. The other indicator could be when RSI confirms that the stock is oversold.

    Also, pay attention to the volume. It can be a great contributor to the forming of this pattern. When the volume increases during the three trading days and on the third day it’s the highest that’s the confirmation of the Morning Star pattern followed by the reversal.

    You should take up a bullish position in the stock when the Morning Star forms. Then, ride the uptrend until there is an indication of an added reversal. So, it’s important to notice when the first falling bearish candlestick is going to form. Further, monitor for the second smaller candlestick which is spinning top or doji, as we explained above. Plan your stop now. When the third candlestick is formed it is a bullish one, wait until it breaks above the third and take a long position. If you go long, set your stop below the bottom of the last candlestick. Some traders would wait until the price drops below the third candlestick and then enter a short position and set a stop above that candle. 

    Bottom line

    This pattern is a bullish reversal pattern. That means that buyers (bulls) take control of the sellers (bears) and push the price in the opposite direction.
    Trading completely on visual patterns can be a risky plan. The Morning Star pattern is best when it is supported by volume and a support level, as the back indicators. It isn’t hard to notice this pattern. It will appear whenever a small candle occurs in a downtrend.
    Whatever the candlestick pattern you use, you have to understand that there are many variations of it and on it. But one thing is sure, the Morning Star is a bullish reversal pattern that tells us that some good things are going to come.

  • Inverted Hammer Candlestick Pattern

    Inverted Hammer Candlestick Pattern

    (Updated October 2021)

    Inverted Hammer Candlestick Pattern
    Inverted Hammer candlestick pattern occurs essentially at the bottom of the downtrend and can warn of a possible reversal upward

    Inverted Hammer candlestick pattern is visible on a chart during the higher pressure from buyers to push a stock price up. It is a bullish reversal pattern. This pattern is identified by a long upper shadow and a small real body. They usually appear following the real longer black body. It’s pretty similar to the Shooting star candlestick pattern. Inverted Hammer occurs in a downtrend. In trading charts, you’ll notice a long black candle visible on the first day of appearance. On the next day, you can see how a small real body develops. It will occur at the lower end of the range. The candle for the second day will have an upper shadow, two times longer than the real body, and will not have a lower shadow. Don’t pay attention to the color of the real body. It isn’t important at this moment.

    What does the Inverted Hammer candlestick pattern tell us? 

    The long upper shadow indicates the buying pressure after the opening price. It is followed by significant selling pressure but insufficient to bring the price down, below the open. However, we’ll need bullish confirmation that may come as a long empty candlestick or a gap up, but followed by a heavy trading volume. 

    Inverted Hammer candlestick pattern tells us that bullish traders raise their confidence. The top of the candle is made when bulls push the price up the farthest they can. The bottom of the candle shows the bears attempting to resist that higher price. Bears are short-sellers. Still, the bullish trend is extremely strong, and the market is settled at a higher price. 

    Also, an inverted hammer candlestick pattern tells us that there could be a price reversal as a result of a bearish trend. Keep in mind, never observe the inverted hammer candlestick pattern solely. You’ll need confirmation of other technical indicators. Ultimately, check your trading plan before trading the inverted hammer. 

    What is the Hammer candlestick pattern?

    A hammer pattern in candlestick charting is a price pattern. It happens when an asset trades lower than its opening price, but the rally is formed inside the given period, for example, one trading day, to close near the opening price. The pattern looks like a hammer. The lower shadow is a minimum twice the size of the real body. The body of the candlestick signifies the difference in the opening and closing prices and the shadow tells about the high and low prices for that period.

    A hammer occurs after the price of security declines. That is the sign the market is trying to define a bottom. Hammer will appear when the sellers miss forming the bottom and push the price to rise and reverse. In short, the price drops after the open but later, closes near the bottom after regrouping. 

    A hammer candlestick doesn’t show a price reversal to the upside,  it has to be confirmed. Confirmation means the next candle that follows the hammer, closes higher up to the closing price. On such occasions, traders usually enter the long position or exit their short positions. Traders that are taking long positions it is recommended to set a stop-loss below the low of the shadow.

    The meaning of Inverted hammer pattern

    It is important to understand that all inverted patterns imply that the price will change soon. It will not reveal a particular trend but it will warn you that the market will change its momentum.

    Speaking about an inverted hammer pattern, its appearance shows the market is going up with buyers that are taking control. So, the price will go higher. Also, momentum changes, so the sellers are taking the price back to the level of the opening price. The pattern can send out many buys and sells signals in various cases. 

    Inverted Hammer is a trend reversal pattern, and it’s opposite to the hammer pattern. As a signal of bearish reversal, it comes after the stock price falls and symbolizes the strength. What does it look like? Let’s say the stock price tries to move up but the current downtrend blocks it. The bears push it down and form the top tail of the inverted hammer. At first glance, it may look like the trend is continuing since it arrives near a support zone and indicates the bullishness of the stock.  And the war can start. The bulls against the bears, where the bulls are trying to launch the stock up to new higher levels.

    How much the color is important?

    It’s time to explain the color of the body of the inverted candlestick. It could be dark or light. The light body reveals that a stock closes higher and is more powerful than its peers.

    When the uptrend is out of the scene the pattern is ready for the trend reversal. The stock price will go back to the opening price and probably stay around that price until the end of the trading day. You should wait for the next day and the new opening price.  You’ll know if the stock goes down further or the buyers will give it another chance and take the stock to a better position.

    The Inverted Hammer candlestick pattern is maybe one of the main reversal signals in stock trading. You must consider confirmation criteria before trading with this signal. The upper side has to be twice longer than the length of the body, while the lower shadow is very small or there is no, it’s invisible. You must be sure you have the right picture. Let’s say this way, the length of the upper shadow is directly proportional to the possibility of a reversal.

    Also, if there is a gap down in comparison to the close of the prior day, it could be the base for strong reversal. Start trade the Inverted Hammer candlestick pattern the day after the appearance of the signal because in that period the stock will open higher. Consider one aspect more, it’s the level of the trading volume on the day when the inverted hammer signal appears. High volume will increase the odds of blow-off.

    The logic behind this pattern

    First of all, the market condition is bearish as a reply to a downtrend. The stock could start to trade higher, so the bulls will not have the necessary strength. Hence, we have sellers on the scene that are pushing the price down to the lower trading range. Generally speaking, the bears will dominate the market all trading day in such a case.

    The bulls will attempt to recover power the next day causing the price jumps because the bears aren’t able to exercise the needed resistance. If the price sustains its strength even on the next day, you can be sure that you have the confirmation for the inverted hammer pattern.

    If you want to trade an uptrend, you can “go long” which means you can buy. But if the signal isn’t strong enough and the downtrend will continue, so you can “go short” which means you can sell the stock or any other asset you hold.

    Bottom line

    Inverted Hammer candlestick pattern indicates a bullish reversal and it’s recognized in downtrends. Traders need this to decide on the next move. Keep in mind, this pattern isn’t the same as the shooting star pattern. There is a difference. Inverted Hammer candlestick patterns will never occur at the high of the trend line as the shooting star. Inverted hammer will always occur at the low of the trend but not as often as regular hammers. Sometimes, the signals that an inverted hammer may produce can be confusing. That’s the reason to double examine the length of the shadow. It is the most important. 

    Some experts will not recommend using this signal as a trigger for entry. Still, if you want to use it you’ll have an advantage if you wait for a bullish confirmation candlestick. This signal performs the best in time frames of four hours or one trading day. In longer time frames, use it as an entry signal to sell, but not to buy. Remember, the inverted hammer pattern must appear after a downtrend. The flat or sideways markets are something you will not like in trading this pattern.

  • Shooting Star Candlestick Pattern

    Shooting Star Candlestick Pattern

    Shooting Star Candlestick Pattern
    The shooting star pattern represents one of the most important candlesticks patterns in trading. It can decide the entries and exits of your trades.

    Shooting star candlestick pattern is a bearish reversal pattern that appears at the top of uptrends. How does this pattern appear? A Shooting star candlestick pattern is formed when the price of the open, low, and close is approximately the same.  

    A shooting star candlestick pattern is actually a bearish candlestick. It’s easy to notice it.  It has a long upper shadow, small lower shadow or there is no this shadow at all, but there is a small solid body close to the low of the given day. To make a long story short, a shooting star candlestick pattern appears when the security opens, develops notably, but again closes near the open. Traders-Paradise wrote a lot about how to trade patterns, but this one is extremely important.

    How to recognize the Shooting star candlestick pattern

    To be sure it is a shooting star pattern, some conditions have to be fulfilled.  Firstly, the configuration must be created while the price rises. The other condition is that the shooting star candlestick’s body has to be half the size of a distance between the highest price on the given day and its opening price is. And, the last condition, as we said, there shouldn’t be any shadow near the real body or it can be a bit, barely visible.

    The bearish Shooting star candlestick pattern is created only if the low and the close are around the same. Traders recognize this pattern as very strong. When we notice this pattern in the charts it is confirmation that the bears were strong enough to defeat the bulls. Also, it is a confirmation that the bears closed the price below the opening price which means they pushed the price more. The Shooting star candlestick pattern isn’t a hundred percent bearish pattern, but nonetheless it is bearish when the open and low are approximately the same. Remember, they had to close the price BELOW the open. This means the bears were strong enough to halt the bulls but were not capable of sending the price back to what it was worth at the open. 

    When this pattern may occur?

    A shooting star candlestick pattern occurs when the market price is pushed up pretty notably, but then rejects and closes near the open price. This creates a long upper candle, a small lower candle, and a small body.

    Why is the shooting star candlestick pattern often seen as a possible signal of bearish reversal? Because the uptrend might not continue, meaning the price may fall. Don’t confuse the shooting star with the inverted hammer candlestick pattern.  Yes, both have a longer upper candle and small body. The inverted hammer flags bullish which is opposed to bearish reversal, and it is visible at the bottom of a downtrend, not on the top of an uptrend.

    What does the Shooting star candlestick pattern reveal?

    A Shooting star candlestick pattern indicates a possible price top and reversal. It is an extremely powerful signal when it occurs after a group of three or more continuous rising candles with higher highs. However, this pattern may happen during a phase of rising prices, even if a few candles were bearish.

    When the price advances strong to the top, a shooting star opens and continues to rise greatly over the day. This is a result of strong buying pressure during several periods. What is possible to happen? The sellers will come up to the scene in an attempt to push the price back down, close to the open price, and delete all gains for that day. If they succeed that will mean the buyers don’t have control anymore by the close of the day, and it’s possible the sellers will take over.

    In trading charts, the buyers are visible as a long upper shadow.

    They are buying during the day but it looks they are losing their positions since the price drops back to the open.
    After the shooting star, the candle forms. That is the confirmation of the shooting star candle. If you take a look at the chart you’ll notice the next candle’s high is under the high of the shooting star. Also, you’ll see how the price moves down and close near the close of the shooting star. On heavy volume, the first candle after the shooting star will be lower or will open around the previous close after which it will move lower.  That could indicate the price could go down further. In such circumstances, the traders may look for a short sell.

    In case the price increases after a shooting star, the price span could serve as resistance. For instance, if the price consolidates in the zone of the shooting star. If the price eventually remains to rise, the uptrend stays unreached, the traders should choose the long positions overselling or shorting.

    How to trade the Shooting star candlestick pattern?

    For example, the stock is growing in an overall uptrend. The uptrend becomes faster just before the appearance of a shooting star. The shooting star displays the price opened and pushed higher. In charts, it will be visible as an upper shadow, then closed near the open. The next day the price may close lower, which is a confirmation of a possibility for the price to move even lower. If the high of the shooting star wasn’t passed, the price could move in a downtrend for the next few weeks. When trading this pattern, it is a smart decision to sell long positions after the confirmation candle becomes visible.

    Let’s say you’re following the Tesla Inc. stock price and it opens the trading day at $990. Well, the price starts going down at $970 but suddenly good news generates the stock price to rise quickly, and it reaches a high of $1.020. Finally, it closes at $1.000. These changes create a shooting star candlestick.

    If you want to trade the shooting star candlestick pattern keep in mind that it could indicate a negative reversal, also. In short, market prices may go down.

    Limitations of this pattern

    Just one candle isn’t important in a major uptrend. Prices are changing. If in one short period the sellers are taking control, it could be irrelevant. That’s why traders need confirmation. They have to sell just after the shooting star, but even with confirmation, they have no guarantees the price will continue to drop. Not even how long. One of the possible scenarios is the price could increase after some short drop and continue to rise in a long-term uptrend.

    When trading this pattern you have to use stop-loss orders if you want to reduce the risk. One of the smart decisions is to use this candlestick pattern in combination with other methods of analysis.

    Bottom line

    The Shooting star candlestick pattern can indicate the end of an uptrend, so traders may decide to reduce the long positions or exit the trades. It is smart to use some other indicators with this pattern to determine potential sell signals. For example, you could wait a day to test if prices will proceed to fall. Also, you can use the break of an upward trendline. More aggressive traders can use the Shooting star candlestick pattern as a sell signal.
    The bullish version of the Shooting star pattern is the Inverted hammer pattern. Stay tuned, that’s the next.

  • Moving Averages As Support and Resistance Levels

    Moving Averages As Support and Resistance Levels

    Moving Averages As Support and Resistance
    Finding the key support and resistance levels is a crucial component of trading. Moving averages can help.

    By Guy Avtalyon

    Is it possible to use moving averages as support and resistance? How can they help us in trading? Is there any trick on how to use them? We know from the previous article that moving averages are an average of closing prices during the recent days. How much info we can use in the meaning of moving averages as support and resistance levels?
    If you take a look at any chart with moving averages and trend lines that are formed you’ll understand why this is the subject. Moreover, this understanding may have a great impact on your profit.

    Moving averages as support and resistance are extremely powerful and we’ll show you why and how.

    What are the moving averages as support and resistance?

    First of all, these levels are not just like conventional support and resistance. Conventional, traditional levels are visible as horizontal lines in your charts but these provided by moving averages are dynamic. They are changing according to the recent changes in price.

    Dynamic support and resistance levels are zones where the market could pull back into and get support requiring to be at horizontal support or resistance levels. Why is it dynamic? Because it measures resistance and support using moving averages that are changing as market changes.

    You can find many forex traders that use moving averages as support and resistance levels. For example, it is common among them to sell when the price increases and reaches the moving average and tests it. As a forex trader, you cannot ignore when the price often checks out the moving averages before it bounces back. You must understand that something is happening when the price reaches these levels. 

    What happens is the market is developing, evolving. So you can’t always buy or sell at previously outlined levels. Also, trends’ momentum is dynamic too due to the order flows. Momentum can often be the primary forcing power of trends or movements.

    But to sum what we had here. So-called static support and resistance levels are horizontal and can’t move. On the other hand, dynamic support and resistance levels are moving and they are not horizontal. 

    What causes support and resistance?

    When a price goes up and down, it faces obstacles on the way. If obstacles act in a way to prevent the price to drop lower, we are talking about – support. Hence, when it stops the up progress, it is resistance.

    Support is formed when more traders are selling than buying. Sellers will usually cover their short positions and take the profit. The price will go lower and lower. As it happens, buyers will start to buy at that lower price and many of them will enter the new long positions. If the number of buyers is bigger than the sellers, they will create a support level eventually. But if the price moves up that means the more traders are buying and if the number of sellers is bigger than the number of buyers it is so-called resistance.

    How moving averages help to find support and resistance levels

    The question is how do we estimate the strength of the signal we’re seeing. Is it breakout or bounce? There are moving averages as support and resistance levels on the scene to help us. One of the benefits of using moving averages for this purpose is their ability to be handy even when the market price is going through a hidden area in our charts.

    Have you ever had trouble finding key support and resistance levels when looking at the charts? Of course, you had. It is pretty much usual that when looking at charts and notice a price action, you see the price is pulling back but you cannot find support or resistance levels in that zone. But if you try to reveal how the market is valuing dynamic levels, your charts will be more clear. Moreover, you’ll find some trading opportunities you were missing before. That’s kind of an “angle-changer”. You have one perspective more to judge your trade.

    One of the best ways to estimate the ability of support or resistance levels is to watch price action around them. It isn’t hard to read price action. For example, on candlestick charts it’s easy. 

    For example, if you use the 15-minute chart and the price rises to the 50 EMA. That could be a really good dynamic support or resistance level. You’ll notice that every time the price touches 50 EMA and tests it, you’ll see a bounce back down because the price uses this moving average as resistance. Try it, it’s simply amazing. But the price will not always perfectly bounce back from the moving average. Sometimes it will go a bit above before it starts going back in trend direction.

    Sometimes the price will simply explode through it all together. Some forex traders usually leap on two moving averages and buy or sell when the price is in the middle of the zone between the two moving averages.

    Does this really work?

    The logic behind why moving averages as support and resistance work are very similar to why price moves. Let’s say that the majority of traders use 10-days, 20-days. 50-days, 100-days or 200-days moving averages. So, what do you think, what can happen when almost 90% of them use all these five? Nothin special. But if they choose to use only one of them in expectation for it to operate as support or resistance? Yes, you’re right. The price will respect that. When more traders expect something to happen and they have a common goal, it will happen.
    Let’s examine this in the case of 10 and 20 EMAs that are providing support and resistance. What can you see?

    Can you see how the 10 and 20 EMAs are providing support and resistance?  These moving averages can be a powerful help but only if used with the right assembly factors. Let’s look at a setup where they unite several other factors.

    Can you see how the pin bar marked in the red circle rejected the 10 EMA and a key price action level both? We have a clear uptrend without resistance beyond this key level. This was an example of a great setup. Feel free to test it.
    The price will rarely bounce exactly, again, and again from the same moving average. Instead, it’s more efficient to form a support or resistance zone between two moving averages.
    When the price moves into the zone between the 20 MA and 50 MA, we should ask if a reversal is going to happen. That could be a danger zone, so it may be smart to hedge the position.

    How to use moving averages to lock in profit

    If you want to lock in profit, move up your stop level in your trend-following trade only if you have a clear signal of bounce from moving averages you use as support or resistance. That is one of the tricks for using moving averages as support and resistance. But you have to keep in mind that moving averages as support and resistance levels are just saying to us what’s going on at these levels. We still have to look out for additional signals and find them. 

    The truth is that if you add MAs you’ll have additional in-trade information that may help you to maximize your trades. But like everything in Forex, you’ll have no guarantees. Consider these averages as a tool in your trading toolkit that you can adopt and use to increase your trading success.

  • Pure Play Method In Stock Investing

    Pure Play Method In Stock Investing

    Pure Play Method In Stock Investing
    Pure play method represents an approach practiced to estimate the beta coefficient of a company whose stock is not publicly traded. 

    What is a Pure Play method in investing? Have you ever heard about this? How do you estimate the companies when you want to invest your money in different stocks? What tools do you use? Do you make your investment decisions by looking at cash flow, dividends, the strength of the company? What are your criteria? Maybe it is easier for you to estimate the company that produces only one single product. If you do the latter mentioned, you already know what is a Pure Play method in investing. But do you know all Pure Play’s performances and risks?

    Before we explain them to you we’ll explain what is a Pure Play method.

    What is a Pure Play method?

    Investors use this method when estimating the beta coefficient of the company whose stock isn’t publicly traded.  

    A Pure Play company is focused on one type of product. It is different from the companies that are conglomerates, offering many products. Pure Plays are easier for investors to analyze. When investing in Pure Plays you’ll have maximum exposure to a distinct market part.  For example, if you want exposure to car makers stocks you might prefer buying Tesla stock. As compared to Yamaha Motor Co.which is engaged not only in making cars but also in many other industries. This company is producing motorcycles, boats, guitars, outboard motors, etc.

    A Pure Play method is a procedure that investors use to estimate the beta of such a company. But the Pure Play method is also a way to discover the cost of capital for a product or project that is different from the company’s principal business. 

    Many companies are pure plays. They are selling or producing one singular kind of product. So, you can understand that this kind of investing can be very risky because if interest in this particular product or service declines even a bit, such a company will be affected negatively. A Pure Play method is helpful to estimate a project’s beta or the risk of a project. For example, a Pure Play company could use this method to identify publically traded companies that are involved in projects similar to the one they want to develop. 

    Use it to estimate the cost of equity capital of a private company

    This involves examining the beta coefficient.

    When evaluating a private company’s equity beta coefficient, you’ll need a beta coefficient of a public company. The latter you can calculate when regressing the return on public company’s stock on the appropriate stock index. The resulting calculation is then applied to return the beta coefficient of a private company. Here is how to do that. Let’s mark the private company as P and public company as PB.

    In our equitation, we’ll mark debt to equity ratios as DEB and DEPB for the private and public company respectively.

    Unlevered Beta of PB = Equity Beta of PB / (1 + DEPB × (1 − Tax RatePB))

    Equity Beta P = Unlevered Beta of PB × (1 + DEP × (1 − Tax rate))

    Advantages and disadvantages of the Pure Play method 

    The stock of Pure play company is different than stocks of diversified ones. They are popular among investors who want to make a particular trade on particular products. In short, they are not interested in investing in a company that has different business lines. They found reasons to invest in Pure Play stocks and we’ll try to explain them. Firstly, these stocks are easier to analyze. Also, when you have to analyze a company with diversified businesses and several sources of income, you might have a problem evaluating the strength of the company. Its income is generated from many products, with different profit margins, and could be exposed to different growth benchmarks. 

    Further, despite the fact that investing in Pure Plays can be riskier, they can be a great opportunity for very high rewards when doing well. Should we mention Tesla? But wait! Pure Play method in investing has its disadvantages too. These companies are not diversified. What will happen if difficult times appear? When the company is focused on just one product and that one isn’t able to generate revenue, the stock price of such a company will drop, sometimes sharply. These companies don’t have other products to balance the poor production. That’s a great problem for investors.

    The risk of Pure Play method in investing

    First of all, the risk comes from some conditions that may affect the company badly. However, that isn’t the only reason. The additional risk might come from the type of investing style. Here is one example. Let’s assume the growth investors favor some Pure Play company. In periods of the bull market the company will perform well. Even more, its stock could easily outperform the market. But what will happen when the bear market appears? Well, we know that during the bear markets the value investing is a more successful strategy. The consequence is that the Pure Play method will have poor results if growth investors stick with it. 

    These companies depend on one product or one investing strategy. So they are often followed by higher risk. They are completely the opposite of diversified. However, the higher risk gives greater potential for higher profits. When circumstances are in their favor, Pure Play stocks can grow tremendously since the company is focused on a sole product with full strength. 

    Reasons to use it in investing

    We’ve been writing so many times about the importance of diversification in investing. Also, we pointed out that investing in a single company isn’t always the smartest idea. But when it comes to the Pure Play method in investing, things are a bit different. 

    There are really a few good reasons to invest in pure plays. Pure Play company is considerably easier to analyze. You have, as an investor, only one type of product or business line to analyze. Moreover, it is easier to understand the cash flow and revenue of one company than it is a case with several. Further, you can with a better result predict how it will perform in the future. 

    Pure play can be a very attractive investment. These companies work a strictly defined niche market. They are specialized for a particular one. That is a quality per se and could be extremely beneficial for investors. 

    Bottom line

    Pure play is a method used in stock trading and investing. It is all about companies with a focus on a specialized and particular product or service. The “Pure Play method” is also helpful when estimating a project’s beta, or the risk of a project.

Traders-Paradise