Tag: Investment

All investment related articles are found here. Educative, informative and written clearly.

  • Investment Portfolio Rebalancing – Why Should We Do That?

    Investment Portfolio Rebalancing – Why Should We Do That?

    Investment Portfolio Rebalancing - Why Should We Do That?
    Even if you’re a less aggressive investor, you should rebalance your portfolio at least once a year.

    By Guy Avtalyon

    You invested your hard-earned money for the long term, you added your lovely stocks, bonds, whatever, and thought everything is done and suddenly somebody told you’ll need investment portfolio rebalancing. What? Should you find an accountant? What you have to do? How to perform that investment portfolio rebalancing? What does it mean, at all?

    That is the main key, the fundamentals of investing. You have to do two main things: building it and investment portfolio rebalancing. 

    The investment portfolio is a collection of your investments. You hold stocks, bonds, mutual funds, commodities. The allocation of the assets you own has to be done based on your risk tolerance and your financial goals. But nothing is finished with the moment you bought your lovely assets. It is just a beginning. After a few years or sooner you’ll notice that different assets generate different returns and losses as well. Some stocks may have nice and high returns, so they become a large part of your portfolio. Much bigger than you wanted. 

    Assume you built up a 60/40 portfolio where 60% were in stocks. But after some time, you found that the value of those stocks represents over 80% of your portfolio’s overall value. What you have to do? Honestly, it is the right time for investment portfolio rebalancing.

    Investment portfolio rebalancing means that you have to adjust your investments, you have to change the asset allocation of the portfolio to obtain your desired portfolio outlook.

    Why is investment portfolio rebalancing important?

    It will help you to keep your desired target asset allocation. In other words, to keep the percentage of assets you want to hold adjusted to your risk tolerance and to earn the returns you need to reach your investment goals. If you hold more in stocks, you’re taking on more risks since your portfolio will be more volatile. That might have a bad influence on your portfolio because the value will change with changes in the market. 

    But stocks look like a better investment than bonds due to their ability to outperform bonds as a long-term investment. That is the reason to hold more stocks than bonds in your portfolio but as a reasonable portion to avoid additional risk.

    In periods when the stock market performs well, the portfolio’s money value that’s come from stocks will grow along with stock price rise. We already mentioned this possible scenario when your 60% of holdings in stocks rise to over 80%. This means your portfolio can become riskier. So, you’ll need investment portfolio rebalancing. How to do that? Simply sell stocks until you manage them to represent 60% of your portfolio. For the money received from that selling, you can buy some less volatile assets such as bonds, for example. 

    The drawbacks of investment portfolio rebalancing

    However, there are some problems if you rebalance your portfolio during the time when the markets are doing well. Even more, it can be hard to sell stocks that are doing well, they are your winners and their prices might go even higher. What if you miss huge returns?

    But consider this. What if they drop and you lose an important amount of money? Are you okay with that? 

    Remember, every time you sell any asset that is an excellent player, you are actually locking in gains. That’s real money and you can use it to obtain some stocks that are not such a good player but you’ll buy them at a bargain. Do you understand what you actually did? You sold high and bought low. You’re every single investor’s dream. You made it happen! 

    The real-life example 

    Our example of rising to 80% is rather drastically than a realistic one. Investment portfolio rebalancing ordinarily means selling 5% to 10% of your portfolio. We are pretty sure you are able to choose 5% of your winners and to buy some current losers but in the long run also winners. Investors usually buy bonds instead of stocks when rebalancing their portfolios. 

    Investment portfolio rebalancing is important because it provides you balanced asset allocation and, what is also important, in this way you’ll avoid additional volatility of your portfolio. If you’re the risk-averse type of investor this added risk might produce bad investment decisions. For example, you might sell stocks at a loss.

    Investment portfolio rebalancing is the best way to follow your financial plan and obtain the best returns adjusted to your risk tolerance. Anyway, you don’t need to be overweight in stocks because the markets are cyclical, and it could be a matter of time when the next reverse will come.

    Why rebalancing your investment portfolio?

    Let us ask you. Are you having a car? Do you change the oil or broken parts from time to time? The same is with your investment portfolio even if it is the best created. As we said, the markets are cyclical and some parts of your portfolio might not play well in every circumstance. Why should you want to hold a stock that isn’t able to meet your investing goals or you bought it by mistake?
    It isn’t hard to rebalance your portfolio, at least once per year. In short, that is investment portfolio rebalancing. If you think your investment portfolio is well-diversified among asset classes, just think again. Maybe it is diversified among asset classes but is it diversified within each asset class?

    For example, why would you like to hold only Swiss biotech stocks? There is no reason. Moreover, it can be dangerous. It can hurt your investment portfolio a lot. It is better and safer if you hold a mix of different stocks, domestic and foreign from different sectors.

    What if some of the investments grow in value while others decline? 

    In the short term, it is good. In the long run, it can be a disaster. That is the reason to rebalance your portfolio promptly and properly. Otherwise, your portfolio will be hurt as well as your overall returns.

    For example, you own 50% in stocks and 50% in bonds. Sometime later, your stocks performed unsuccessfully and their value is lower now, but bonds performed outstandingly. So, what do we have here? Bad performers – stocks at lower value and bonds as excellent players at a higher value. Would you think to change the proportion in your portfolio? Of course, you would. So, what do you need to achieve that? 

    Let’s examine a different mix. For example, you may rebalance your portfolio and now it will be 40% in stocks and 60% in bonds. But what is the consequence if you don’t rebalance your portfolio and stay with your initial mix? You will not have enough capital invested in stocks to profit when stocks come growing back. Your returns will be below expected.

    What if stocks were growing in value while bonds did unsuccessfully? Or, what if your portfolio turned into a collection of 60% stocks and 40% bonds, and quickly the stock market dropped? You’ll have greater losses, much bigger than it is possible with rebalanced the 50/50 mix. In short, you had more money in stocks. Your long-term gains are in danger.

    To make a long story short, when rebalancing, you have to cut the over-performing stocks and buy more underperforming assets. The point is to sell overvalued stocks and buy less expensive but with good prospects. Do you understand this? We came up again to the winning recipe: buy low, sell high.

    How often should you do that?

    The answer is short, once or twice per 12 months mostly. Markets are cyclical and unpredictable. However, if you rebalance at an uncertain period of the year you’ll put your money at risk. Never avoid rebalancing your portfolio after significant market moves. Follow a 5-percent rule. Your investments should be within 5% of where they were when you build your portfolio. For example, if your initial portfolio was with 60% in stocks (you were smart to buy good players) and after several months they changed to 65% or over, it’s time to rebalance. In case you weren’t so smart and you bought poor performers and they changed to 55% or below, it is also time to rebalance. You have to prevent your portfolio from fluctuating more than 5%.
    That’s the whole wisdom.

  • Time To Buy Stocks Is Right Now!

    Time To Buy Stocks Is Right Now!

    Time To Buy Stocks Is Right Now!
    The advantage of buying stocks right now is that you can get more for your money. If you are young, the more you do with your money now, the more it will be able to grow throughout your lifetime.

    By Guy Avtalyon

    Yes, this is time to buy stocks.  That would be a short answer but here is why this is a time to buy stocks. 

    Stock prices are changing violently because of the economic slowdown caused by a new coronavirus outbreak. So, the volatility makes it especially challenging to answer this question because it may vary on a daily basis. Maybe the most critical part of any investment decision is the stock valuation on which we base our decisions, should we buy or sell the stock. Moreover, that can tell us a lot about other investors’ feelings toward some particular stock. So, you need an explanation of our observation that this is time to buy stocks.

    Here are some real examples but we have to go back in the old days. 

    The historical overview

    It was the year 1974.

    In the period of 1973-1974 bear market ultimately bottomed. It marked a 43% decline for the Dow Jones in a time frame of two years or even less. This bear market ended December 6, 1974, when the Dow Jones hit 577.60. The large sell-off caused a lot of damage to the U.S. market and it took approximately 20 years to entirely recover. But, at the same time, every investor who had guts to buy stocks then, had great returns later.

    The second occasion was in 1982. 

    The Bear Market of 1982. The market had been falling for almost one year and two months, actually exactly 451 days. In just one day, it was February 22, the S&P 500 Index was down for almost 21%. Inflation in the US was at 13.58% but also, it was a rough year for the rest of the world. But some investors were smart and made their life-time investment by buying stocks.

    The next was the stock market crash of 1987. 

    This market crash originally came from the US but had a great impact on the global economy. In October that year, DJIA fell by 22,6%. It was a well-known Black Monday. Until then, Dow Jones never had such a drop in one day. And as in previous cases, some investors made smart choices,  and bought stocks rather than sell them and it was a very profitable decision for them.

    Horrible 2008/09

    The most recent event, before 2020, happened in 2008 and 2009. This bear market actually lasted from October 9, 2007, to March 9, 2009. 

    The S&P 500 Index lost about 50% of its value, and the DJIA fell 777.68 points in intraday trading. It was the largest drop point fall until this year’s market crash. Also, some were smarter than others and they bought the stocks instead of selling them. In other words, during the market’s crashes during history, the most successful investors were buying.

    What do these events have in common?

    They were all connected to some kind of crisis. And each market situation was characterized by capitulation. 

    The stock market capitulation means giving up. It is the point when investors are giving up on attempting to recover lost gains caused by falling stock prices. For example, a stock you own has dropped by 20%. You have two alternatives: to wait it out with hope the stock starts to appreciate again, and the other solution is to compensate for your loss by selling the stock. When most of the investors choose to wait it out, the stock price will probably continue almost stable. But if most of the investors choose to give up on the stock, the stock price will decrease further and sharply. When this event is relevant to the entire market, it is a market capitulation.

    What else is in common for these market crashes? The most profitable investors were buying stocks. It looks like selling wasn’t the right option for them.

    So, we can easily conclude that time to buy stocks is right now. This is an amazing chance to buy stocks because they are cheap now.

    When is the right time to buy stocks?

    The truth is that almost all investors are scared. The possibility of losing all capital is enormous and some of them are starting to get out of the market. Everyday volatility, stock prices changes in milliseconds, have a great influence on investors’ emotions.

    The markets’ crashes, we mentioned above, weren’t quite severe as this one is. This bear market marked a 20% drop from the recent market highs. So, despite the fact that this drop is so sharp, it could be a good time to buy stocks.

    Yes, we know that investing in this time may sound strange and nonsense for someone. But, at the same time, if you are seeking long-term investment it could be the best time. For example, you can buy some blue-chips at a very favorable price. Such are, for instance, Walt Disney, or Coca-Cola. Just follow the KIS rule and look at the most prominent. These companies and similar survived through previous market crashes and came out stronger providing great returns.

    You can create real wealth in stocks now. Just don’t watch from the sideline. React and do it now.

    Is this time good to buy stocks?

    Stop dreaming and guessing. Listen to good advice only. Have an investing plan.
    Start investing with an edge, that will give you an advantage over other investors. Buy the stocks that were the best players last year. 

    Watch what the world’s billionaires do, the path they made. Allow them to show you what stock to buy. They are strong enough to fight for their investments, but at the same time, they will increase the value of yours. 

    It isn’t time yet to estimate the accurate impact the coronavirus pandemic will have on the companies. The results will differ by company. Some will manage better than others, but that’s how things go. What we can do is to find the company built to last. Take a look at their revenues for the past several years or at least for the last one. Some did great. So buy its stock at a discount. 

    You have to know that this pandemic will have influence over the next several years. Just don’t panic. This is not the time for that. This is a time to buy stocks if you have some extra money that you’ll not need in the coming years. Just invest it in brands. This lesson came from history. 

    Investing is more available than ever. That means you don’t have to rely on some difficult strategy to start earning money. You can buy options, you have help from free trading platforms, apps to create an investment plan that matches your goals, and risk tolerance. You are investing for the long haul. Ignore the panic and understand why it is the right time to buy stocks. Set clear goals, and recognize your limits. Keep in mind, investing in stocks is one of the easiest ways to put your money to work.

  • Calculate Portfolio Performance

    Calculate Portfolio Performance

    Calculate Portfolio Performance
    Don’t base the success of your investment portfolio on returns alone. Use these three sets of measurement tools to calculate portfolio performance.

    The main goal to calculate portfolio performance is to measure the value created by the investor’s risk management. The majority of investors will judge the success of their portfolios based on returns. But it isn’t enough. To have a sense of how our investment portfolio is well-diversified and how much risk we take we need to calculate portfolio performance. In other words, we need a measure of both risk and return in the portfolio to judge its success. Until the 1960s no one paid attention to the risks involved in obtaining returns. But today we have several ways to calculate portfolio performance and measure it. 

    Our aim is to present you with these valuable tools. 

    Sharpe, Jensen and Treynor ratios pair risk and return performances, and unite them into unique value. Well, each of them operates a bit differently so we can choose one to calculate portfolio performance or mix all three ratios.

    Calculate Portfolio Performance Using Sharpe Ratio

    Sharpe ratio is the measure of risk-adjusted return of an investment portfolio. Or in other words, by calculating it we can find a measure of excess return over the risk-free rate relative to its standard deviation. It is common to use the 90-day Treasury bill rate as the representative for the risk-free rate. This ratio is named after William F Sharpe. He is a Nobel laureate and professor of finance, emeritus at Stanford University.

    The formula is:

    ​Sharpe ratio= (PR−RFR) / SD

    ​In this formula, PR represents the expected portfolio return, RFR is the risk-free rate, while SD represents a portfolio’s standard deviation which is a measure for risk. Standard deviation reveals the variation of returns from the average return. So we can say that if the standard deviation is great, the risk involved is also great. 

    So, you can see how the Sharpe ratio is simple to calculate since it has only 3 variables. 

    But let’s calculate portfolio performance more realistic. For example, our portfolio has a 20% rate return. The whole market scored 15%. So, we may think that our portfolio is greater than the market, right? But it isn’t a proper opinion. How is that? Well, we didn’t calculate the risk we had to take to earn such a great rate return. What if we took much more risk than we thought. That would mean that our portfolio isn’t optimal. Let’s go further in this analysis. Imagine that our portfolio has a standard deviation of 15% and the overall market has 8%, and the risk-free rate is 3%. This is just a random example. Let’s calculate portfolio performance now using the Sharp ratio formula.

    Sharp ratio for our portfolio: (20 – 3) / 15 = 1.13

    and

    Sharp ratio for the market: (15 – 3) / 8 = 1.5

    Can you see now?

    While our portfolio scored more than the overall market, our Sharpe Ratio was notably less. So, our portfolio with a lower Sharpe Ratio was a less optimal portfolio even though the return was higher. This means we took an excess risk without extra bonus. But it isn’t the same case when it comes to the overall market, it is actually the opposite. When the market has a higher Sharpe ratio, it has a higher risk-adjusted return. The best portfolio is not the portfolio with the highest return. Rather, an excellent portfolio has a higher risk-adjusted return.

    Sharpe ratio is more suitable for well-diversified portfolios because it more correctly considers the risks of the portfolio. 

    Jensen ratio

    The Jensen ratio gauges how much of the portfolio’s rate of return is attributable to our capability to produce returns above average, and adjusted for market risk. 

    The Jensen ratio measures the excess return that a portfolio produces over the expected return. This figure of return is also recognized as alpha. Let’s say that our portfolio has positive excess returns, so it has a positive alpha. On the other hand, a portfolio with a negative excess return has a negative alpha.

    The formula is:

    Jenson’s alpha = PR−CAPM

    Here, PR stands for portfolio return and CAPM is risk-free rate+β( beta). We know that beta is the return of the market risk-free rate of return.

    ​By using Jensen’s alpha formula we can calculate an investment’s risk-adjusted value. It is also known as Jensen’s Performance Index or ex-post alpha. Jensen’s alpha tries to determine the unusual return of a portfolio no matter what assets it consists of. This formula was first introduced by the economist Michael Jensen. Investors use this formula to calculate portfolio performance by enabling them to discover if an asset’s average return is adequate to its risks.

    Regularly, the higher the risk, the greater the expected return. So, that’s why evaluating risk-adjusted performance is especially important for making investment decisions. It will allow doing this. 

    This Jensen’s alpha also can be expressed as 

    Jensen’s alpha = Portfolio return – ((Risk-Free Rate + Portfolio Beta x (Market Return – Risk-Free Rate))

    The alpha figure can be positive or negative. When it is higher positive values that suggest better performance in comparison to expectations while negative rates showed that the assets perform below expectations. Jensen’s alpha is expressed in percentages. 

    Let’s take the example of a stock with a return per day based on CAPM. And we see that it is 0.20% but the real stock return is 0.25%. So, Jensen’s alpha is 0.05%. Is it a good indicator? Yes, you can be sure.

    The purpose of this measure is to help investors to go for assets that grant maximum returns but with minimum risks.

    For example, you found two stocks that are offering similar returns. But one with less risk would be more profitable for investors than the one with greater risk. When calculating Jensen’s alpha you would like to see a positive alpha since that indicates an abnormal return.

    Treynor ratio

    The Treynor ratio is very useful to calculate portfolio performance. It is a measure that uses portfolio beta,  a measure of systematic risk. That is different from the Sharpe Ratio that adjusts return with the standard deviation. 

    This ratio represents a quotient of return divided by risk. The Treynor Ratio is named after Jack Treynor, the economist, and developer of the Capital Asset Pricing Model.

    The formula is expressed as:

    Treynor ratio = (PR−RFR) / β

    The symbols are well-known, PR stands for portfolio return, RFR refers to the risk-free rate and β is portfolio beta.

    We can see that this ratio takes into account both the return of the portfolio and the portfolio’s systematic risk. From a mathematical viewpoint, this formula expresses the quantity of excess return from the risk-free rate per unit of systematic risk. And just like the Sharpe ratio, it is a return/risk ratio.

    Let’s assume we would like to compare two portfolios. One is the equity portfolio and the other is the fixed-income portfolio. How can we decide which is a better investment? Treynor Ratio will help us pick the better one.

    To put this simply, assume for the purpose of this article only, the equity portfolio has a total return of 9%, while the fixed-income portfolio has a return of 7%. Also, the proxy for the risk-free rate is 3%. Further, let’s suppose that the beta of the equity portfolio is 1.5, while the fixed-income portfolio has a beta of 1.25

    Let’s calculate for each portfolio!

    Treynor ratio for a equity portfolio = (9% – 3%) / 1.5 = 0.040 

    Treynor ratio for a fixed-income portfolio = (7% – 3%) / 1.25 = 0.032

    So, the Treynor ratio of the equity portfolio is higher which means a more favorable risk/return option. Since the Treynor ratio is based on past performance it is possible not to be repeated in the future. But you will not rely on just one ratio when making an investment decision. You have to use other metrics too.

    For the Treynor ratio, it is important to know that the negative value of beta will not give exact figures. Also, while comparing two portfolios this ratio will not show the importance of the difference of the values. For instance, if the Treynor ratio of one portfolio is 0.4 and for the other 0.2, the first isn’t surely double better.

    Bottom line

    To calculate portfolio performance we have to determine how our portfolio has performed relative to some benchmark. Performance calculation and evaluation methods fall into two categories, conventional and risk-adjusted. The most popular conventional methods combine benchmark and style comparison. The risk-adjusted methods are focused on returns. They count the differences in risk levels between our portfolio and the benchmark portfolio. The main methods are the Sharpe ratio, Treynor ratio, Jensen’s alpha. But there are many other methods too.

    But one is sure, portfolio performance calculations are a key part of the investment decision. Keep in mind, portfolio returns are just a part of the whole process. If we never evaluate the risk-adjusted returns, we will never have the whole picture. That could lead to wrong decisions and losses, literally.

  • CAGR – What Is It And Why You Should Know

    CAGR – What Is It And Why You Should Know

    CAGR Compound Annual Growth Rate
    Just like any other metric, CAGR is helpful but is more valuable as part of a larger analysis. Investors would need to look further.

    When new investors ask what is CAGR they have in mind some complicated formulas and Excel. Well, yes it is but it isn’t so complicated and Traders-Paradise will explain all about CAGR. 

    As first, if you want to build wealth, you have to hold an investment that provides you compounding. That could double your investment. 

    CAGR reveals how much your investment increased over time. It represents the average returns you have earned after some period. That period must be longer than one year. But here we come to the main point of compounding. If you count that only one stock could provide you a steady rate of return every year, forget it. The rate is changing. You will need to add more investments to your portfolio. And when you do that you would like to know how big is the profit you earned for your investments as a whole. Especially if you reinvest. Let’s say you invested in some company and your plan is to reinvest your gains over 5 years. Compound Annual Growth Rate will show you how much return earned you for each year during the holding period. Remember, you have to reinvest your gains every year. 

    CAGR is one of the most accurate methods to calculate returns for your investments, for each separately and for the whole portfolio. Basically, it is the best way to calculate returns for everything that can grow or drop in value.

    You will find that investment advisors like to use this word CAGR when they want to promote their offers. But we would like you to understand what Compound Annual Growth Rate really means and what represents.

    Compound Annual Growth Rate explained 

    CAGR or compound annual growth rate stands for the growth rate that your initial investment will need to grow to an established level over a given period of time. It is similar to compound interest.

    Your investment portfolio will have different rates of return over different times. Let’s say you might have huge gains one year, but the next year wasn’t so good, you made some losses.

    CAGR enables you to calculate returns of your whole portfolio over several years. That period can be 3, 5, 10 years and you can easily figure out how your investments have performed over that given period. That can help you to compare your investments to others.

    CAGR is a mathematical formula

    For example, you invested $10.000 at the beginning of 2018. By the end of that year, your investment grew to $20.000, a 100% return. But the next year you lost 40% and you end up with $12.000.

    So, how to calculate the return for these two years? If you try that by using annual return you will not have an accurate result. It will show you the average annual return of 30% on your investments (100%  gain and 40% loss). Which is a misleading number, because you have ended up with $12.000 and not $16.900.
    The average annual return doesn’t work and you’ll need to calculate the CAGR. So let’s do it.

    We have to divide the ending value of the investment by the beginning value of the investment for a given period, in our case, it is 2 years.

    Raise this result to the power of 1 divided by the number of years we are doing calculations for, which is actually square root in our case.

    And finally, we have to subtract 1 from the last result and multiply the result with 100 to get a percentage.

    ((ending value /beginning value) ^ (1/2) – 1) x 100

    That’s it.

    Compound Annual Growth Rate, in this case, is 9.54%

    Over the 2-years period, your investment grew from $10,000.00 to $12,000.00, and its overall return is 9.54%.

    CAGR actually provides a more precise view of your annual return. Our investment started at $10,000.00 and ended with $12,000.00. In the first year, it grew 100%, in the second we lost 40%. But despite this fluctuation, our investment shows a positive return through its lifetime.

    Why use the Compound Annual Growth Rate calculation?

    It is a helpful tool to compare different investments over a similar investment range. One of the most important advantages of using CAGR is that it, as a difference from the average annualized rate of return, doesn’t let the influence of percentage changes over the investment’s life. 

    Our example shows that the investment produced a 100% return in the first year, boosting the value from $10,.000 to $20.000. When you reinvested (our potential scenario) the whole capital you lose 40% and the value of investment fell. But it generated a positive return over the lifetime of two years.  

    Also, you can use this calculation as help to determine what type of annual returns you maybe need to reach your investing goals. For example, take some imaginary sum into the account and calculate is it good for your goals like retirement or buying a house, for instance.

    Disadvantages

    The disadvantage of CAGR is that it expects growth to be constant and may produce results different from the real situation when it comes to high volatile investment. Investors use this calculation for periods of 3 to 7 years. Over the longer periods, CAGR could lose some sub-trends, simply it can hide them. 

    CAGR doesn’t consider investment risk and volatility. It will always show a smooth yield. So, you may think you have a stable growth rate even when the value of your investment is varying a lot.

    So, remember this, the volatility and investment risk, are essential to examine when making investment decisions. But CAGR will tell you nothing about them. It does not estimate the non-performance associated circumstances in the change of value.

    Bottom line

    CAGR or compound annual growth rate is a helpful tool for measuring the growth over various periods. Imagine it as a jump from your beginning investment value to the ending value while you reinvest all the capital all the time.

    Using it you’re able to evaluate different investment options. But it will not tell you the whole truth. Analyze investment options by comparing their CAGRs from the same periods’, compare the one investment’s annual return to some other investment’s annual return. To evaluate the relative investment risk you will need a different measure.

    CAGR neglects the cash flows or volatility. But in combination with other metrics, it can give you a good view of investments or portfolio.

  • Diversification Is Important to Your Investment Portfolio

    Diversification Is Important to Your Investment Portfolio

    Diversification Is Important to Your Investment Portfolio
    When stock prices drop, bond prices increase. A portfolio that holds stocks and bonds plays better than the one that holds only stocks.

    Diversification means to spread the risk across different types of investments. The main purpose of diversification is to enhance your chances of investment success. In other words, you are betting on every one.

    Diversification is very important in investing because markets can be volatile and extremely unpredictable. If you diversify your portfolio, you will reduce the chance to lose more than you are prepared to.

    And that is exactly what you would like in investing: to spread your capital among different assets. So you’re not relying on a single asset for all of your returns. The key advantage of diversification is that it provides you to minimize the risk of losing the capital invested.

    What is diversification?

    Diversification means building a portfolio of your investments in a way that the majority of the assets will have a different reaction to the same market performance. For example, when the economy is growing, stocks will outperform bonds. In opposite circumstances, bonds could play better than stocks. Hence, if you hold both stocks and bonds, you will reduce the risks in your portfolio from market swings. 

    Let’s make this more clear. What do you have in your pantry? Only beans? Of course not! When you went to the grocery you bought everything you need for the week or month ahead. The same should be with your investment portfolio. It should consist of various assets. But not too many. Too many assets mean you will not be able to follow their performances. If you are fresh in the stock market, maybe a two-fund portfolio is a good choice for you. More about this you can read HERE

    Think of these various types of groceries as the different areas, techniques, and areas available to you as an investor. If you have a variety of assets, you’ll be better protected. In the situation when one of your assets is hit by the risk you will still have the others that can give you a profit.

    Reasons for diversification

    Even the explanation is so simple you can still find so many investors that play on one card. You may ask how some really smart guys could avoid diversification and put all eggs in one basket? We couldn’t find the proper answer because the benefits are so obvious.

    By diversification, investors lower the overall risk. It is logical how this works. When you spread your investments in various classes (diversifying them) you have more chances to avoid the negative influence in your portfolio. For example, let’s say you invested in stocks only and you hold a stock of just one company. Yes, we know you like it, it is a good company, famous, well-run. But if suddenly something unpleasant hit it and the stock price drops, let’s say, for 30%, how that occasion will influence your overall portfolio? You will lose 30% of your portfolio.  But let’s consider the other situation. Let’s say that stock makes up a modest part of 5% in your portfolio. So, how much of your overall portfolio you will lose now? Can you see where is the benefit of diversification? It lowers the risk. Even during economic downturns, you will still have good players in your portfolio. Hence, if you have bonds and stocks added to your portfolio, it is more likely that even one of them will run well during particular circumstances. Bonds will play better when the economy is decreasing, but when the economy is growing, stocks will outperform bonds.

    Diversification and investment strategy

    You can find various investment strategies but two are most popular: growth and value investing.

    Value investors tend to consider the strength of a company and its management. They would estimate if the company’s stock price is undervalued based on its true worth. 

    On the other side, growth investors would estimate how fast the company is growing, could its new products stimulate future earnings, etc.
    By taking just one strategy you can miss out on the benefits of the other. But if you spread your investments on both of these strategies, it is pretty sure that you’ll be able to enjoy the benefits of each.

    Influence of “home country bias”

    Well, it is completely natural that investors are more attracted to their own state markets, the national industry. That’s how we come to the “home country bias”  in investing. Of course, it is a natural tendency. But it can be a problem too. “Home country bias” can limit your investments to the offer from domestic markets. But what is needed for profitable and successful investing is to step out of your comfort zone. Foreign markets can be profitable also. What you have to do as an investor is to add some international fund or company to your portfolio. It is good protection and well-done diversification. Diversification across international markets will protect your investments if the domestic economy downturns (no one wants that, of course) or during the recession in your country. Several years ago we heard one of the investors saying it isn’t a patriotic gesture. Well, we have to say, investing isn’t an act of patriotism. It is all about profit.

    Produces more opportunities

    Eventually, diversification produces more opportunities if you make smart choices that deliver balance to your investment portfolio. 

    For example, you only invest in stocks. But suddenly some great opportunity occurs to invest in, for example, bonds. What will you do? Refuse to invest in bonds because you are not comfortable with them and risk to miss potential profit? We don’t think it is a smart idea. Never miss the opportunity to earn more, that isn’t in the nature of investing. Admit, you will never miss this opportunity to invest in bonds if you have a diversified portfolio. So, diversification gives you more opportunities to invest.

    Protect and improve your finances

    It is important to understand all the benefits of diversification. It isn’t hard to do. Actually, it is very simple. You have to read more, learn and be patient. If you diversify your investment portfolio you will have a chance to build stable finances over time.

    How to diversify your portfolio

    Firstly, never be too much invested. You will not be the winner if you own hundreds of assets. Okay, let’s say this way. Your portfolio is your team. And, as in every team, each part plays its role. No coach will put all players in one position. It’s stupid. Plus, how such a team will win anything? Of course, zero chances! 

    The point of diversifying is to hold investments that able to work separated tasks on your team. 

    Every single part of your portfolio should have a different role. For example, if you prefer stocks, diversify your portfolio to S&P 500 (that would provide you exposure to large-caps) and add some small-caps.

    If you have a bond portfolio diversify it across short and long bonds, or higher-quality bonds, etc. That will reduce the risks. Or just add alternative investments in your portfolio. For example, private equity, hedge funds, real property, venture capital, commodities, etc.

    Bottom line

    How will you know you’re diversified? A well-diversified investment portfolio will never move in the same trend and at the same time. You must have one thing on your mind: you are the manager of your portfolio. Also, it is almost impossible for all investments to grow all the time. It is 100% sure that some of your positions will be lost, will lose you money. When that happens you will need the other holdings to balance that fall.

    Diversification guards you against producing an undesired risk to your capital. Anyway, it is too risky to put all your money into one single investment. The key to diversification is to spread your money across asset classes and to allocate within classes. That is a smart approach.

  • The Average Stock Market Return

    The Average Stock Market Return

    The Average Stock Market Return
    The stock market average return of 10% is exactly that – an average, while the returns for any particular year may be lower or higher.

    The average stock market return was about 10% annual for the past almost 100 years. But when we take a look at any year particularly we could notice that the returns weren’t always average. And that is the truth about the average stock market return, it is average rarely.

    Historical data shows the average stock market return is 10% but when you look at year-to-year it can vary. For example, this rate should be reduced by inflation. Inflation can vary too let’s say from 2% to 3% which is a regular rate. 

    But when we talk about investing and investors we usually think about long-term investments. To be honest, the stock market likes long-term investors. They are keeping their investments five or more years.

    Keep in mind: the stock market’s returns aren’t average and could be far from average. For example, over the past 80 years, you could find that the average stock market return was from 8% to 12% only several times. Due to the volatility of the stock markets, most of the time the average stock market return was higher or lower. So, returns can be positive even when the market is volatile but the average stock market return will not rise every year. Sometimes it will be lower sometimes higher.

    What is the average stock market return? 

    The average stock market return actually is about 7%. If we take into account the periods of highs, for example, the 1950s the returns were up to 16%. But we had the negative returns of 3% in the 2000s.

    For example, from 1998 to 2018, we had an average stock market return of 6.88%. The lower return came from the enormous loss in the market in 2008. 

    But, over the last 50 years, the average stock market return was 10.09%.

    The stats may help here, the Dow Jones – by May 25, 2018, the average annual return was 5.42%. On January 6, 2012, a 25-year period ended with an average return of 7.55% per year. But if we look at data from the beginning of 20 century, the average stock market return was around 4.3% respectively.

    On the other hand, the S&P 500 index had average returns from 1957 through the end of 2018 about 7.96%. But, the average annual return from its inception in 1926 through the end of 2018 was about 10%. Last year, 2019 was great with a return of 30.43%. If we include dividend reinvestment, the S&P 500 return was 33.07%.

    How to calculate the average return on stocks?

    The average return on your stocks’ portfolio should reveal to you how well your investments have run in a particular period. This can also help you to predict future returns. Remember, this measure isn’t the annual compound growth rate.

    So, to calculate the average return on stocks you will need to calculate the return for each period. The next step is to add returns together and divide the result by the number of periods. That’s how you will get the average stock return.

    Calculate the average rate of return

    Firstly, what is the average rate of return?
    It is the percentage rate of return that is expected on an investment but compared to the initial cost. 

    The formula is quite simple. Divide the average annual net earnings after taxes or return on the investment to get the average annual net earnings and then display in percentage.

    The average rate of return formula = (Average Annual Net Earnings – Taxes) / Initial investment x 100%

    Here is the explanation of what we did:

    Firstly, determine the earnings from stock for a particular period, let’s say 10 years. Now, you have to calculate the average annual return. Do that by dividing the total earnings after 10 years by the number of years.

    Further, if you have a one-time investment, find the initial investment in the stock. If you want to calculate for regular stock investments, take the average investment over life.

    And finally, divide the average annual return by initial investment in the stock. 

    Also, you can do all of this and get the same result if you divide the average annual return by average investment in the stock but expressed in percentage.

    Let’s take the example of a stock that is likely to generate returns of 10% per year after taxes and for a period of 3 years.

    The initial investment       $10.000
    First-year’s net earnings   $1.000
    Second-year net earning  $2.100
    Third-year net earnings    $3.310

    Use formula

    The average rate of return formula = (Average Annual Net Earnings – Taxes) / Initial investment x 100%

    After 3 years your initial investment will be increased by 64% or you will have $6.420 more in your account.

    What does this mean for investors?

    As always, computing dividends is important and you have to account for them. If you reinvested received dividends, even better. That’s compounding on compounding!

    The truth be told, those who have stayed invested in stocks have largely been rewarded.

    The understanding of the concept of the average rate of return is important because investors make decisions based on the possible amount of return expected from an investment. Based on the average rate of return, you can decide will you enter into an investment or not. Moreover, the return is used for ranking the stocks and ultimately you will choose per the ranking and include them in the portfolio.

    In a few words, the higher the return, the better is the stock.

    But let’s examine one different case of the average stock market return. 

    Let’s say your initial investment is also $10.000 but (this isn’t easy to say) in the first year you lost 20% of the initial investment. That’s bad news. But in the second year, you gained 20% of the initial investment. Oh, how nice it is!

    Yes, nice but your gain is zero.

    (-20+20) = 0

    What do you think? Do you still have your $10.000? Things never move in that way.

    Here is why.

    When you lose 20% of your initial investment you ended up with $8.000. Right? That amount became the amount of your investment. On that amount, you gained 20% or $1.600. So, after two years you have $9.600 in your hands and you are short for $400 compared to your initial investment of $10.000. You lose money and your return isn’t zero. Your return is minus and you will need more gains in bigger percentages to cover that loss.

    The stock market average return isn’t misleading. That is how you have to calculate it.

    Or to calculate CAGR.

    Bottom line

    This means that investors MUST have a financial plan and investing strategy.
    There are no guarantees for big gains in the stock market and never were. The average return of 7% or 10%  is great if you are a long-term investor. It is reasonable to expect a good return on the current stock markets if you reduce your enthusiasm when the good times come.
    That’s nice, you’re making money. But, when stocks are jumping, remember that not so good time may come. Especially keep this in your mind over the bull market cycle.
    You can get the average return only if you buy and hold but not if you trade frequently. Even a few percent per year can produce nice gain over the years.

  • Tellurian Inc – Large Reward But With High Risk

    Tellurian Inc – Large Reward But With High Risk

    Tellurian Inc - Large Reward But With High RiskEven without a product and with big risk, this stock could generate a large reward.
    By Guy Avtalyon

    Tellurian Inc trades on the NASDAQ under the ticker symbol TELL.
    The large rewards always come with risks. So, if you want to make a big profit be prepared to take a big risk. But a smart investor can assume where the potential traps may occur.

    Tellurian stock is such potential. 

    This is the natural gas company but without the product yet. Instead, it has plans to make the Driftwood export terminal and Driftwood pipelines. Tellurian, a natural gas company based in Texas, owns and manages the LNG processing and export facility through its wholly-owned subsidiary Driftwood Holdings.

    The U.S. Federal Energy Regulatory Commission issued the final environmental impact statement for the LNG project in January and granted authorization to build and operate the LNG facility along with the pipeline in April this year. Tellurian Inc. is building the terminal that will be able to export up to 27 million, 600.000 tonnes of LNG per year to customers.

    This project is still in the early stages of development, but it’s where investors see the final achievement of Tellurian’s potential. For example, India’s Petronet signed a memorandum of understanding with the LNG and took a stake in the project. Its expectation is to get five million metric tons of LNG per year.

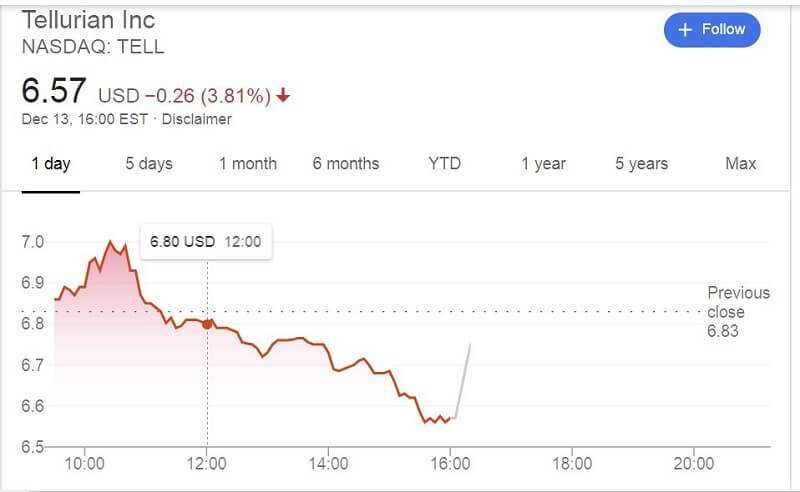
    On December 13, the stock traded at $6.57.

    Tellurian Inc - Large Reward But With High Risk

    The analysts’ forecasts range from $6.00 to $20.00 with average expectations for Tellurian’s share price to reach $12.33 in the next twelve months. This implies the potential for the stock price to increase by 87.7% from the current price which is $6.56 today, December 16. 

    Tellurian Inc stock is likely a very good long-term investment. 

    Based on analysts’ estimates investors may expect an increase up to $11 over the next 5 years and also, the revenue to be about 70%. If you invest $10.000 today, your investment will be over $17.000 worth at that time.

    Where is the risk with Tellurian Inc stock?

    Investing in the company without the product is a big risk. Tellurian isn’t an exception. There is a risk but this company can easily be one of the few where the risk pays off.

    Tellurian Inc (NASDAQ: TELL) published its quarterly earnings results on Wednesday, November, 6th. The company reported $0.18 earnings per share for the quarter, while analysts’ consensus estimates were $0.13 by $0.05. Tellurian Inc reported revenue of $9.34 million, while analysts expected $13.60 million. Also, the company had a negative return on equity of 57.16% and a negative net margin of 677.62%.

    Why buy this stock? 

    The 50-day moving average for the TELL stock price trend is bearish. Currently, the stock price is decreasing from 50 SMA. 

    The company showed a return of 10.50% from the beginning of this year. The stock dropped for the last three days after a significant increase. 

    As we said, there is a lot of drawbacks with this stock but at the same time a lot of possibilities. Risk provides a profit. Maybe you just have to leave the comfort zone. But be careful and trade smart.


    You can test as long as you want. The app is easy to use and all data is accurate. You just have to enter your exit strategy (stop-loss and take-profit levels) and the app will show you how it was executed in the last 7 days, 3 months, and one year. The ability to check your exit strategy will help you to significantly decrease the risk and make a profit.

    That’s the end of every good trade!


  • The Dilemmas About Aramco Investing Are Showing Up

    The Dilemmas About Aramco Investing Are Showing Up

    The Dilemmas About Aramco Investing Are Showing UpInvestors’ demand drove Saudi Aramco market value to $2 trillion on the first 2 days of trade in Riyadh

    But the dilemmas about Aramco investing rose. Yes, Saudi Aramco (SE:2222) reached the $2 trillion target. Saudi leader Crown Prince Mohammed bin Salman had a wish, and it became a truth on Thursday, December 12. Aramco shares have been rising for the second day to make Saudi Prince happy. Finally, this guy has a chance to show how big visionary he is. 

    Aramco’s initial public offering (IPO) is the cornerstone of his vision to provide Saudi’s economy the independence from oil. The money ($25.6 billion) collected by selling the shares of Aramco will be used for developing some other fields of the national economy. That is how the plan was presented in public. So far, so good.
    This is a tremendous opportunity for the Kingdom. Oil has long been the main export product for Saudi Arabia and Aramco is the biggest oil company in the world.

    The end of the fairy tale?

    The bubble around Aramco shares grows. Even before its IPO. It was represented as a great investment, a great opportunity for investors all over the world. But just be careful. If some sharks are buying those shares it doesn’t mean that everyone should do the same. Maybe Saudis have to do that but you don’t. Saudi Aramco is a state-owned company and some Saudis, according to media reports, are taking loans to buy the shares.

    Saudi Aramco’s IPO gives opportunities for Saudi citizens. Now, they can have a part of this Kingdom’s crown jewel. And everyone is excited, full of optimism and enthusiasm. But, where is the limit of it?

    Must be somewhere. 

    The share price is high in December, as we can see and it seems it will rise more. But what if the stock is overvalued? What if it is a bubble? It will explode and the prices will eventually fall.

    Don’t miss: Trading With Success – A FULL guide for beginners

    Why the dilemmas about Aramco investing arise?

    For several reasons.

    Saudi Aramco has become the most valuable listed company in history. This oil producer gained a market value of $1.9tn on its first day of trade.
    Shares were climbing almost $200bn above the $1.7tn valuation established before its market appearance on Riyadh’s stock exchange.
    This the biggest “provider” of the climate crisis had been valued at more than Apple and Facebook together. Also, double more than Amazon and Alphabet. 

    On the second trading day, it hit the $2 trillion target.

    But investors should be worried because of the company’s relationship with a state. And it isn’t SOME state. Saudi Arabia is well known as related to human rights abuses and with some dark things too. Have you ever asked yourselves why the main support for the company comes from the Saudis and the Middle East?
    But the main concern comes from investment index providers such as S&P Dow Jones, MSCI, or FTSE.
    They all said they will include Aramco shares into their indices. What are the consequences? Well, the investors from all around the world, pension funds and other funds will be forced to buy these Aramco shares.
    The dilemmas about Aramco investing came directly from the state of Saudi Arabia. 

    Saudi officials said that the government will sell more shares after the IPO. If the Saudi government does so, it will overwhelm the market with additional shares. And the bubble burst is coming! 

    The sale of more shares by the government could easily cause the price of Aramco shares to decrease notably. 


    Bottom line

    We don’t want to say that you should or shouldn’t invest in Saudi Aramco. We just want to say that you should avoid Aramco-mania. Stock investing is risky. In the markets, nothing goes up permanently. So, keep this in mind. And invest smartly and carefully.

  • Vanguard Health Care Index Fund ETF Shares (VHT)

    Vanguard Health Care Index Fund ETF Shares (VHT)

    Vanguard Health Care Index Fund ETF
    Healthcare ETF is good for investors with less risk tolerance
    Vanguard Health Care Index Fund ETF is one of the largest in the stock market

    Vanguard Health Care Index Fund ETF is focused on stocks in the U.S. health care sector. It is managed by Vanguard and is covering health care stocks in the U.S. stock market. It is a big fund that holds shares of 388 companies. The Fund owns shares of Pfizer Inc, Merck & Co, AbbVie Inc., Johnson & Johnson, UnitedHealth Group Inc., and Abbott Labs. Its 10 top holdings account for almost 45% of the portfolio. But the fund has an extremely good diversified portfolio. It has holdings in pharmaceuticals, biotechnology, health care equipment, health care, supplies, facilities, services, technology, distributors, and life sciences tools and services.

    Healthcare stocks are hot

    Everyone needs health care and everywhere. But the main source comes from boomers. We have nothing against them, but the truth is that as people are aging, they need more health care. Correlated with this is the increased demand for medical products. But this isn’t the whole truth. 

    Also, there is great progress in new technologies that are likely to create great growth for companies in this industry. 

    For example, pharmaceuticals. You can see drugmakers that are developing new procedures, new methods, and drugs. Today we have personalized therapy, based on personal genetic data for each patient individually. This is especially important for cancer treatment, for example.

    Today, biotechs and pharmaceutical companies are practicing gene editing as the treatment for rare genetic diseases.

    The healthcare field is huge and connected. For instance, for early diagnosis of cancer, the liquid biopsy is very popular today and accurate. But someone had to develop it. The same is with AIs and robotics, medical device companies are developing new types of high-tech equipment. So many companies are involved to improve healthcare services. Look at the telehealth, it is adopted broadly. We have robots as surgeons. Monitoring patients with chronic diseases out of hospitals is easier than ever.  

    These products are not aimed at older populations only. Also, we have great progress in aesthetics, skincare, body care, hygiene, etc. 

    Can you see now why healthcare is a hot zone of interest for investors?

    Vanguard Health Care Index Fund ETF Shares 

    Vanguard discovered the ETFs. 

    It tracks the performance of the MSCI U.S. Investable Market Index (IMI)/Health Care 25/50.  

    This ETF has delivered an average annual return of 9.47% since it started in 2004. It has generated average annual returns of 9.78% over the last three years and 9.2% over the last five years.

    The Fund’s dividend yield is of 2,1%, the expense ratio 0.10% which is one of the lowest among ETFs.

    Vanguard Health Care Index Fund ETF

    Vanguard Health Care gives wide exposure. VHT stock is cheap to hold. Its liquidity is strong. The problem is the same as with other Vanguard funds. It is restricted transparency since the holdings are published monthly with 2 weeks delay.

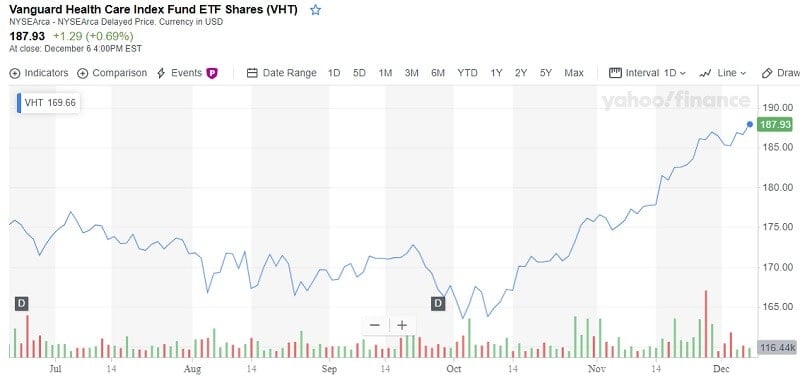
    Still, for the long- term investors a reduction of transparency shouldn’t so much important. VHT fell by -0.13% on Thursday, December 5, but rose for 0,69% on Friday, December 6. The current price is $187.93, $1.29 more than the previous one. Daily fluctuation of stock was 0.79%, a day high was $188.50, a day low was $187.02.

    During the last 2 weeks, the stock price was shifting up and down but still, the 2-weeks gain was 2.78%.
    Since the volume has increased by 47 673 shares on falling prices, you should take this as an early sign of increasing risk in the next several days. Anyway, the price is dropping so it is time to buy it.

    According to analysts, the stock is in the upper line of a rising trend in the short term. This can be a very good selling chance for the short-term traders because the move towards the lower band of the trend can be expected.
    If the price breaks up the top trend line at $188.45 it is expected to increase by 11.09% in the next 3 months with a price between $195 and $210 at the end of this period.

    Bottom line

    Investing in a healthcare ETF decreases the risks for investors thanks to a diversified portfolio across various stocks.
    Moreover, ETFs can modify their holdings when it is necessary. Also, healthcare ETFs can resist during economic downturns because we will all need medical care no matter if it a crisis or not. But keep in mind, ETFs can drop during the crisis or recession too. They are not immune. But as the lesson from 2008, when some ETFs dropped by two-digit percentages, they had been rising again and did it fast.
    For trading stocks use our FREE Trading Exit Strategy, to calculate and optimize the numberless exit strategies, an app that you have for the first time in history.

    Featured image credit: *Total Shape*

  • Biotech Stocks Are A Good Investment

    Biotech Stocks Are A Good Investment

    Biotech Stocks Are A Good Investment
    The biotech companies have strong earnings growth
    The Nasdaq Biotech Index (NBI) has slightly outpaced the S&P 500 over the past 12 months.

    Biotech stocks are the most impressive, exciting and, at the same time, one of the trickiest assets of the stock market. Biotech firms use technological methods based on science to produce products. The majority of biotech companies are focused on clinical research and the development of new medicines. 

    But the whole industry has a lot of different purposes, the drugs are just a part of that. You can find biotech stocks on genetic experimentation, food modifications, health care, almost everywhere. One thing is common for every single producer: they have to go through a harsh, expensive and intensive experimental process before getting approval for the market.

    The biotech companies have strong earnings growth 

     Discovering the best biotech firms to invest in can be difficult. Laboratory ideas don’t always come to success and frequently biotech stocks are subject to strict regulations and rules.

    What you have to keep in mind is earnings growth. Biotech stocks are giving exactly that. If you are looking for great rewards, the biotech stocks are for you. One thing is important to be noticed here: these stocks carry a big risk too.

    Biotech stocks have great potential

    Well, there is an explanation of why that is. Every company needs time to develop its business, operations, presence in the market. Biotech companies frequently depend on the success of several trials of their products. During that phase, its stock isn’t expensive. Contrary, it can be very cheap. When the company gets approval for a drug or some positive news about testing comes, the stock price can skyrocket. Refusals or bans, though, can cause a disaster. So, for normal investors, it can be difficult to gauge how the testing of some drugs or anything from the field of the biotech industry will end. Well, here is one suggestion. Stay tuned on what the analysts who are well informed in the biotech industry are saying. If you see a stock that is frequently surrounded by bulls, it is a sign that something worth is nearby. 

    Recognize your biotech stock better than anyone

    We will show one example of how to do so.

    Axsome Therapeutics is developing new drugs for the treatment of CNS disorders. Yes, it is clinical-testing stage and biotech stocks can be uncertain for investors. But this stock is remarkably fit for any investor with an aggressive approach to investment.

    AXSM stock has increased over 1.200% in this year. The investors are excited about the upcoming clinical study results. Axsome Therapeutics is in a late-stage study for its AXS-05. It is innovative and important in treating a depressive disorder, so-called MDD. The company is expecting results from another study, a drug for treating treatment-resistant depression, by the end of the first quarter in 2020. Also, the company expects positive results from a study of AXS-05 for Alzheimer’s disease in the first six months of 2020. And stock market analysts are predicting a huge revenue for the company and the shareholders. So, the hint that some biotech stock is a good investment is coming from the news.

    How to pick the best biotech stocks

    Over the past year, the Nasdaq Biotech Index (NBI) has kept up with the market.
    This year has been a hard ride for everyone. But the biotech sector, with its large firms, is definitely catching its pace. The index is rising. We were witnesses of interesting mergers during the past several years that starting to be profitable. Some new technologies are starting to gain excellent results which boosts hope for many patients. The cost of their tests is enormous, it is around $2 billion approximately. Also, it takes almost 10 years until some drug gets permission for distribution and human usage.
    It sounds like a lot of responsibility. Moreover, producers need to form a strong base for future growth.

    If you are focused on biotech stocks you should find biotech companies that are driving cutting-edge therapies. The brands that are well-positioned provide big premiums.

    Traders-Paradise recently wrote about one of them, but stay tuned, there will be more.

Traders-Paradise