
5 min read
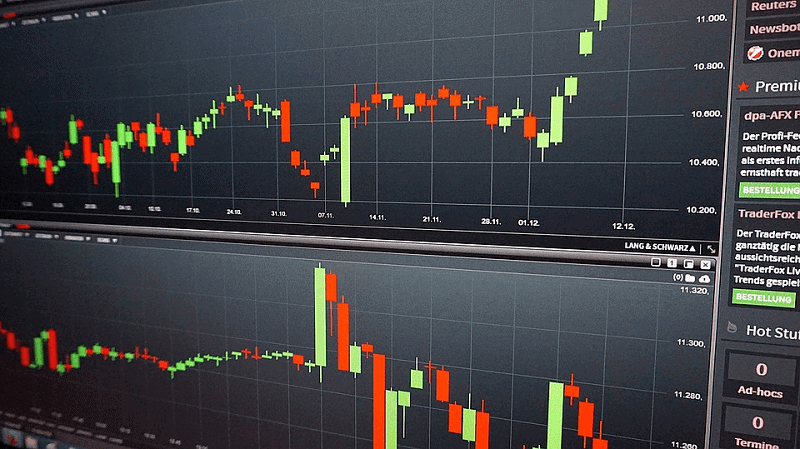
Stock trading software is a program that allows you to research potential stocks, view charts, read analyses, set up watchlists, and more.
With today’s volatile market trends, picking the right stock trading software is crucial. Honestly, there are very few stocks worth trading each day. That means you have to identify them before they make their big move. And, that separates the profitable traders and the rest. Before you enter, you have to check the trading software reviews first.
Much of the stock market uses extremely sophisticated computer programs to analyze data at unbelievable speeds.
Unfortunately, the majority don’t have access to those applications. But still, we can take advantages of technology.
The better stock trading software you use, the better trader you are.
They are easy to use, comfortable, intuitive, feature-rich, and full of useful information.
Trading software is a set of computer programs that facilitate trading in financial instruments such as stocks and currencies. It also helps develop stock-picking decisions through fundamental and technical analysis features. Some software also allows transaction processing.
Brokerages offer the trading software either for free or for discounted pricing. Sometimes they offer software as a stimulus to obtain a particular amount of trading volumes. Independent vendors also supply software to assist traders.
Importance of accurate stock market data
A stock market is a place where you may trade shares of publicly listed companies. Investors in the stock market want to gain their returns by buying and selling their investments at a fitting time.
Stock market data is highly time variant and follow a non-linear pattern.
Analyzing stock market data is very important for divining the future prices of the stock. Therefore accurate stock market data entry is important for traders, investors, and market analysts. Accurate stock market data provides them to keep abreast of market trends. Stock market companies employ data entry services to maintain all types of stock market records.
The main part of the stock market is the price of shares. But it varies very often. The price of shares is reported every minute because of people who are buying and selling shares. Any error in the entry of data can cause tremendous losses to companies and individual traders and investors.
Entering the data is a very important factor in the stock market. That financial data has to be entered perfectly. Inaccurate data can create market volatility that can cause the disorder.
Stock splits, mergers and spin-offs are common activities that take place every year.
Stock splits occur when the price and volume of shares change when two companies merge. In that situation, one of the shares stops be traded and their value gets added. When there is the spin-off, a company may separate and also, there will be a change in the price of shares. In such circumstances, the stock data must be updated to reduce market volatility.
Historical data about stock markets is also fundamental for long term investors. It is helpful for them to understand the type of shares and its price variations.
Accurate data entry is necessary for stock markets. If traders have reliable data they can identify the right time to buy and sell shares and earn the profit.
What to look for in trading software components
-
Analytical methods and strategies
If you want to be an active trader, which is different from the long-term buy-and-hold, you must have the opportunity to use several strategies, including day trading and swing trading.
In day trading, the position is closed out within the same day.
Swing trading involves holding a security for one to several days in an attempt to profit on the swings or price changes.
Good trading software must offers traders the ability to control and manage open positions. Some of the order types are a market order or pending order. A pending order can be a buy limit, buy stop, sell limit or sell stop. A trader should have the opportunity to attach a stop loss or take profit order to a pending order, for example.
-
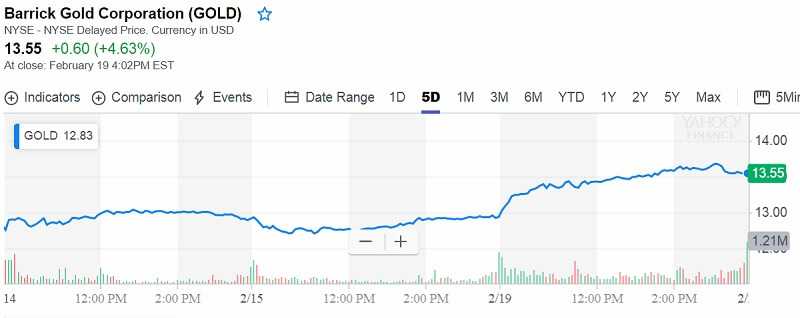
Historical and real-time data
Real-time data is an indication and information promptly provided. OK, there can be a short delay because of the time of distribution of information. Many websites promise free real-time quotes, but they are regularly delayed by up to 20 minutes.
Real-time data is important for traders. Even a small variation between the quote and the actual price of the security may lead to the reducing of profits or a loss.
Historical quotes are also important. Because the price of assets moves in known patterns and trends which tend to return over time
-
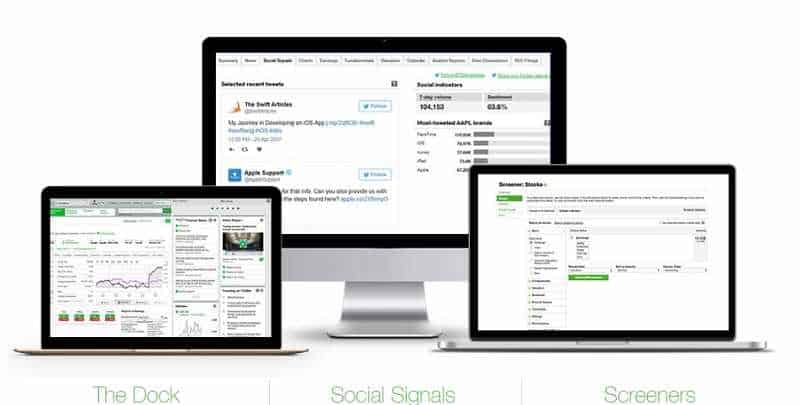
Stock screener
Stock screeners are tools which can separate stocks based on criteria defined by the trader.
Every good software must have a screener.
-
Backtesting software
You must have the opportunity to test an opened trading strategy using historical data. Backtesting assists as a method for testing the effectiveness of the strategy. It simulates the trading strategy across a particular time frame and then analyzes the results from the perspective of return and risk.
-
Live news
The market is volatile and it moves on a multitude of developments, including economics, geopolitics, and corporate news. We know that stocks are highly volatile.
If a trader wants to make a profit such has to react immediately to market news thanks to a live news reference.
-
Portfolio tracking
This will help you keep a close track of all previous trades, helping you to identify mistakes and hone your strategy.
How to correctly use stock trading software
The new stock trading software programs can look scaring to the beginner, we know that. But, don’t be. The better choice is to engage yourself and get used to its features.
The charts are the most important hallmarks for the best stock trading software programs out there. Because you need charts that are easy to read, customizable, and trackable.
The top stock trading software platforms offer paper trading, which we always highly recommend. Do your paper trading like a stock simulation program. You execute trades, buy, sell, and short, without placing money. If you are new on this field and you’ve never traded before, this is a great way to enter.
When you’re familiar with paper trading, you should move on to the real account. Otherwise, you will never get a profit from the stock market.
The whole truth is that everyone uses stock trading software in a different way. Maybe you will reveal a new strategy to pick data from software programs.
Trading software providers tout their platforms’ endless features. Some are really good but some are trash. Here’s a kind of guide that can help you make smart investment decisions.
Analyze
Scanner: Scanning tools continually comb the stock market for trading possibilities. You can personalize your scanning tool to explore specific models and get a signal when they are found.
Charts: Customizable charts will help you to analyze the markets. Choose several indicators to compare new or historical data. You have to know changes in the market to recognize stock patterns.
Monitor
Streaming data: Permanent access to data gives you the information and you are able to make smart decisions about your investments. Software platforms provide access to data about stock prices, companies’ worth, quarterly reports, etc.
News: Better trading platforms can provide up-to-date news from third-party sources to keep you on course.
Research reports: Trading software gives you access to related industry studies from third parties about particular stocks or analysis of more extensive market issues.
Trade
Simulation: Yes, paper trading or simulators give you a chance to practice without real money.
Automated trading: A tool that buys and sells securities automatically based on pre-programmed criteria. It is used frequently by advanced investors who make various trades each day.
Customer service: Online trading platforms are a “do-it-yourself” mind. But most major software providers have some type of customer service, whether it’s 24/7 assistance, live-chat capabilities or a chance to speak with an advisor.
Online platforms are generally much cheaper than full-service brokers. Still, think carefully about what you spend on trading software.
It isn’t hard to find providers that give traders the option to test the stock trading software before signing up to pay for the service. Some also offer commission-free trades and cash bonuses.
Top Stock Trading Software – The Opinion of Traders Paradise
E-TRADE
Choose between E-Trade 360 for casual investors, or E-Trade Pro for active investors. A mobile version is also available for on-the-go trading.
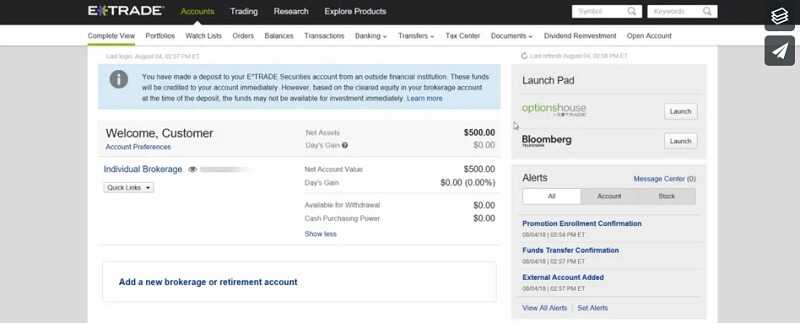
E-trade stock trading software
It isn’t just a stock trading platform. It ranks among some of favorite stock trading brokerages for a number of reasons.
Namely, its access to real-time data, research, and analysis in its brokerage platform. Nothing is powerful as historical and real-time data that enables you to act on the best stock trades possible. E-Trade also offers a collection of educational sources: webinars, blog posts, and news.
It isn’t among the cheapest, but it’s commissions aren’t the steepest either. You can start your stocks trade at $6.95 with volume discount available, options start at $0.50 per contract. And, moreover, the brokerage even offers hundreds of commission-free ETFs.
Anyway, it is best for experienced traders.
-
TD Ameritrade
TD Ameritrade stock trading software is well suited for investors of all skill levels. Traders will appreciate the wide range of tools and screeners, and its platform for practicing simulated trades is one of the best.
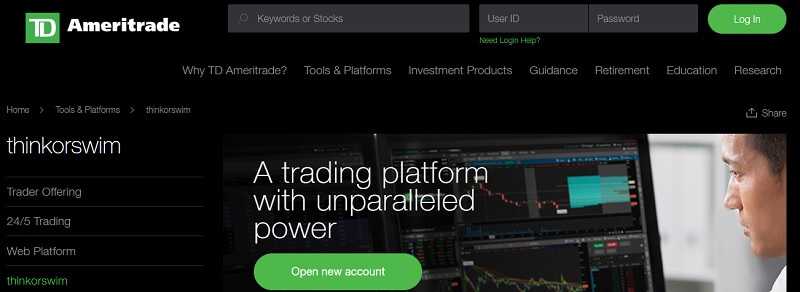
TD Ameritrade stock trading software
TD Ameritrade has some of the most extensive tools we tested. And, very important, it continues to add to its toolbox.
There is the brokerage’s chatbot to execute trades and access market news on Twitter or on Facebook Messenger to perform a range of functions. It is from looking up stock quotes to placing trades and chatting with a live agent.
TD Ameritrade’s powerful trading platform, Thinkorswim, is customized for novice and advanced traders. The control center screen delivers all important information together in one place. So, you can create alerts, access research from over 400 technical studies, search for stocks and interact with real traders.
It’s also the go-to destination for practicing simulated trades with paper money.
Educational offers combine videos, webcasts, and tutorials, for both novice traders and experienced investors. Its broker-assisted trade fee is a high $44.99, but its other hallmarks can make it worthy of the high cost.
TD Ameritrade is best for simulated trades in Traders Paradise’s opinion.
-
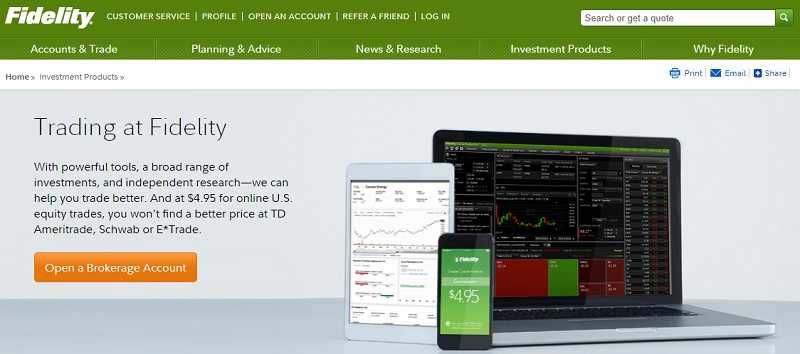
Fidelity
This trading service combines a wide range of investment choices. Along with advanced analytical research from some 20 providers, including Argus.
Argus Research is one of the newest options for research providers to Fidelity.
The main plus, Fidelity has low pricing.
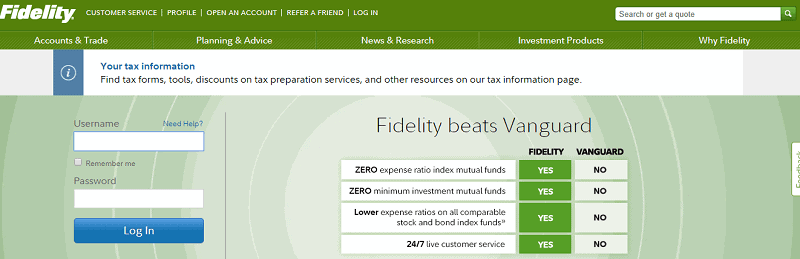
Fidelity stock trading software
You can choose from over 10,000 mutual funds and 93 commission-free exchange-traded funds (ETFs). The brokerage permanently enhances its platform. So, here you can find two new screeners: one that enables you to tailor your screen with up to 140 criteria for stocks, and an ETF research tool and screener.
Also, new is Trade Armor, a tool that lets you to visually search profit and loss scenarios. All that by using charts, news, alerts, and research for potential or existing stock positions.
Fidelity’s Learning Center offers a full table of issues classified by skill level.
There is no minimum to open a brokerage account to buy stocks or shares in an ETF, but most mutual funds require an initial $2,500 investment.
The mobile app features all the tools to manage your accounts. Also, you can inspect your balances, account positions and watch lists. Moreover, you can search for information and real-time quotes for trades.
The bottom line
When you start to evaluate how easy a stock trading software is to use, you should consider several questions.
Is it easy to make watchlists? Could you set up alerts? Can you customize them? What kinds of screening tools are available?
Are the charting tools work well? What technical indicators can you use?
One of the most important things is a fast and efficiently accessible order process. Markets change instantly and being able to execute the order in a short time is an important part of your investments.

 If you understand the terms overvalued and undervalued you will find plenty of stocks that look cheap


 Position trades requires just a half of hour work per day, but profits can be great.
 Instead of buying cryptos, you can invest in it, you just have to choose will you do it directly or indirectly. Traders-Paradise explains how to invest in cryptocurrency stocks.


 Shorting a stock looks very simple. But, this isn’t a strategy for beginners.