Year: 2019

  • October Effect – Investing When The Stock Market Go Lower

    October Effect – Investing When The Stock Market Go Lower

    October Effect - Investing When The Stock Market Go Lower
    Is October effect just a myth or there is something?

    By Guy Avtalyon

    The October effect is a recognized market oddity when stocks tend to fail during October. The October effect is an irrational suspicion of some investors related to previous market crashes that happened during October. Investors become superstitious, you might think. Well, the fact is that some great historical market crashes happened this month.

    We will point some of them. In 1907, the Panic, later, in 1929, were three large crashes – Black Tuesday, Black Thursday and  Black Monday, after almost 60 years 1987, Black Monday happened October 19, when the Dow fell 22.6% in one day. Also, on Oct. 9, 2002, the market caught a five-year low. And the market plummeted 16% in October of 2008 when the Great Recession began.


    When the stock market crashed in 1929, the investors were surprised. It was quite unusual because only a few weeks before the stock market was on the highest level ever, the stock prices were 25% higher than in the year before. In October 1929 stocks dropped nearly 25% for only two days. It cost investors billions of dollars. This market crash led to the Great Depression. October has accepted as a permanent warning to investors of how suddenly wealth can turn over.

    What is October Effect?

    There’s no proof that this great market crashes occurred in October for any other cause. Coincidence is truly a master of the game. Since there were not too many market crashes in October, we are free to say that investors will make money during October more often than they will lose.

    According to research conducted by Yardeni Research, the medium monthly return in October 2015, was 0.4%. 

    It wasn’t a great return but still, it was. But can we say the chain of unfortunate market events over October is broken?

    The truth is that if markets go down over October, they do it very hard and painful. But just for a sec try to be reasonable. Compare the drop of 4.7% in one month with 11 good months when the average gain was about 4.1%. Everything is math.


    So, we can say, at least, that October could turn high in any direction.

    For investors, September is statistically the worst month since they lose approx 1% during this month. History shows that September can be difficult for stocks. Since 1950, it has been the most critical month for the S&P 500, with declined at an average of 0.5%. But, for the last 10 years, the S&P 500 has a 0.9% profit in September.

    Is it possible to predict the stock market?

    It is hard to predict the stock market. Markets are going up and down. You can be sure of one thing: when it is down, it will climb up. The markets go up over time and you are a long-term investor you shouldn’t be worried about the market’s condition over one month. But if you are a short-term investor your portfolio should be built mostly on cash and bonds, less on stocks. That means it is better to be a conservative investor. So, the October effect will have no or less influence on your investments.

    Investors’ sentiments can become negative when October is near. That may influence the stock market play. As investors’ feelings incline to the depressed, negative market growth can produce overreactions. They will start to sell stocks in panic and the negative influence will increase more. 

    Keep in your mind, statistically October isn’t the worst month, it is September. But due to the great market crashes that occurred over October, we have that scary phrase – October Effect.

    By the way, do you know which month is the best for the stock market? July! Remember this.
    It would be amazing if the market crashes chose to happen just in one particular month of the year. Honestly, it is impossible, like the impossible is to have just one incredible good market month.

    October is just one of the 12 months of the year. The difference from others is that leaves start to fall. That is the October effect.

  • Secrets of Stocks Scalping Strategy

    Secrets of Stocks Scalping Strategy

    3 min read

    Secrets of Stocks Scalping Strategy

    Scalp trading requires incredible self-control and trading focus. Traders are interested in scalp trading because it has less risk, they can place hundreds of trades per day and it provides much more trading opportunities.

    Traders-Paradise reveals some secrets of the stocks scalping strategy. First of all, let’s make clear how to scalp trade.

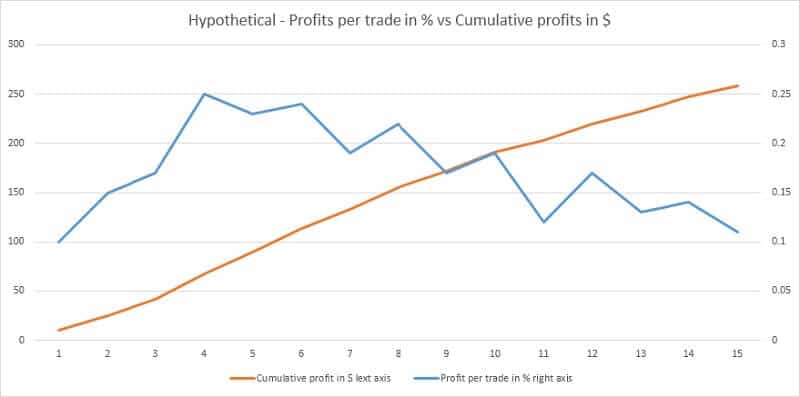
    If you want to practice scalp trading you will find several different ways to make money. One way is to set a profit target per trade related to the price of the security in the range between .%1 – .25%. The other way is to follow stocks breaking out, the new highs or lows and using Level II to take as much profit as possible. You will need a lot of concentration and perfect order execution for this. Finally, the third way is to watch the news and trade upon the events that can cause extended volatility periods of a stock. 

    It isn’t necessary, but we want to explain the Level II.

    Level II is the order book for Nasdaq stocks. Level II shows a ranked list of the best bid and ask prices with detailed data about the price action. It is very important in day trading to know who is interested in the stock.

    Winning is crucial in scalping. Your win/loss ratio must be high as the difference from the other strategies where the win/loss ratio may be less than 50%. This high level of winning trades shows that you have to be right much more often than wrong while scalping. 

    That is why the stock scalping strategy is a challenging way of making money in the market.

    So, we have covered the basics. Let’s go further. 

    Secrets of stocks scalping strategy – use the oscillator

    The idea behind scalping is that stocks can be more predictable covering extremely short periods. More than they can be over a longer time. For example, you can easily predict the course of stock in the next 20 minutes. Honestly, it is harder to predict where the stock will be in the next 20 weeks. At first glance, scalpers are sacrificing longer gains. Yes, that is probably true but they will not have longer-term losses if they are trading wrong. 


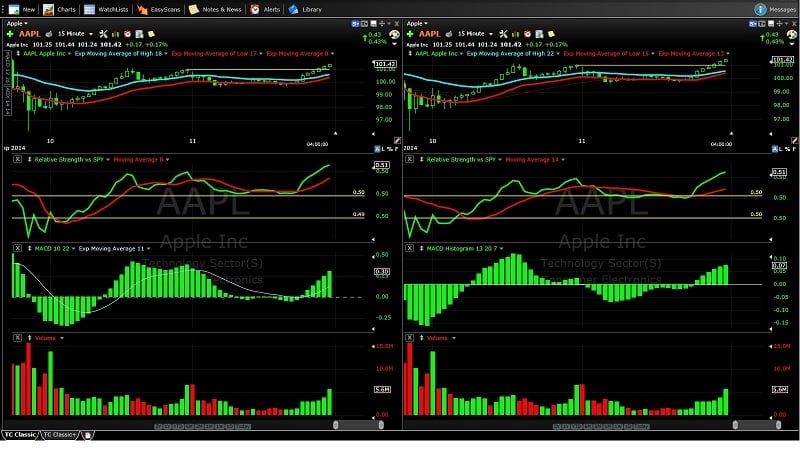
    One of the most successful ways to scalp the market is by using an oscillator but also, it is one of the toughest to nail down.

    Oscillators can give you the wrong signals. If you are using one oscillator the possibility to predict the stock action is about 50%, which isn’t enough for this strategy.

    The commission costs are too high for that win/loss ratio. 

    Also, scalp trading is possible with the slow stochastic oscillator. But the stochastic oscillator is not intended to be a standalone indicator. You will need some other form of proof to confirm the signal.

    You can combine the stochastic oscillator with Bollinger bands.

    So, it is smart to enter the market when the stochastic forms a proper overbought or oversold signal but is confirmed by the Bollinger bands.

    The stochastic oscillator is a momentum indicator. It shows the position of the closing price related to its high and low prices over some period. Bollinger bands show volatility. Together, these indicators help a trader to recognize scalping opportunities.

    Successful scalping requires a great knowledge of technical analysis to notice small deviations in the stock market and quick changes. A scalper will open a position for a few seconds or minutes and then close. Scalper needs higher frequency trading because the profits make per trade are regularly low.

    Scalping also demands access to news feeds, real-time charts, and data. As a scalper, you must get breaking news or real-time data of price movements. It is an essential part of successful scalping. Lastly, scalpers can’t allow being confused. As a scalper, you will make numerous daily trades, so you must keep focus and closely monitor the market each trading day.

  • Investing In Penny Stocks Can Be A Highly Profitable Strategy For Investors

    Investing In Penny Stocks Can Be A Highly Profitable Strategy For Investors

    3 min read

    Investing In Penny Stocks Can Be A Highly Profitable Strategy For Investors

    The charm of investing in penny stocks lies in the possibility to trade at a lesser $5 and investors can buy a large number of shares at one time. The worries about recession are growing and many investors are moving into safer investments like bonds. Of course, experienced investors are not panicked, they know what to do and how to protect their investments

    But if you have a more extreme approach to market conditions today, maybe you should think about penny stocks. 

    The truth is you have to be very cautious, buying penny stocks in unsure economic circumstances may be the antagonistic approach to the market. But if your risk appetite is powerful and your risk tolerance allows you, investing in penny stocks can be a profitable strategy for you.

    The question is which penny stocks to buy?

    Traders-Paradise will give you some idea, but you have to explore the suggested companies and find the best for you.

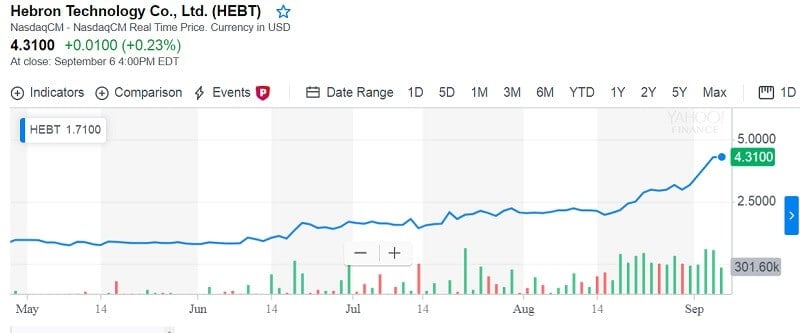
    Hebron Technology (HEBT)

    This penny stock has made great gains this year. Hebron Technology Co Ltd (HEBT) is from China. Last week, on Thursday, it earned 10% more as investors continued storing into it. HEBT stock has gained an enormous 400% in 2019.

    Hebron Technology Co., Ltd. is involved in developing, manufacturing and providing customized installation of valves and pipe parts for the clean industries such as pharmaceutical, biological, food, and beverages. The Company’s products are Diaphragm Valves, Angle Seat Valves, Sanitary Liquid-Ring Pumps, Clean-in-Place Return Pump, Sanitary Ball Valves and Sanitary Pipe Fittings.

    Investing In Penny Stocks

    Here are its Reports fiscal year 2018

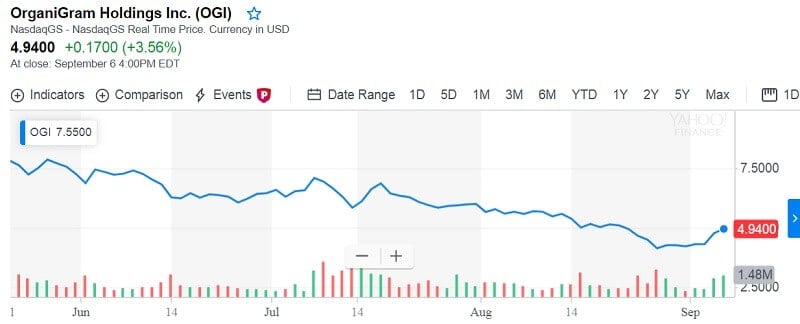
    OrganiGram Holdings (OGI)

    The second penny stock to watch this month is pot stock OrganiGram Holdings Inc. This cannabis stock performed big progress after it won a slope from a leading brokerage. Last Thursday an analyst at Oppenheimer had placed a rating of ‘perform’. And here is its annual reports.

    Can OrganiGram profit on cannabis market growth? We can recognize a good chance for the company’s future.

    OrganiGram is equipped to produce almost 90,000 kilograms of cannabis per year. The company plans to expand its production to 113,000 kilograms per year by the end of this year. That will rank OrganiGram in the top 10 Canadian cannabis producers.

    OrganiGram is one of four Canadian cannabis producers that has supply agreements with all of Canada’s regions. Also, this company is well-positioned for the cannabis derivatives market and new partnerships are coming with Pax Labs and Feather Company.

    OrganiGram’s annual report

    Trinity Biotech plc (TRIB) 

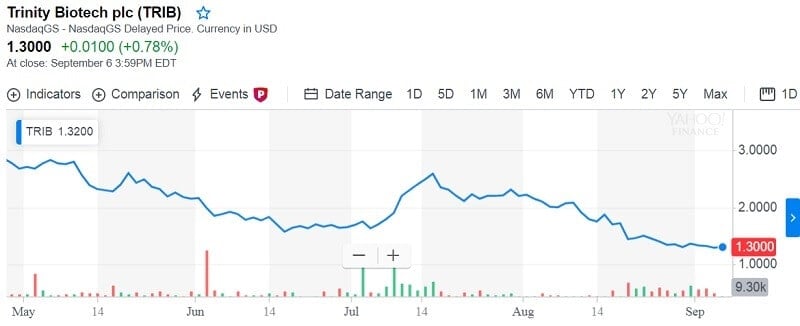
    Why Trinity Biotech plc?  Trinity Biotech is a  small company with a market capitalization of US$28m. Maybe it is unfamiliar to most investors.

    Trinity’s new HIV screening product under name Trin-Screen will be introduced to the World Health Organization at the end of the year. Trinity Biotech stock is cheap right now it is at $1.42.

    Here are its Reports fiscal year 2018

    It could be a high increase in stock value. In order to fully understand TRIB here are some data.

    Trinity Biotech was founded in 1992. Its main aim was to become a leader in the diagnostics market. Today Trinity Biotech has an awesome portfolio of over 400 products. Specializing in the development, manufacture, and marketing of diagnostic test kits, Trinity Biotech’s continued success is based on the fact that as a company it consistently achieves standards of excellence in the quality of all it does.

    Its test kits are used to detect infectious diseases, autoimmune, cardiac arrest, hemoglobin disorders, and detect and control diabetes.

    It is quoted on the NASDAQ exchange. Sells products in Europe and America, in more than 110 countries. 

    Bottom line

    A penny stock is a normal share of a small public company that is traded at a lower price. In the US, penny stocks are traded at a price less than $5, in the UK, penny stocks are the stocks that are valued under £1.

    If you want to trade penny stocks set a strong stop loss. Investing in penny stocks can be highly profitable but risky too.

    We can assume the more volatility in the markets, especially among the penny stocks, soon. So, it is possible to see a wild ride. May the force be with you!

  • Asset Allocation Models – Protect Your Investment

    Asset Allocation Models – Protect Your Investment

    Asset Allocation Models
    Here is how to protect your investment with different models of asset allocation

    By Guy Avtalyon

    Asset allocation models are the way to split your investment into different asset classes: stocks, mutual funds, bonds, private equity, etc. That will give you the possibility to lessen the risk of your investment. Every asset class carries some level of risk but different. For example, if the value of bonds rises, the stocks will fall. When the market is falling, real estate may provide you a nice return.

    The point is to have a diversified portfolio built by the asset allocation model among asset classes. Every investor has its own model of asset allocation. It is based on individual investing goals and risk tolerance.

    Also, personal asset classes can be separated into different sectors.

    You can use different types of asset allocation models.

    Asset allocation model created by your needs

    For example, for some investors equities are more favorable than other asset classes. Or if you are in serious ages you may prefer to put your money in some source of fixed income that can provide you stable retirement income because your goal is to save what you earned during your working life. Thus, you are not worried about market fluctuations. So, you may have the majority of your portfolio in stocks.
    But if you are a younger investor you may prefer some investment with faster returns.

    What are the different models

    Most asset allocation models come into four models: growth, preservation of capital, income, balanced.

    The growth asset allocation model is suitable for beginners interested in long-term investments. If you are at the beginning of your professional career you will be interested to deposit some amount every year in long-term investment such as common stocks that may not pay you dividends but can be good in the long run. Fund managers could advise you to invest in some foreign equities to diversify your portfolio.

    But if you want to preserve your capital you will like some other model of asset allocation, like preservation of capital. This model will suit you if you want to avoid risk to lose even a small part of your investment because you would like to use it in the next 12 months, for example, to buy a house. In this case, your investment portfolio will have about 80% in treasuries or commercial papers. There is some risk in this model of asset allocation due to the inflation that can lessen your buying power. Think about that.

    Income as an asset allocation model

    The usual income investor comes from a group of people near retirement because the need for cash in hand is of essential importance.

    The balanced model of asset allocation is kind of halfway between income and growth. It is a compromise between long-term growth and current income. This mixture of assets that can provide cash but also the growth of principal value.

    Balanced portfolios is built of medium-term investment and stocks of well-established companies.

    The investor’s needs may change during the time.

    The asset allocation will follow that change. For that reason, it is always smart to switch a portion of your investments before the important life changes. Do it occasionally. For example, you could move 10% of your investments to the income allocation model yearly as you are approaching retirement. So, you will have the whole of your portfolio adjusted to your new goals.


  • Limit order vs Market order – When and How to Use

    Limit order vs Market order – When and How to Use

    3 min read

    Limit order vs Market order - When and How to Use

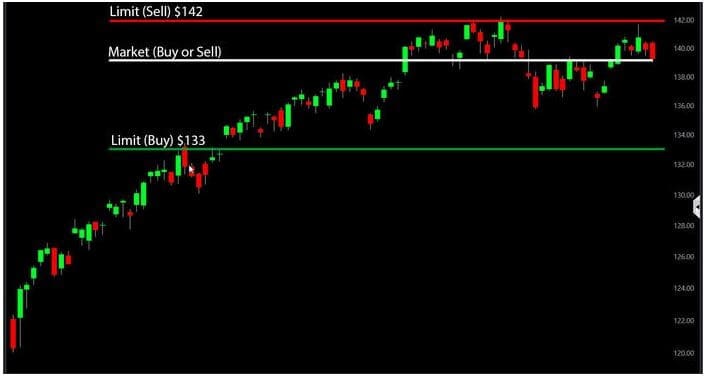
    When you are buying or selling a stock, you have two main ways to define the price you want to trade. You can choose the market order and the limit order. If you choose the market order, you trade the stock at the current price, whatever it is. By using a limit order, you can set a price and when the stock meets it you can say the trade is executed.

    This is the basic difference. But to understand more, several things must be taken into consideration.

    Limit order gives you the price you want

    The benefit of the limit order is that you can set your price. When the stock meets that price, the order will be executed. It is usual to set a limit order to be executed in a frame of 3 months after you enter the position.

    A limit order can be placed for buy or sell a stock at a particular price. A buy limit order will be filled only at the limit price or below. Hence, a sell limit order will be filled at the limit price or more expensive. For example, you want to buy the stock at $20 or less and you place a limit order for this sum. The order will be executed if the price of the stock is at $20 or below.

    The disadvantage is that you are not promised to trade the stock.

    In case the stock never hits the limit price, the trade will not be executed. 

    The other problem may arise if there is not adequate demand or supply to fill the order. That could be the case with illiquid stocks Also, the stock price may change during the 3 months and your trade may be fulfilled at a price extremely changed from what you could have made.

    For example, you want to sell some company stock at, say at $90. Those stocks are suddenly traded from $85 up to $120. But your limit order is at $90. So, what can you do? Be informed on a daily base to avoid to end up with less money when you can get more.

    The opposite can occur with a limit order to buy. You may be forced to buy at a costlier price than you think the stock is worth.

    Use a limit order when you want to name your price a much different from the current. The other reason, you aspire to trade stocks that are illiquid. Also in the case when the bid-ask spread is great or you are trading a large number of shares.

    A market order is executed quickly

    The biggest benefit of a market order is that it can be executed quickly since you are choosing the best price possible at that time. The market order will be executed no matter what price the seller is asking or the buyer is offering.

    The most important disadvantage of the market order is that you can not determine the price of the trade.  It may influence if the price changes fast which could lead you to end up trading at a much-changed price from when you placed the order.  

    For example, you placed the market order after the closing hours. Suddenly, over the weekend, the stock price increased. What you have to do is to cancel your market order before the market’s opening.

    Also, the lack of buyers or sellers able to cover your order may cause the price to increase or decrease.

    Use a market order if you want an immediate fulfilling at any price or you are trading an extremely liquid stock. Also, if you trade several shares, meaning less than 100.

    Limit order vs Market order

    Limit orders will help you to save money on commissions. But you can save your money by a buy-and-hold approach to your investment. 

    Both limit order vs market order has its drawbacks and advantages. The final selection depends on you. The limit order can be expensive. A market order is simple to execute but can be a difficult choice during volatile market circumstances.

  • How to Calculate the Loss and Profit

    How to Calculate the Loss and Profit

    2 min read

    (Updated October 2021)

    How to Calculate the Loss and Profit

    It is always useful to discover the percentage rise or drop. That is called profit and loss.
    To calculate profit and loss we have to make clear some terms involved in the calculation.

    We will use the stock as an example. 

    * Cost Price ( CP): The price at which you buy a stock is the cost price. That is the amount paid for purchasing stock.

    * Selling price (SP): The Price at which you sell a stock is the sales price. That is the amount received when a stock is sold.

    * Profit (also the gain): You get a profit when you sell a stock at a price higher than its cost price. You will like to sell your stock at a higher price. CP < SP 

    * Loss: If you sell a stock at a price lower than buying price, then you caught a loss. CP > SP 

    The percentage of profit or loss is always calculated on the cost price.

    The formula for profit is

    Profit  = SP – CP  

    The formula for loss is

    Loss =  CP – SP

    Let’s calculate the percentage of loss and the percentage profit.  Percentage Loss and Percentage Profit are calculated based on CP 

    Profit% = (Profit/CP) × 100

    Loss% = (Loss/CP) × 100

    For example, one trader purchased a share of stocks for $1.000 and then sold it or $1.250. 

    What is the profit and profit in percentages? Is it 3%, 15%, 18%, 20%, 25%? 

    OK, this is basic. 

    The words “purchasing” or “buying” are indicated as CP, cost price.

    In our case, CP is $1,000.

    The trader sold the stock at $1.250.

    The word “sell” is indicated as SP, selling price. 

    In our case, SP is $1.250.

    We can easily find the profit. It is SP – CP, so

    profit = $1.250 – $1.000 = $250

    Don’t miss this What Is APY and How to Calculate it

    Now, we have to find the profit percentage.

    The formula is

    [(profit)/CPx100]

    so

    [(250/1000)x100] = 25%

    Our trader made a 25% profit in this transaction.

    But what would happen if our trader sold the stock at $800?

    CP is $1.000

    SP is $800

    loss = CP – SP

    loss = $1000 – $800 = $200

    or

    [(200/1000)x100] = 20%

    The trader’s loss is 20%.

    Calculate the Loss and Profit in Percentages

    • Divide the amount that you have profited on the investment by the amount invested. To calculate the profit, subtract from the price for which you sold the price that you initially paid for it.
    • Now that you have your profit, divide the profit by the initial amount of the investment.
    • The last step, multiply the number you got by 100 to see the percentage difference in the investment.

    If the percentage is negative,  you have lost on your trading. If the percentage is positive, you made a profit on your trade.

    By calculating the profit or loss you are actually estimating the change. Our calculation is based on the relationship between the selling price, and cost price. The difference shows if we are making a profit from the transaction or will we have a loss.

    You would like to READ: Gordon Growth Model – Mathematics of Trading


  • Limit Orders –  Use Them to Buy or Sell Stocks

    Limit Orders – Use Them to Buy or Sell Stocks

    3 min read

    Limit Orders - Use Them to Buy or Sell Stocks

    The limit orders are a type of orders in the stock market that lets traders to sets the wanted price at which they want to buy or sell the stock. In this way, the traders have more control for the execution of price, especially during the volatility. Possibility to specify their own price by using a limit order is a better choice than a market order. By using the market order traders can only choose the price but not to define it.

    A limit order can be modified until it is completed.

    It is intentionally practiced to get a guaranteed better price. So, it has to be put on the exact side of the market.

    Buy and Sell Limit Orders

    Buy limit order must be set at a price lower than the current market price. Hence, the sell limit order has to be set at a price higher than the current market price.

    For example, you want to buy 100 stocks, but you have a limit of $30 or below. If you want to sell that stocks at $35 that will not happen until the price of $35 is reached or it is more than $35.

    A limit order means that you want to sell or buy some stocks only at the price which you put in your limit order. 

    It differs from a market order because the market order fulfills your buy or sell transaction instantly despite the price. Honestly, sometimes brokers don’t like limit orders. Your limit order will have good treatment only if the price is the best ask or bid price and your stocks will be sold very fast. But, if it is not, well, you will wait to come to the top of your broker’s list.

    Some traders believe that limit orders have some defects but the others are convinced they are their best weapon. The most important feature of limit orders is that your order will be executed only at the price you placed, or better.

    How to place a trade

    How to Buy or Sell Stocks by using Limit Order

    Chart Image Source: StreetSmart Edge®

    A limit order has five elements buy or sell as the first, number of shares, security, type of order and price.

    For instance, if you want to buy 100 shares of stock and you want to pay $35 each. Your limit buy order would be expressed as –  Buy 100 shares (ticker symbol should be added) limit $35.

    This order indicates the market that you want to buy 100 shares, but without a doubt, you will not pay more than $35 per share.

    The benefit of the limit orders is that your order will not be filled above the price you set but the price may drop and you can pay your shares at a cheaper price, lower than $35 as you placed. So, you see, the limit orders are not fixed orders.

    The same thing comes for a limit sell order. When you open a limit sell order for $35, your stock will not be traded for less than the amount you set per share. When the stock grows over the set price before your order is fulfilled, you may earn more because the stocks you want to sell reached a higher price before the transaction was executed.

    You will need the experience to recognize where to set limit orders. First, never set limit buy order too low. Why is that, you don’t have money? If you do that who will sell you the stock at that too low price? In that case, your order will never be filled. 

    The point of using limit orders is to protect yourself from buying a stock at too high or selling at a too low price. Keep in your mind, if the stock’s price never meets your limit price, your trade will not be executed.

    The limit order could be a problem if you don’t pay attention to the market. 

    Here is a strategy, not very creative, but works.

    Let’s say you placed a sell limit order at $3 over the market price. At the same time, you set a buy limit order at $3 under the market price. You will make a profit in any scenario.

    But what if the price jumps for $10 per share?

    Sadly, you missed the additional $7. Can you assume the opposite of this situation? The stock fell and your buy limit order was fulfilled as the stock was in a drop.

    Limit orders are wonderful tools, but they are not absolutely sure-fire. In a volatile market, limit orders may be painful due to the possibility to be executed too soon.

    The best way is to set a limit order that is not connected to daily price changes. The point is to have even minimum control over the price.

  • Stop-loss Order Means How Much Are You Willing to Lose On a Trade

    Stop-loss Order Means How Much Are You Willing to Lose On a Trade

    Stop-Loss orders To Limit A Risk
    Stop-loss order is an easy and powerful tool when used properly. Find how to do that.

    By Guy Avtalyon

    Stop-Loss orders are suitable when conditions in the market get a bit out of control. If you never place the stop-loss order the risk potential is huge. You may lose everything. 

    The main characteristic of a stop-loss order is that it becomes a market order. It can happen when the price of your security is selling at or under the stop price. So, a stop-loss order is a great protection against falls in the value of your stock. Stock investing is risky, but you can control it and protect it with a stop-loss order. Wise investors always use stops. The others stay with losses. The stop-loss is an easy but powerful tool that will protect you when an unexpected turn in the market occurs.

    How does Stop-loss Order work?

    For example, you hold a stock of some company and it is currently trading at $30. But your stock is volatile and you place a stop-loss order at $20. If the price of your stock drop at or below $20, your order will become a market order and you’ll be able to sell your stock instantly at the best possible price.

    If you want to be a day trader, for example, you have to place a stop-loss order on your every trade. The stop-loss order will tell you how much you can lose on a trade. So, you have to know how to calculate your stop loss. You have to determine precisely where your stop-loss order will go.

    Basically, a stop-loss order is a method of investment risk management.

    A stop-loss order is when you define a particular step to be taken at a particular price. For example, you bought a stock at $50 and you placed a stop-loss order at $40. This means your stock will be sold when the price drop to $40. Of course, you may place the stop-loss order at any price. 

    But not all is ideal with this order.

    Stop-loss orders are static. They don’t move. Imagine the following situation. You set a stop-loss order at $40 but the stock price goes up at $80, which is much more than you bought it. In this case, when your stop-loss order is at $40 your protection is worthless. 

    How to calculate stop-loss?

    A stop-loss order is created to reduce your loss. For example, if you place a stop-loss order for 15% below the original purchase price, your potential loss will be limited to15%. For instance, you bought a stock at $100. What you have to do is to set a stop-loss immediately after buying and you set it at $85. This is important in case the price of your stock falls below $85. Your stop-loss will automatically be recognized as market price and even if the stock continues to fall, you will obtain your $85 per stock or the amount close to it.

    You may choose whatever percentage you want, all is up to you.


    Some advisors will tell you to set a stop-loss order at 10%. But if you think your stock is a good player you may decide to take more risk and set a stop-loss at 20, 30, or even 50%. For long-term investors, this may be a good solution, the bigger percentage will give space to the range and enough time to annulate the losses that can occur over time because they have a bigger investment horizon and have hope for a great return one day.

    But if you are a day trader just avoid big percentage, 10% of the initial price is quite a good solution to protect your trade.

    Defining a stop-loss order placing is all about targeting an individual risk potential. You should determine this price to limit loss. That’s the point.

    How to place stop-loss orders when trading

    Stop-loss orders are usually market orders, as we said. But if your stock doesn’t have a buyer at that price you may end with a lower price. That is slippage. 

    Stop-loss points shouldn’t be set at unplanned positions. Placing them is a strategy that should be based on your experience with different methods. This means you must have a trading plan. You have to know how to find the best way to enter the trade, how to control the risk, and how and when to exit the trade.

    If you are a beginner, just use a simple stop-loss strategy. That will give you the opportunity for the price to move in your benefit. Also, the simple stop-loss strategy will diminish your loss promptly if the price goes against you.

    Where to set stop-loss orders when buying


    One of the easiest ways is to set it below a swing low. A swing low happens when the price drops and then hops. That is the price support at some level.
    When you buy, the swing lows should be going upward. 

    Where to set a stop-loss order when selling


    Set it above a swing high. A swing high happens when the price grows and then drops. That is resistance.
    If you want short selling the swing highs should be going downward. 

    What is important with stop-loss orders

    There are several things you have to know about stop-loss orders.
    They are not suitable for dynamic traders and large chunks of stock because you can lose more in the long run.
    You must be sure that your stop-loss order has confirmation, never assume.

  • What Is EMA in Stock Trading?

    What Is EMA in Stock Trading?

    5 min read

    EMA in stock trading

    by Gorica Gligorijevic

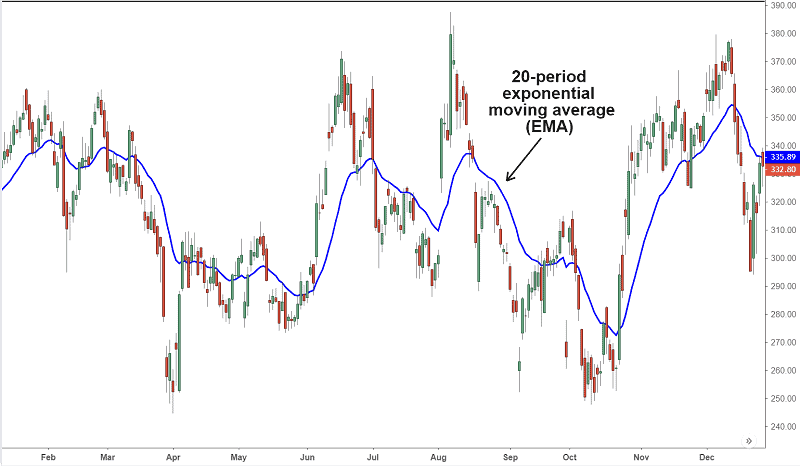
    EMA in stock trading is a tool for tracking the progress of stock prices. Term EMA is actually the exponential moving average.

    Moving average should be one of the crucial parts of your education as a stock trader. But EMA differs from simple MA.

    EMA is created from an easy mathematical equation. Nevertheless, it is one of the most valuable and relevant chart indicators. By using EMA in stock trading you can easily recognize buy and sell signals and build an individual technical stocks trading method.

    EMA is related to historical data of closing prices. The information given by EMA is extremely helpful because those data provide you to determine trends and find future price action. EMA is a data point.

    Since EMA is moving average, let us evaluating Moving Averages.

    It is easy to find a simple moving average or SMA. All you have to do is to sum all closing prices in some period, for example, 10-days. That number now, divide by 10. The result is SMA.

    Also, you can use the chart and add changes in every single trade every day. After, in our case 10 days,  will show you the trend in the average closing price. The SMA line trending upward shows stock is rallying, and vice versa, the SMA line trending downward, shows a stock falling in prices.

    Exactly, the EMA shows the current price trend. 

    EMA in stock trading


    The longer the period covered by the EMA, the lower the relative weighting for recent trading.

    EMA chart lines such as 10-days can be used to simply see stock price trends. The slope of the EMA line will show you if the stock is in an up or downtrend. One interesting image may appear in the chart, it is the cross. When the price hits an EMA line and passes it, you can recognize the cross. That is the sign of a reversal trend.

     EMA line for a short period as in our example is, can tell when the trend is changing. The other EMA lines for 50-days or 200-days periods shows resistance and support levels for the stock price.

    How to use EMA for trading strategy?

    By drawing EMA and SMA on the chart, you can detect a potential shift in a stock price. If you notice the EMA line crosses over SMA line you can be sure the price is reversing from the current trend. Moreover, SMA will show you the support level and resistance level.

    To remind you, the support level is the point when the price is falling, and the resistance level is the point where the price starts to rise.

    The best moment to enter the trade is just when the price breaks the trend line or bounces against it and reverses. These points are made by crossing the EMA line and that is the reason why EMA is called a data point.

    How to calculate the EMA

    First, measure the SMA over an appropriate time period. It is the total of the stock’s closing price divided by the same number of periods. For example, a 10-day SMA is simply the amount of the closing prices for the last 10 trading days, divided by 10.

    The formula is 

    SMA = (N−period sum) / N

    N is the number of days in a specified period

    the sum represents the sum of stock closing prices in the observed period

    Further is somehow more complicated but not impossible :).

    Calculate the multiplier for weighting the EMA. 

    The weighted multiplier is calculated as 

    2÷(selected time period+1)

    2÷(10+1) = 0.1818 which is 18.18% in percentages.

    [2 ÷ (selected time period + 1)]

    or

    [2/(10+1)]= 0.1818

    And the last step. To calculate the EMA, use this formula

     [Closing price-EMA (prior day)] x multiplier + EMA (prior day)

    Let’s calculate the EMA in stock trading:

    EMA=Price(t)×k+EMA(y)×(1−k)

    The legend:

    t – today

    y – yesterday

    N – number of days in EMA

    k – 2÷(N+1)

    Bottom line

    Due to different trading strategies, underlying security, and traders affinities, you can find different types of moving averages. But one thing is sure, EMA is extremely popular because it gives more power to current prices, and has more advantages than other averages.

    EMA relies entirely on historical data. Some economists think that market prices carry all information. According to them, we don’t need EMA because the historical data will tell us nothing about the price movements in the future.  Also, there is the question of where to put more attention. On the current data or past data. Some traders think that fresh data quite good match the current trends.

    But one thing is sure: EMA is popular. If it cannot provide a good result, why traders would use it.

    • Chart source: TradingView
  • Take Profit Order – Limit Your Risk

    Take Profit Order – Limit Your Risk

    3 min read

    Take Profit Order

    Take Profit order or shorter TP is extremely essential element in all tradings. How to place the Take profit order? The question of how to place stop-loss order is one and those two are related and connected.
    So we have to make some distinctions.

    Stop-loss order linked to the risk when you take a position.

    Take profit is related to the gain for your open position.

    Both of these elements form what we call – money management. We told you about Stop-Loss in the prior posts. In case you missed it, you can read it HERE or HERE.

    But let’s stay awhile with the definition of “Take Profit” order.

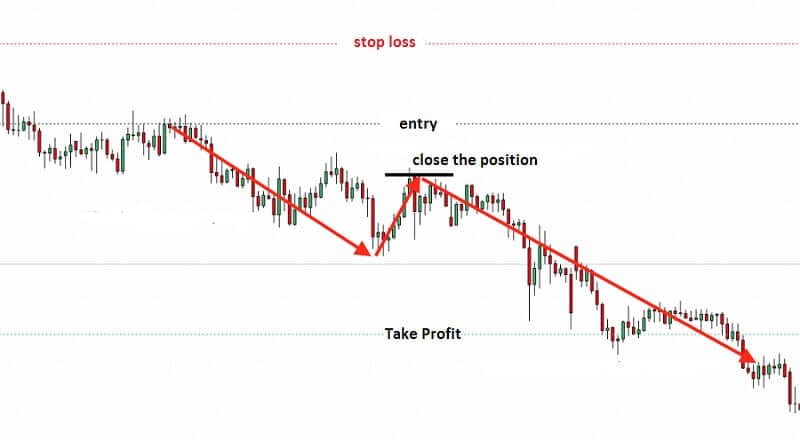
    Take Profit order is a limit order. Traders use it to close a position when the market touches a specific price level. To be more clear. Take profit represents the reward that a trader planned before taking a position. Take Profit order has to follow, must go in the same direction as the market. The trader is free to define the level of reward depending on his/her feeling of how much risk is taken to obtain adequate profit.

    Take Profit order is similar to Stop Loss order, meaning, it is an exit order. Yet,  Stop Loss order will limit your loss on a trade, but Take Profit means a price at which a successful trade will be automatically closed. To make this simpler – Take Profit is your profit target. That is the reason why you always have to set Take Profit order at the level you are expecting the price will catch. When you buy, for example, a stock, your Take Profit order must be higher than the current price. But if you are selling a stock, your Take Profit order should be below the current price.

    Yes, we know you have an excellent idea. 

    But do you know how to place a Take Profit order? 

    If you do it wrong, you will not make a sufficient profit.

    Levels of resistance and support will help you to place a proper TP. This strategy is the most successful and we will show you why.

    Take Profit Order

    First, locate a resistance level in your chart. Then place a Take Profit order a bit below the resistance. In this way, when you place TP under the resistance level, you will increase your chances to match the level that the price will hit. The next step is simple, just close your position and make a profit. This profit will always be higher.

    This is in case you notice an upward trend. But if you notice a downward trend, you have to determine a support level.

    In that case, TP has to be a bit over the support.

    Contrary to the situation with resistance, a TP level should be a bit over the support.

    Experienced traders have some TP tips. One of them is that the TP must be 2 or 3 times of the SL value. But this advice is doubtful. You have to consider more indicators, not just one. If you are trading Forex, this strategy will work for you.

    But if you are trading stocks some other rules are more convenient.

    You will make the most gains in the 20%-25% range.

    If you see a notable increase of 20% to 25% – sell.

    Why this 20%-25% range?

    Stocks tend to rise 20% to 25% after breaking out the support, then fail and set up new support. Sometimes this game resumes their progress.

    In Traders-Paradise’s Full Trading & Investing Course – Secrets Revealed

    (don’t forget to subscribe while it is free of charge, the time is limited) you find a fantastic lesson about the rules and among them an explanation of the Rule of 72.

    Following Rule 72 you can easily calculate why the 20% to 25% is adequate Profit take range.

    How to calculate?

    Divide 72 by the percentage gain you have in stock. The result will show you how many times you have to compound that gain to double your capital. Let’s say you get 3. Re-invest your capital plus gains 3 times. You will double your money easier than to make 100% profit from one stock. The net profit will be greater. But as we mentioned, you have this all and detailed explained in Traders-Paradise’s Full Trading & Investing Course – Secrets Revealed

    Why place a Profit Target?

    Determining where to exit before trade begins allows you to calculate the risk/reward ratio.

    The stop-loss defines the possible loss on a trade. But the profit target defines the possible profit. Logically, the possible reward should exceed the risk. 

    By trading with a profit target, it is possible to estimate whether a trade is worth taking. If the profit potential doesn’t exceed the risk, don’t take a trade. By establishing a profit target you can eliminate weak trades.