
5 min read

by Gorica Gligorijevic
EMA in stock trading is a tool for tracking the progress of stock prices. Term EMA is actually the exponential moving average.
Moving average should be one of the crucial parts of your education as a stock trader. But EMA differs from simple MA.
EMA is created from an easy mathematical equation. Nevertheless, it is one of the most valuable and relevant chart indicators. By using EMA in stock trading you can easily recognize buy and sell signals and build an individual technical stocks trading method.
EMA is related to historical data of closing prices. The information given by EMA is extremely helpful because those data provide you to determine trends and find future price action. EMA is a data point.
Since EMA is moving average, let us evaluating Moving Averages.
It is easy to find a simple moving average or SMA. All you have to do is to sum all closing prices in some period, for example, 10-days. That number now, divide by 10. The result is SMA.
Also, you can use the chart and add changes in every single trade every day. After, in our case 10 days, will show you the trend in the average closing price. The SMA line trending upward shows stock is rallying, and vice versa, the SMA line trending downward, shows a stock falling in prices.
Exactly, the EMA shows the current price trend.
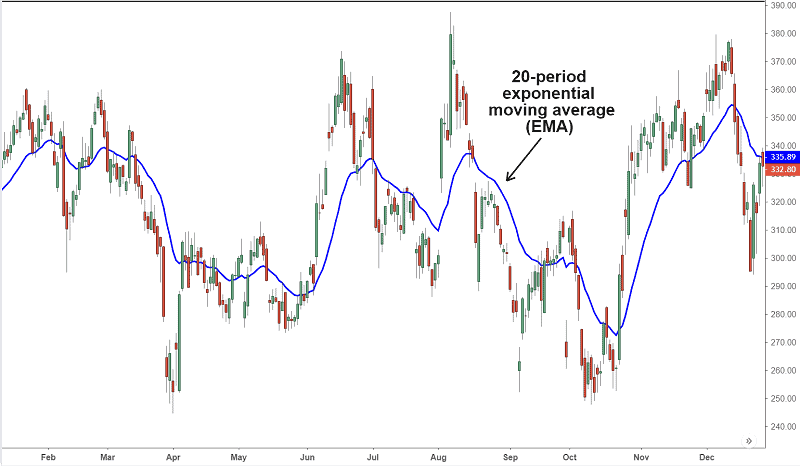
The longer the period covered by the EMA, the lower the relative weighting for recent trading.
EMA chart lines such as 10-days can be used to simply see stock price trends. The slope of the EMA line will show you if the stock is in an up or downtrend. One interesting image may appear in the chart, it is the cross. When the price hits an EMA line and passes it, you can recognize the cross. That is the sign of a reversal trend.
EMA line for a short period as in our example is, can tell when the trend is changing. The other EMA lines for 50-days or 200-days periods shows resistance and support levels for the stock price.
How to use EMA for trading strategy?
By drawing EMA and SMA on the chart, you can detect a potential shift in a stock price. If you notice the EMA line crosses over SMA line you can be sure the price is reversing from the current trend. Moreover, SMA will show you the support level and resistance level.
To remind you, the support level is the point when the price is falling, and the resistance level is the point where the price starts to rise.
The best moment to enter the trade is just when the price breaks the trend line or bounces against it and reverses. These points are made by crossing the EMA line and that is the reason why EMA is called a data point.
How to calculate the EMA
First, measure the SMA over an appropriate time period. It is the total of the stock’s closing price divided by the same number of periods. For example, a 10-day SMA is simply the amount of the closing prices for the last 10 trading days, divided by 10.
The formula is
SMA = (N−period sum) / N
N is the number of days in a specified period
the sum represents the sum of stock closing prices in the observed period
Further is somehow more complicated but not impossible :).
Calculate the multiplier for weighting the EMA.
The weighted multiplier is calculated as
2÷(selected time period+1)
2÷(10+1) = 0.1818 which is 18.18% in percentages.
[2 ÷ (selected time period + 1)]
or
[2/(10+1)]= 0.1818
And the last step. To calculate the EMA, use this formula
[Closing price-EMA (prior day)] x multiplier + EMA (prior day)
Let’s calculate the EMA in stock trading:
EMA=Price(t)×k+EMA(y)×(1−k)
The legend:
t – today
y – yesterday
N – number of days in EMA
k – 2÷(N+1)
Bottom line
Due to different trading strategies, underlying security, and traders affinities, you can find different types of moving averages. But one thing is sure, EMA is extremely popular because it gives more power to current prices, and has more advantages than other averages.
EMA relies entirely on historical data. Some economists think that market prices carry all information. According to them, we don’t need EMA because the historical data will tell us nothing about the price movements in the future. Also, there is the question of where to put more attention. On the current data or past data. Some traders think that fresh data quite good match the current trends.
But one thing is sure: EMA is popular. If it cannot provide a good result, why traders would use it.
- Chart source: TradingView
Leave a Reply