Tag: Stock trading

All stock trading related articles are found here. Educative, informative and written clearly.

  • How to trade stocks during the recession?

    How to trade stocks during the recession?

    How to trade stocks during the recession?
    Generally, trading is unquestionably one of the most difficult things but it is maybe the best opportunity to make money.

    By Gorica Gligorijevic

    I’ve been examining for some time now how to trade stocks during recession. Don’t doubt we are in a recession now because we are. Well, this recession isn’t like we know from our previous experiences. The one we are talking about is caused by a pandemic. 

    I know that many experts will argue that the recession would come anyway. That might be true but this one came due to the coronavirus pandemic and thus, it’s somehow different but speaking about how to trade stocks, the principle could be the same. That’s my opinion.

    First of all, let’s make clear one important thing. We all know that the most important market gains occur during short periods of time. What does it mean? It means the market profits aren’t equally spread throughout time.

    How should traders trade stocks during recession? 

    Stock trading in a recession could be very different since there are several opposing schools of thought. Some experts would suggest traders should go short. That is true due to the fact that some companies’ profits could be hurt and lower share prices.

    Yet, there is another group that deems the recession is a “lagging indicator” thus their opinion is contrarian.

    The first school advises traders to be cautious in these circumstances. This means traders should take little or no trading activities. In general, they suggest traders stay away until the end of the recession.

    Is a recession time to buy? 

    Yes, I know that many people have lost a lot but, on the other hand, many profited. So, I concluded that loss and profits during the recession depend on the strategy you use and the assets you trade.

    Take the risk and go short 

    This could be a possible best way to earn a lot of money during the recession when the market downturns. Well, if a downturn never comes you’ll not make money. 

    In a recession, traders usually go short. They short their stocks, some will sell their call options or buy puts.

    These trading activities show that traders expect the price will go down. If that happens traders will increase their gains. The most important for every trader is to set a stop-loss level and take profit level. That will trigger your risk management rules if the price changes direction and goes against your position. These settings will provide you to close the position in small losses. 

    In fact, gains from short positions happen faster.

    Short your stocks if you feel you have an advantage and if you want more direct exposure. Stocks with high beta could be the worst players during recession. These companies have weak balance sheets and the lowest earnings. Such companies could easily be from the tech or biotech sector, but always they are small-caps. 

    They are dropping faster due to traders’ expectations they will no longer exist.

    What else can you do?

    You can go long volatility if you buy a volatility ETF such as VXX. It showed great results in 2018 and in 2019 with sell-offs. If you chose this strategy to trade stocks during recession, keep in mind that you shouldn’t go long volatility for a long time. That could lead you to “decay”.

    Go long volatility for a short time, for example, it could be a month or two but no longer.

    Also, go long gold because it has tendencies to perform very well during recession. Well, gold cannot give you dividends or generate earning but it is a tradable commodity. In the dire economic circumstances, this asset always becomes more valuable. With some gold ETF, you could earn a lot.

    How to make money during recession?

    You couldn’t be more wrong if you think it’s impossible. Pay attention to how long you’re shorting the market. Bear in mind, when you’re buying volatility in the market it can last just one week. On the other hand, if you’re shorting index funds such as the S&P 500, you can do that for up to two years. 

    The point is to have discipline and short for a short time. Otherwise, you’re more likely to lose your money due to your faulty timing. To be honest, the simplest way to make money during a recession is to go long cash or cash equivalents. For example, some low-risk investments could be the right choice.

    Interest rates are currently ultra-low right. You can invest in treasury notes, treasury bills, bonds, money market mutual funds, fixed annuities, preferred stocks, common stocks that pay dividends, or index funds.

    Always have cash reserves. Remember, the latest mentioned are investing opportunities. If you want your money to earn a higher return on, you do have different options. Don’t be afraid to day trade, it can generate a lot of money right now.

    What’s the best strategy to trade stocks during a recession?

    Learning to trade is unquestionably one of the most difficult things. It can be terrifying and frustrating in the beginning. I want to say to new traders that attempt to enter this field, never try to figure out everything at once. You’ll be overwhelmed by the information and that can only confuse you. Make small progress every day, trade a little each day, and learn.

    Remember, it is 100 percent sure that it is possible to make a  lot of money during recession. The thing needed for trading is here – the price fluctuation. So, it is almost the same when there are no recessions or downturns. For stock trading price fluctuation is essential. 

    You must have a strong risk management strategy, and not more than two trading strategies. Never be impatient, just wait for A+ setups. You must have a trading plan, it’s impossible to just jump in a trade.

    Trade smart!

  • Is Trading Stocks A Zero-Sum game?

    Is Trading Stocks A Zero-Sum game?

    Is Trading Stocks A Zero-Sum game
    Trading stocks is not a zero-sum game and both sides can be winners.

    By Guy Avtalyon

    Is trading stocks a zero-sum game is sometimes more rhetorical question than it is related to trading. But shouldn’t be. In stock trading, we have two different sides. One is represented by winners, the other includes losers. On any transaction in the stock market, the chances of winning and losing are near even. So, who are the winners and losers of this zero-sum game?

    Winners have better portfolios, they are usually long-term traders, they can sustain seldom losses because their investment horizon is larger. On the other hand, traders that frequently place trades, have losses more often. So, the profits and losses of all traders should sum to zero if trading stocks is a zero-sum game, right? 

    Trading stocks is mathematically a zero-sum game is a logical conclusion. However, it is more complicated.

    Who wins and who loses when trading stocks?

    Trading is a zero-sum game only when you measure gains and losses relative to the market average. In the zero-sum game, there is always one winner and one loser. The amount that one trader profit has to be equal to the amount the other loses. That would mean the winners can profit only the amount that losers are ready to lose.  

    This is true, but we come to something known as market capitalization. That’s the number of company’s shares outstanding and times by its market price per share. The volume of transactions is comparably small related to shares outstanding. The stock price could appreciate or depreciate only if traded below or above the market price. When traders hold their positions no one could lose or win. But when traders choose to exit their positions, some will be winners while the other will be losers. Yes, to this point everything is clear but trading isn’t a poker game where the winner takes it all. It is the opposite a bit. 

    Is trading stocks a zero-sum game?

    The stock market is an open system. The presumption that trading stocks is a zero-sum game comes from another presumption that the stock market is established by a constant and non-changeable number of securities traded. That would mean no stocks or other assets enter, no exit. As we know the reality is different. Publicly traded companies can issue more stocks and also they can buy back their shares to increase the price while diminishing the number. Also, some companies declare bankruptcy and become not publicly traded or bought by other companies. So, the stock market is a kinda living being. It isn’t constant or fixed.

    Trading stocks is a zero-sum game if one trader gains only what the other loses, both expressed in money. When both buyer and seller strive for the same thing, we can say it is a zero-sum game. But trading stocks is connected with liquidity, risk management, etc. It isn’t just about money. There is something in the character and outlook of the participants. If they are similar the aims will be similar too, and the trading could become a zero-sum game.

    Trading stocks is zero-sum only when the competition is excellent, only when it is perfect. That would mean the traders on both sides, buyers and sellers, have the same information and make decisions that lead in the same direction to the same conclusion. For example, the ABC company’s stock price is going to drop. Buyers and sellers both have that information and buyers would like to buy that stock at a lower price while the sellers would like to sell it at a higher price. When their particular interests match each other the trade occurs. Only then, we can talk about trading stocks as a zero-sum game.

    Is day trading a zero-sum game?

    Day trading could be a zero-sum game. Here we can find an equal number of winners and losers. The most popular markets among day traders are options and futures markets which are zero-sum markets. How does this work?

    Let’s say you\re the one who holds the option that makes a profit. On the other side is the trader who wrote the option. The second trader, the seller of that option will lose the same amount. 

    Who are the winners and who are the losers in a zero-sum market? 

    You may think that all depends on luck. But you’re wrong. The real winners are traders with discipline. The winners have a trading plan, they know where and when to set limits, and never trade based on emotions. Instead, they use accurate data. So, the futures and options markets are zero-sum game markets. 

    But when we come to the stock market it could be real nonsense to claim it is a zero-sum game.

    Where is the difference?

    Let’s say, for example, if the economy is growing, companies’ profits rise, what is going to happen? How could this condition influence the stock price? Of course, the stock price will increase. In such circumstances, we will have more winners than losers among traders. Especially among long-term participants. Of course, some days it is possible to see more losers. That is the reason why some people understand the stock market as a zero-sum game.

    Trading stocks isn’t a zero-sum game

    All trades in the stock market are based on future expectations. Every single trader has different risk tolerances. The market always counts on it. If part of traders are selling their stocks that does not necessarily mean they are losers. Every trader has a particular and different goal when trading. For example, one can decide to hold the position until making a particular profit. So, what does a trader have to do when reaching it? Such a trader will exit the position to book profit, it’s so natural. The trader who is buying that stock may end in losses since there is no guarantee he/she will profit also. But what if the second trader proceeds profiting? Can you see, both sides, seller and buyer are winners.

    Bottom line

    So, trading a stock market is a more win-win situation than a zero-sum game. When trading stocks always keep in mind that some stocks pay dividends. That is an important factor when discussing stock trading as a zero-sum game. It isn’t rare for investors to get more money from dividends, even more than their initial investment was. The stock trading isn’t just a relation among sellers and buyers, it is more. That’s why we can’t say stock trading is a zero-sum game.

  • Gain of 15 percent Yearly When Trading – Is it Possible?

    Gain of 15 percent Yearly When Trading – Is it Possible?

    Gain of 15 percent Yearly When Trading - Is it Possible?
    One of the journalistic truths is that if an article is titled with a question, most often the answer is “no”. But in this case, it is “it depends”.

    By Gorica Gligorijevic

    Making money is the aim of markets, and the gain of 15 percent yearly is often a goal of individual investors. In the colloquial speech “beating the market” means having the return on investment higher than the S&P 500. Since this index was established in 1926, it has posted on average just a bit over 12% gain annually. Which makes striving for 15 percent yearly gains an appealing target to aim for. But the gain of 15 percent yearly is possible. Especially in this world of relatively frequent market corrections and downturns?

    One of the primary characteristics many famous traders are looking for in potential stocks for investment is having an average yearly growth over a number of years of 15 percent or more. The fact that big and successful traders do make investments in stocks says more than anything that such gains are out there waiting to be earned. But there are two schools of thought on this subject matter. One is saying that it is impossible and other, that it is possible to achieve a gain of 15 percent yearly or even more profits per year on the market.

    Why is the gain of 15 percent yearly not possible?


    One of the most common arguments among the members of this school of thought is the historic data, particularly for the past 20 years. One of the most cited sources is the J.P.Morgan Asset Management’s data which paints a bleak picture of annualized returns. The absolute bottom of all investment classes in their study is taken by the average investors with just 1.9% returns. The top of the pack is the real estate investment trusts with just 9.9% annualized gains in this period.

    And when you look at those numbers it does look impossible to reach a gain of 15 percent yearly. 

    But among them are also those that point out that this number is by itself a misleading measure. And the math does back them. Because simply put, an average is calculated by adding up all numbers and dividing the sum with how many numbers you have. And it doesn’t reflect how much money you end up with after a certain number of years. 

    For example, if you invest $1,000 and in the first year you have 100% gains but in the second 50% losses, your average return is

    (100-50)/2=25%. 

    But in reality, you have no gains at all. After the first year and 100% increase, you have $2,000. But after losing half of that in the second year, you are back where you have started. With $1,000.

    The influence of CAGR

    Often, they would point out that the compound annual growth rate (CAGR) is a more precise metric, especially for a long term investment. The point is that it captures the compound effect of gains. In other words, average gains show only the average of percentile changes over some period of time. The CAGR shows at which rate your investment actually grew.

    Another argument is that the long term averages, either the arithmetic mean or CAGR, are a misleading measure due to fundamental changes in the markets in recent times. Market corrections happen more often and are caused for different reasons than back in the old days of the 20th century. Thus, over the long-term decreasing the annualized gains even more.

    The third and most common argument is that only the best of investors have ever beaten the market. People like Warren Buffett, Seth Klarman, Benjamin Graham, and so on. Long term value investors, who have gained fame and fortune by extraordinary means. That the average Joe at best can hope to equalize the track record of indices in the long run.

    Why is the gain of 15 percent yearly possible?

    To understand why it might be possible to have a gain of 15 percent yearly when trading you first need to understand that most of the arguments against such possibility are concerning the long-term investments. The buy and hold strategy. And that they are painting the generalities, while precise and correct, fail to present a more granular image of markets.

    Many will point out that the paradigm of the markets has changed. That the real profits are in the “buy and protect” strategy. While it can be costly, smart protection of your profits can yield considerable annual gains.

    Another group of proponents points out the fact that in the 21st-century markets are marked by considerable short-term swings. So that profits are in the swing trading, buying low and selling high while holding stocks just several days or few weeks. This type of trading can bring high and fast profits, but also high and fast losses. Thus, they warn that you should arm yourself with knowledge if you want to achieve a gain of 15 percent yearly.

    Educate yourself 

    Looking for patterns with increase and fall, and thus guessing accurately when to buy and when to sell. Also, collect data about the stocks you wish to invest in. patterns emerge and disappear, and the inherent volatility of the markets is an opportunity for making profits. 

    Studying the historical data of a limited number of stocks can give you insight into a very probable future movement of the prices. You should aim to get in the market at the right time and also exit at the opportune moment. And many will suggest you to not throw your net very wide, not to study too many stocks or look for too many different patterns. To concentrate on quality and not quantity. And always, make sure to have set a stop-loss.

    Try day trading

    The most convincing argument comes from day traders. It can be done very easily, but it comes with a risk. Day trading amounts to entering a trade at a certain predetermined point and exiting at a similarly predetermined point. All after just a few minutes or maybe a couple of hours. 

    Achieving the gain of 15 percent yearly when trading is very easy if you look at it in a certain way. That it is a large number of trades with relatively modest gains on average, in a relatively large period of time. Day trading can involve almost any financial vehicle, but the most popular are stocks, futures, and forex. 

    Quick, relatively small trades compared to multi-million investments you can hear about in the news can bring you a tidy sum in profits on a daily level. And if you are not greedy and use a system which can net you a 50% or more success rate, little by little it adds up.

    A portfolio that can yield a 15% gain per year

    One of the journalistic truths is that if an article is titled with a question, most often the answer is “no”. But in this case, it is “it depends”. If you are looking for a long term investment conventional wisdom is that it will be almost impossible to create a portfolio on your own. And such that could have a gain of 15 percent yearly from trading. Your best option is an investment into ETFs of well-known super-traders and established fund managers with a solid track record. That could, in the long run, net you around 10% per year. 

    But, if you decide for short-term trading there is money to be made in the markets. Markets are by nature volatile, and that presents the risk. But even the steepest market downturns are not straight lines but have a lot of small upticks along the way. And these are the opportunities, which if seized can give you a gain of 15 percent yearly when trading. 

  • Morning Star Pattern How To Trade It?

    Morning Star Pattern How To Trade It?

    Morning Star Pattern How To Trade It?
    How to identify the Morning Star pattern, how to trade it? Is it bullish or bearish? Is the Morning Star pattern good or bad when seen in the chart?

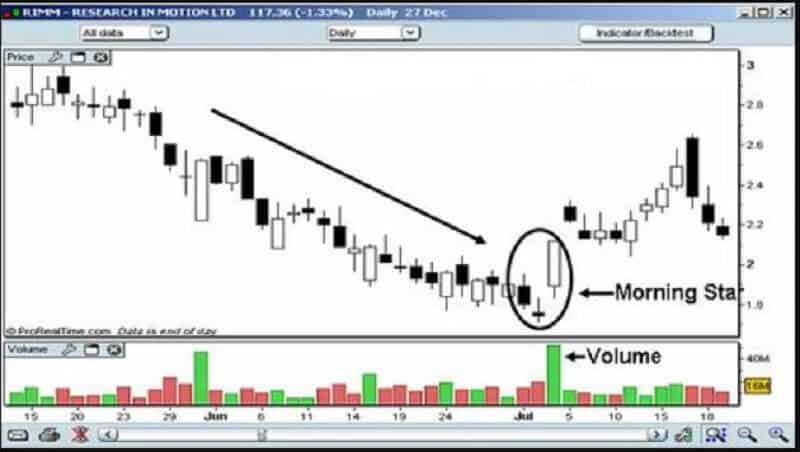
    To know how to trade this pattern we have to know what the Morning Star pattern is. First of all, you have to look at three candles and are near the support level. If yes, to have the Morning Star pattern, the first candle has to be bearish, the second has to be doji, and, finally, the third has to be a bullish candlestick. This third candlestick is important because it creates a bullish reversal pattern. So, logically, the Morning Star pattern is a bullish reversal pattern. At first glance, it may not look as bullish but we’ll explain to you how to recognize this pattern when it appears. Also, Traders-Paradise will introduce you to some trading techniques related to the Morning Star pattern. 

    This pattern will always tell you that something good is on its way. Bullish traders will always look for this pattern because a great reversal may occur. 

    The advantage of Japanese candlestick patterns is that even one candle has the whole story but when they are arranged together, you’ll have the novel. In terms of trading stocks, you’ll have the pattern that will tell you when your stock is going to breakout or breakdown. What is more important, when using the Morning Star pattern, you’ll know everything about the emotions of traders. For example, if you see long-legged candlestick, you’ll know that there was a hard battle among bulls and bears but without progress or change. At the end of the trading day, they are both pushed to the starting levels. 

    Therefore, understanding of candlesticks and their purposes is essential.

    What is a Morning Star pattern?

    We’ll need three trading days to be sure the Morning Star pattern appears. As we said earlier, this pattern is bullish but the first candlestick is large and bearish. That is due to the current trend and the first candle is in harmony with the trend. The second candle you’ll recognize when you see a small real body. It is a doji. This doji reveals hesitation and it’s followed by the third candlestick which is bullish. This third candle should be a large bullish one (the charts aren’t perfect, so how big is this third one, doesn’t really matter at this moment), so it tells us the bulls are coming back. They want to take over.

    So, the first day the bears have absolute control. The candlestick from the next day will tell us that there was a battle between bears and bulls and one of them is in control but yet it isn’t known which one. That’s something that doji tells. Still, we don’t know who is the winner so we have to look on the second day as on the day of indecision. We’ll understand who has a control on the third day when the bulls actually are knocking down the bears and winning the battle. So, the new direction on the stock price is starting. The price reversal is here.

    How strong is the reversal? 

    Well, we have to consider several signs to be able to conclude that.

    The longer the candles, the higher reversal. Further, the reversal will be higher if there is any gap on both sides of the middle candlestick of the Morning Star pattern. 

    To make this clearer, the second candle is the star. It has a short real body, separated from the real body of the first candlestick. The gap between the real bodies of the two candles separates a star from a doji or a spinning top. The star may appear in the shadow of the first candle, it isn’t necessary to form below the low of the first candle.

    The appearance of the start is the first sign of bears’ weakness. They are not strong enough to push the price lower than the closing price on the prior day. The third candle will confirm their weakness. This third candle has to be lighter in color. Actually, the middle candle can be red or green or black or white because the bulls and bears are going to balance out across the session.) in the charts and pierces into the body of the candle from the first day. 

    Also, if there is a gap between the first and second days. Here we came to the size of the third candle. If this candle is higher than the candle from the first day, that means the greater the bullish takeover. 

    How to trade Morning Star Pattern?

    We already said the Morning star pattern is a sign for the start of a trend reversal. From bearish to bullish. Well, you have technical indicators on disposal that may help you to unveil the Morning Star is going to form. For example, when the price is nearing a support zone. The other indicator could be when RSI confirms that the stock is oversold.

    Also, pay attention to the volume. It can be a great contributor to the forming of this pattern. When the volume increases during the three trading days and on the third day it’s the highest that’s the confirmation of the Morning Star pattern followed by the reversal.

    You should take up a bullish position in the stock when the Morning Star forms. Then, ride the uptrend until there is an indication of an added reversal. So, it’s important to notice when the first falling bearish candlestick is going to form. Further, monitor for the second smaller candlestick which is spinning top or doji, as we explained above. Plan your stop now. When the third candlestick is formed it is a bullish one, wait until it breaks above the third and take a long position. If you go long, set your stop below the bottom of the last candlestick. Some traders would wait until the price drops below the third candlestick and then enter a short position and set a stop above that candle. 

    Bottom line

    This pattern is a bullish reversal pattern. That means that buyers (bulls) take control of the sellers (bears) and push the price in the opposite direction.
    Trading completely on visual patterns can be a risky plan. The Morning Star pattern is best when it is supported by volume and a support level, as the back indicators. It isn’t hard to notice this pattern. It will appear whenever a small candle occurs in a downtrend.
    Whatever the candlestick pattern you use, you have to understand that there are many variations of it and on it. But one thing is sure, the Morning Star is a bullish reversal pattern that tells us that some good things are going to come.

  • Inverted Hammer Candlestick Pattern

    Inverted Hammer Candlestick Pattern

    (Updated October 2021)

    Inverted Hammer Candlestick Pattern
    Inverted Hammer candlestick pattern occurs essentially at the bottom of the downtrend and can warn of a possible reversal upward

    Inverted Hammer candlestick pattern is visible on a chart during the higher pressure from buyers to push a stock price up. It is a bullish reversal pattern. This pattern is identified by a long upper shadow and a small real body. They usually appear following the real longer black body. It’s pretty similar to the Shooting star candlestick pattern. Inverted Hammer occurs in a downtrend. In trading charts, you’ll notice a long black candle visible on the first day of appearance. On the next day, you can see how a small real body develops. It will occur at the lower end of the range. The candle for the second day will have an upper shadow, two times longer than the real body, and will not have a lower shadow. Don’t pay attention to the color of the real body. It isn’t important at this moment.

    What does the Inverted Hammer candlestick pattern tell us? 

    The long upper shadow indicates the buying pressure after the opening price. It is followed by significant selling pressure but insufficient to bring the price down, below the open. However, we’ll need bullish confirmation that may come as a long empty candlestick or a gap up, but followed by a heavy trading volume. 

    Inverted Hammer candlestick pattern tells us that bullish traders raise their confidence. The top of the candle is made when bulls push the price up the farthest they can. The bottom of the candle shows the bears attempting to resist that higher price. Bears are short-sellers. Still, the bullish trend is extremely strong, and the market is settled at a higher price. 

    Also, an inverted hammer candlestick pattern tells us that there could be a price reversal as a result of a bearish trend. Keep in mind, never observe the inverted hammer candlestick pattern solely. You’ll need confirmation of other technical indicators. Ultimately, check your trading plan before trading the inverted hammer. 

    What is the Hammer candlestick pattern?

    A hammer pattern in candlestick charting is a price pattern. It happens when an asset trades lower than its opening price, but the rally is formed inside the given period, for example, one trading day, to close near the opening price. The pattern looks like a hammer. The lower shadow is a minimum twice the size of the real body. The body of the candlestick signifies the difference in the opening and closing prices and the shadow tells about the high and low prices for that period.

    A hammer occurs after the price of security declines. That is the sign the market is trying to define a bottom. Hammer will appear when the sellers miss forming the bottom and push the price to rise and reverse. In short, the price drops after the open but later, closes near the bottom after regrouping. 

    A hammer candlestick doesn’t show a price reversal to the upside,  it has to be confirmed. Confirmation means the next candle that follows the hammer, closes higher up to the closing price. On such occasions, traders usually enter the long position or exit their short positions. Traders that are taking long positions it is recommended to set a stop-loss below the low of the shadow.

    The meaning of Inverted hammer pattern

    It is important to understand that all inverted patterns imply that the price will change soon. It will not reveal a particular trend but it will warn you that the market will change its momentum.

    Speaking about an inverted hammer pattern, its appearance shows the market is going up with buyers that are taking control. So, the price will go higher. Also, momentum changes, so the sellers are taking the price back to the level of the opening price. The pattern can send out many buys and sells signals in various cases. 

    Inverted Hammer is a trend reversal pattern, and it’s opposite to the hammer pattern. As a signal of bearish reversal, it comes after the stock price falls and symbolizes the strength. What does it look like? Let’s say the stock price tries to move up but the current downtrend blocks it. The bears push it down and form the top tail of the inverted hammer. At first glance, it may look like the trend is continuing since it arrives near a support zone and indicates the bullishness of the stock.  And the war can start. The bulls against the bears, where the bulls are trying to launch the stock up to new higher levels.

    How much the color is important?

    It’s time to explain the color of the body of the inverted candlestick. It could be dark or light. The light body reveals that a stock closes higher and is more powerful than its peers.

    When the uptrend is out of the scene the pattern is ready for the trend reversal. The stock price will go back to the opening price and probably stay around that price until the end of the trading day. You should wait for the next day and the new opening price.  You’ll know if the stock goes down further or the buyers will give it another chance and take the stock to a better position.

    The Inverted Hammer candlestick pattern is maybe one of the main reversal signals in stock trading. You must consider confirmation criteria before trading with this signal. The upper side has to be twice longer than the length of the body, while the lower shadow is very small or there is no, it’s invisible. You must be sure you have the right picture. Let’s say this way, the length of the upper shadow is directly proportional to the possibility of a reversal.

    Also, if there is a gap down in comparison to the close of the prior day, it could be the base for strong reversal. Start trade the Inverted Hammer candlestick pattern the day after the appearance of the signal because in that period the stock will open higher. Consider one aspect more, it’s the level of the trading volume on the day when the inverted hammer signal appears. High volume will increase the odds of blow-off.

    The logic behind this pattern

    First of all, the market condition is bearish as a reply to a downtrend. The stock could start to trade higher, so the bulls will not have the necessary strength. Hence, we have sellers on the scene that are pushing the price down to the lower trading range. Generally speaking, the bears will dominate the market all trading day in such a case.

    The bulls will attempt to recover power the next day causing the price jumps because the bears aren’t able to exercise the needed resistance. If the price sustains its strength even on the next day, you can be sure that you have the confirmation for the inverted hammer pattern.

    If you want to trade an uptrend, you can “go long” which means you can buy. But if the signal isn’t strong enough and the downtrend will continue, so you can “go short” which means you can sell the stock or any other asset you hold.

    Bottom line

    Inverted Hammer candlestick pattern indicates a bullish reversal and it’s recognized in downtrends. Traders need this to decide on the next move. Keep in mind, this pattern isn’t the same as the shooting star pattern. There is a difference. Inverted Hammer candlestick patterns will never occur at the high of the trend line as the shooting star. Inverted hammer will always occur at the low of the trend but not as often as regular hammers. Sometimes, the signals that an inverted hammer may produce can be confusing. That’s the reason to double examine the length of the shadow. It is the most important. 

    Some experts will not recommend using this signal as a trigger for entry. Still, if you want to use it you’ll have an advantage if you wait for a bullish confirmation candlestick. This signal performs the best in time frames of four hours or one trading day. In longer time frames, use it as an entry signal to sell, but not to buy. Remember, the inverted hammer pattern must appear after a downtrend. The flat or sideways markets are something you will not like in trading this pattern.

  • Stop-loss First, Then Consider The Entry

    Stop-loss First, Then Consider The Entry

    Stop-loss First, Then Consider The Entry
    In stock trading, the essential part is to move quickly in and out of the position to profit more.

    Guy Avtalyon

    Everyone who even thinks about trading must understand the importance of stop-loss and why the Traders-Paradise team likes to say stop-loss first. 

    The stop-loss is one of the simplest tools from any trader’s toolkit. This order is connected to the stock’s movement, no matter if the fundamentals for the company have changed. The stop-loss first,  because if you use it you’ll have a greater chance to outperform the market. Let’s explain this. When the price of the stock goes down, the stock becomes more volatile, which means more risk. 

    Correlations between stocks and the market increase more when markets are dropping than when they are growing. So, the portfolio risk rises, and therefore diversification impact reduces. Increased volatility and higher risk, can expose stop-loss order as extremely important in risk exposure control. The gain could be potentially made by reducing the risk and getting a higher risk-adjusted return.
    Using stop-loss strategies you can reduce your emotional reactions while trading, and overcome the volatile market. So, the saying “stop-loss first” covers many situations when it is beneficial and we’ll show you some of them.

    Why stop-loss is the first consideration

    Stop-loss is the primary guarantee for profiting in the stock market. When you set your stop-loss order you’ll avoid risk, protect your principal, and survive the market volatility. It’s like the insurance premium.
    Risk control is the most important. For example, you just learned to ride a motorbike. What you have to know as a must?  You’ll have to know how to control the speed of falling. You’ll be safer.
    But when it comes to stop-loss orders, not every trader is confident where to set this order. Some even avoid thinking about it. Let us explain something. The stock market is a risky one, while you have one winning trade you might have up to ten losing trades. Don’t worry, that’s normal. But you cannot depend on good luck or count on it. What do you need? Skills and capacity to profit consistently. Otherwise, the stock market will dump you out. 

    Why is stop-loss important?

    One of the reasons to use stop-loss is because you trade with limited capital. That’s the rule, no matter if you are the richest trader in the world. Limited capital is required due to the necessity to protect your whole capital from losses. It is possible only if you use a stop-loss order. In other words, you must know what the maximum losses you can take per trade, per day, week, or month. That is trading discipline. You can maintain it only if you set a stop-loss order for each of your trades.

    Moreover, if you consider a stop-loss first, before your entry point, you’ll be able to profit faster and reach your financial goals. In stock trading, you don’t want to hold stock for a long time, and you’ll want to sell them. But if the desired price isn’t reached,  you’ll need to close the losing position as fast as possible and move onto another trade. Of course, you’ll have to compensate for your losing trade elsewhere. That to be said, in stock trading the essential part is to move quickly in and out of the position to profit more. Move your money quickly and with profit, that’s the point. But if you do it randomly you’ll be faced with losses. You have to ensure your trades. How to do that? By using stop-loss first, then you can think about new entries. Also, the bounce backs will be easier in case you have losses. The math can confirm that.

    For example, it is easier for $1000 to fall to $800, but a lot more difficult for $800 to bounce back to $1000. This is a loss of 20%. To compensate for this loss you’ll need about 25% appreciation and come back to the initial capital. But even after a 100% bounce, the stock will be back to its buying price. That’s why you need to use stop-loss orders. If you wait there is a chance for momentum to go more against you.

    What does stop-loss determine 

    In trading, using a stop-loss order is important to overcome the imperfection of indicators. You have to exit a trade if it goes against you. If you’re a buyer, your stop-loss order will be a sell order. Consequently, if you’re a seller your stop-loss order will be a buy order.
    If you’re a buyer, the stop-loss order is a sell order. And vice versa, if you’re a seller, it’s a buy order. For example, if you set your stop-loss order at 3%, you’re actually setting the amount of money you’re prepared to lose per trade.
    Stop-loss relates to indicators, money, or time.  It’s up to you to choose what type of stops you want to use. For instance, you’re buying a stock at $50 because the indicators you use are showing that for this particular stock potential gain could be $100. This means the stock price could reach $150. Your initial stop could be at $25 which is 50% of your initial capital and to get a chance to make $100. Here we come to the risk-reward ratio. In this case, it would be 100:25 which is 4:1. 

    In short, it determines how big a position to take.

    Why to use stop-loss first?

    To avoid the concentration of positions

    As a trader, you’ll run the risk if you extend your exposure excessively. For example, if you keep holding onto positions or average them, then the concentration can occur in your picked stocks.
    For example, you bought a stock at $50 and if it goes down to $45, you might want to average your position. You’ll want that to reduce the cost of holding, for instance. But if the stock price continues to drop, you might be motivated to average your position again. So what could happen? You’ll fall into the loop. You’ll repeat this mistake, and repeat again and again in an attempt to reduce the cost of holding. The better choice would be to use a stop-loss order at the level of the first decline and cut your position. Why would you like to keep a few positions and end up overexposed to their cumulative risks?

    Getting higher leverage  

    In stock, trading leverage is important because it provides you to trade with margin. For example, you put in a margin of $100.000 into your trading account. But you want to trade a stock whose current price is $1.800. So, you could buy about 55 shares. But your broker allows you 4 times more leverage because the company is highly liquid and you now can open positions up to $400.000. Instead of 55 shares, you can buy 220 because it’s the cover order. Let’s assume that the support level for this stock is at $1.750 and you set your stop-loss at $1.700. Let’s calculate your trading risk.

    220 x (1.750 – 1.700) = $11.000

    Since you have a margin of $100.000 in your account, the cover order reduces the risk. Yes, but only if you plan a stop-loss first.

    Advantages of this order

    If you count a stop-loss first, you’ll be able to cut your losses and you’ll be able to protect your trades against bigger losses when the stock price drops sharply. Further, the stop-loss will be automatically triggered if the stock price moves to a certain price. Moreover, you can maintain the risk-reward ratio. For example, you are willing to take a 3% or 5% or 10% risk to get a particular profit. A stop-loss order will help you to achieve that. One of the advantages is that you’ll be able to make trading decisions without emotions and despite the market noise. Also, the stop-loss will help you to execute your trades based on your trading strategy and to stick with it. 

    Disadvantages of using a stop-loss 

    Nothing is 100% sure in the stock trading so even the stop-loss has some drawbacks. For example, you set a limit order and also, you set a stop-loss order, to buy a stock on a particular date. What if your stock opens at a lower price (gap-down) during the pre-opening session? Well, your stop loss will never be triggered. You will end up with losses. Here is a possible scenario. You set a stop-loss at $25, but the stock opens on a gap-down at $23. The stock price didn’t reach your stop-loss so your sell order will not be achieved. 

    Also, a stop-loss can be triggered by short-term fluctuations. For example, the stock price first fell to $24 but then bounced and Increased to $35. But you set the stop-loss at $25 and your holdings will be traded automatically as that price is reached.
    When you calculate where to place a stop-loss order examine what was the range of the historical fluctuation for that stock. For example, you will not place a stop-loss at 3% for the stock with a daily fluctuation of 6%.

    If you want to be a profitable trader, you’ll need to plan every single action. Just like you know the buying price, you must know where to set a stop-loss first and take a profit level. If you don’t do this well, the whole process might end up in big losses. Also, poor stop-loss orders can cause them. The stock trading history is full of both great and ugly stories, so many ups and downs, winning trades and failures.
    Learn stop-loss first, then consider your entry! That’s the whole wisdom.

  • Pure Play Method In Stock Investing

    Pure Play Method In Stock Investing

    Pure Play Method In Stock Investing
    Pure play method represents an approach practiced to estimate the beta coefficient of a company whose stock is not publicly traded. 

    What is a Pure Play method in investing? Have you ever heard about this? How do you estimate the companies when you want to invest your money in different stocks? What tools do you use? Do you make your investment decisions by looking at cash flow, dividends, the strength of the company? What are your criteria? Maybe it is easier for you to estimate the company that produces only one single product. If you do the latter mentioned, you already know what is a Pure Play method in investing. But do you know all Pure Play’s performances and risks?

    Before we explain them to you we’ll explain what is a Pure Play method.

    What is a Pure Play method?

    Investors use this method when estimating the beta coefficient of the company whose stock isn’t publicly traded.  

    A Pure Play company is focused on one type of product. It is different from the companies that are conglomerates, offering many products. Pure Plays are easier for investors to analyze. When investing in Pure Plays you’ll have maximum exposure to a distinct market part.  For example, if you want exposure to car makers stocks you might prefer buying Tesla stock. As compared to Yamaha Motor Co.which is engaged not only in making cars but also in many other industries. This company is producing motorcycles, boats, guitars, outboard motors, etc.

    A Pure Play method is a procedure that investors use to estimate the beta of such a company. But the Pure Play method is also a way to discover the cost of capital for a product or project that is different from the company’s principal business. 

    Many companies are pure plays. They are selling or producing one singular kind of product. So, you can understand that this kind of investing can be very risky because if interest in this particular product or service declines even a bit, such a company will be affected negatively. A Pure Play method is helpful to estimate a project’s beta or the risk of a project. For example, a Pure Play company could use this method to identify publically traded companies that are involved in projects similar to the one they want to develop. 

    Use it to estimate the cost of equity capital of a private company

    This involves examining the beta coefficient.

    When evaluating a private company’s equity beta coefficient, you’ll need a beta coefficient of a public company. The latter you can calculate when regressing the return on public company’s stock on the appropriate stock index. The resulting calculation is then applied to return the beta coefficient of a private company. Here is how to do that. Let’s mark the private company as P and public company as PB.

    In our equitation, we’ll mark debt to equity ratios as DEB and DEPB for the private and public company respectively.

    Unlevered Beta of PB = Equity Beta of PB / (1 + DEPB × (1 − Tax RatePB))

    Equity Beta P = Unlevered Beta of PB × (1 + DEP × (1 − Tax rate))

    Advantages and disadvantages of the Pure Play method 

    The stock of Pure play company is different than stocks of diversified ones. They are popular among investors who want to make a particular trade on particular products. In short, they are not interested in investing in a company that has different business lines. They found reasons to invest in Pure Play stocks and we’ll try to explain them. Firstly, these stocks are easier to analyze. Also, when you have to analyze a company with diversified businesses and several sources of income, you might have a problem evaluating the strength of the company. Its income is generated from many products, with different profit margins, and could be exposed to different growth benchmarks. 

    Further, despite the fact that investing in Pure Plays can be riskier, they can be a great opportunity for very high rewards when doing well. Should we mention Tesla? But wait! Pure Play method in investing has its disadvantages too. These companies are not diversified. What will happen if difficult times appear? When the company is focused on just one product and that one isn’t able to generate revenue, the stock price of such a company will drop, sometimes sharply. These companies don’t have other products to balance the poor production. That’s a great problem for investors.

    The risk of Pure Play method in investing

    First of all, the risk comes from some conditions that may affect the company badly. However, that isn’t the only reason. The additional risk might come from the type of investing style. Here is one example. Let’s assume the growth investors favor some Pure Play company. In periods of the bull market the company will perform well. Even more, its stock could easily outperform the market. But what will happen when the bear market appears? Well, we know that during the bear markets the value investing is a more successful strategy. The consequence is that the Pure Play method will have poor results if growth investors stick with it. 

    These companies depend on one product or one investing strategy. So they are often followed by higher risk. They are completely the opposite of diversified. However, the higher risk gives greater potential for higher profits. When circumstances are in their favor, Pure Play stocks can grow tremendously since the company is focused on a sole product with full strength. 

    Reasons to use it in investing

    We’ve been writing so many times about the importance of diversification in investing. Also, we pointed out that investing in a single company isn’t always the smartest idea. But when it comes to the Pure Play method in investing, things are a bit different. 

    There are really a few good reasons to invest in pure plays. Pure Play company is considerably easier to analyze. You have, as an investor, only one type of product or business line to analyze. Moreover, it is easier to understand the cash flow and revenue of one company than it is a case with several. Further, you can with a better result predict how it will perform in the future. 

    Pure play can be a very attractive investment. These companies work a strictly defined niche market. They are specialized for a particular one. That is a quality per se and could be extremely beneficial for investors. 

    Bottom line

    Pure play is a method used in stock trading and investing. It is all about companies with a focus on a specialized and particular product or service. The “Pure Play method” is also helpful when estimating a project’s beta, or the risk of a project.

  • Online Tools for Stock Trading and Investing

    Online Tools for Stock Trading and Investing

    Online Tools for Stock Trading and Investing
    If you are risk-averse but want to become a successful trader and investor choose online tools for trading as an aid to reach your goals.

    Online tools for stock trading and investing must tell you the information needed to make a successful trade and provide you advanced research to boost your profit. By using online tools for trading and investing in the stock market, or any other market can streamline the whole process, from choosing a stock to exit with profit. For example, when the ups and downs, even small changes, in the market are present you’ll need a tool to time them. Some of these online tools for stock trading can be very useful, valuable, and profitable for beginners. 

    What online tools for stock trading to add to your trading toolbox?

    The most powerful tool is your knowledge of technical and fundamental analysis, that’s the truth. But some advanced technology can aid your trading. These online tools for stock trading are extremely important in your decision-making process, in buying and selling stocks. The technical analysis will show you the price trends of stock. So, you’ll need it to know to recognize trends for the particular stock to be able to decide will you buy it or not. But technical analysis isn’t enough. You’ll need more tools for stock trading.

    You’ll need fundamental analysis. This tool will help you to evaluate the company’s strength to grow further. This information is also very important before you make any decision on whether to buy or sell the stock.

    The importance of online tools for stock trading

    In fundamental analysis, tools for stock screening are a good starting point. When you pick the stocks and add them to your investment portfolio, you’ll need tools to track them and manage your portfolio.

    Tools for stock screening 

    Stock screening tools can identify companies according to your investment goals. They can provide you information about the company, industry, market capitalization. Stock screeners allow you a fast search for a stock based on the rules you’ve set. Almost all trading platforms have screeners. But you would like some with in-depth screening capacities that will help you to really recognize all trade opportunities. Also, you’ll need charts, market maps, and quotes. Moreover, by using them you’ll be able to examine revenue growth, valuation ratio, and many other ratios. 

    Portfolio tools

    For example, portfolio tools. They will allow you to maintain the balance in your portfolio. Let’s say, the small-capitalization stock has a strong run. What is the role of the portfolio tool here? It will allow you to cut that stock and allocate your funds to other assets.
    For technical analysis, the most important is to use interactive and advanced charting tools. If you use charts as one of the online tools for stock trading you can easily set trendlines and moving averages to determine the wanted pricing pattern. 

    Charting is essential for traders that use technical analysis. It gives them a possibility to evaluate past movements and to predict future performance by recognizing the patterns. When you can dig deep into the history of some stock, you’ll be able to understand when and why the stock was volatile, what forces them to move in a particular way. Some online brokers offer charting. When you do so you’ll be able to decide to buy or sell stock in an easy and trustworthy way.

    Take advantage of stock trading technology

    If you don’t use them, you are missing out maybe the best trade in your entire life. Everyone would like to boost returns. Some strong trading platforms could help you. Find a broker with a robust platform. Well, there can be some disadvantages. For example, brokers with superior trading platforms will charge you higher trading commissions. Maybe they will limit the number of trades, or demand the minimum number of your trades. Even more, some will require a minimum account balance to give you access to the platform.

    Traders-Paradise fully recommends TD Ameritrade. Read more HERE.

    Tools for idea generation

    You might have different ways to come up with trade ideas. But you can also subscribe to some online services. In this way, you’ll have market updates in real-time, which is extremely important. This kind of service will provide you previews to initial public offerings, reports about rising growth stocks, stock trends.

    Online tools for stock trading cover financial statements, company news, and reports that are written by experts. When you use them, you ‘ll have a precise idea of how the company is doing. Maybe you get some new trading ideas. The more analysis is available, the better.

    The other online tools for stock trading

    Choosing the right online tools for stock trading isn’t an easy task. You have to know what you want to get. Also, an important point is to recognize what you are not scared to lose. 

    But remember, not one tool will help you make an investment decision. Some online tools you should use to analyze your investments. For example, if you want to evaluate stock use assets valuation, discounted cash flow, P/E ratio, or EV/EBITDA (enterprise multiple) to determine the value of the company. Also, debt to equity, current ratios, and quick ratio are important tools. The next group of online tools for stock trading could be sales turnover, returns on equity and on capital, and assets turnover. All of them you can find also online. 

    Bottom line

    These are some of the online tools for stock trading used for estimating the position of the company. But there are some tricky parts. Even if the company shows great results in all criteria you apply, you still don’t have to invest in it. You’ll need more, let’s say, tools. That’s your ability, your sense, your guts, feelings. Someone said that trading is more an art, not a science. If you aren’t an artist in the trading, you’ll end up with the poor results from your trades. Relying on online tools only can be wrong, almost the same if you never use them. 

    We don’t want to say you’ll need an esoteric, spiritual knowledge, but you have to feel the spirit of trading. You must have it in your bones to be really successful. Otherwise, you’ll be one in a crowd. But you would like to be exceptional. Remember, trading or investing doesn’t lie in an Excel sheet or trading platform. It lies in your heart, lives in your mindset, survives in your mind. Don’t get us wrong, results, numbers, all that math, algos are important. But you must feel trading. You have to live it.

  • Trading Mistakes and How to Avoid Them

    Trading Mistakes and How to Avoid Them

    Trading Mistakes and How to Avoid Them
    If you have losing trades it is possible you have too many trading mistakes. Recognizing mistakes is half of the battle. The other half is how to avoid them. 

    Trading mistakes are common both for traders and investors, for the novice and experienced traders. Even though traders and investors practice different styles of trading, they often make the same trading mistakes. Some of the mistakes are more costly for investors, some for traders. For both kinds of market participants, it is essential to understand these common trading mistakes and avoid them. Think about bad trades as a process of learning and after you collect a significant number of them you’ll be more experienced and able to perform better trades. But this process can be shorter if you have an upfront understanding of where trading mistakes could arise. 

    That could give you a chance to react correctly and quickly enough to protect your investment portfolio. 

    Here are some trading mistakes that happen to both experienced and novice traders. These suggestions could help you to recognize them and give you a chance to avoid or correct them. So you should be able to gather the profits!

    Trading mistakes that traders shouldn’t do when trading

    Never risk a huge amount of your capital or going all-in. We all have a great expectation to earn a huge amount of money but one of the trading mistakes is putting all capital into a single trade and expect that could provide you great profits. How is that possible if every single trader, when asked, knows about the 1% rule. That means you should never put more than 1% of your capital into one trade. This is one of the common trading mistakes because traders constantly try to gain it all back. Mostly without a risk management trading plan. But even if you have a trading plan, sometimes you’ll be pushed to ignore it. You could be motivated to take a large trade which usually you wouldn’t. Don’t do that, try to resist. Stay stick to your risk management trading plan. The temptation can be a very bad companion in stock trading.

    Even if you think you are ready for a big portion in a single trade. Trust us, you don’t want to jump into the deep end. Especially if you are not skilled enough. Going all-in may cause unpredictable damages, financial and emotional, so great that you may decide to give up the stock trading forever. 

    The much better approach is to trade gradually at regular intervals and slowly increasing the amount per trade. In this kind of approach, you have two benefits: you won’t put all investment capital at risk and you’ll remove emotions when deciding when to buy a stock. 

    Not having a trading plan is a great mistake in trading stocks

    Among trading mistakes, this particular is maybe the most dangerous. If you don’t have a trading plan how will you know when to enter the trade or exit the trade. Skilled traders get into a trade with an outlined plan. They know their precise entry and exit points, how much capital to invest in the single trade, and what is the highest loss they want to take.

    Novice traders usually don’t have a trading plan before they start trading. Even if they have a trading plan, beginners could be more apt to turn out of the plan and take more risks and reverse the course totally.

    For example, they enter the trade with the belief that the stock price will rise shortly after they enter the position. That isn’t going to happen! But this fact is known to experienced traders, beginners don’t know that. And what happens the next is the trade is going against them. But most of them will not exit the position, they will hold in the hope that the price will go up. And the price continues to fall more and more but they don’t want to sell the stock, they don’t want to take the loss and end up losing everything. That is one of the most dangerous trading mistakes. 

    Further, even if they found a great entry point and the price starts to rise. Honestly, it could be a matter of luck, not knowledge. What do beginners do? They become greedy. Instead of selling stock and taking a profit, they hold the position. Very soon, the trade turns against them, and a winning trade shifts into a losing trade.

    Shorting stocks too early 

    If you short the stock too early it is more likely you’ll be destroyed on your shorts. Everything that flew always landed. This is especially true of stock trading and pumps and dumps. 

    For example, you notice a stock in the early stage of a pump. You are happy to buy and drive along as it increases. But at some point, it starts to drop, and you may profit by selling short. But when is that moment? When you have to go short? The timing is extremely important. What if you sell too soon? How to recognize that exact moment for short selling? First, you have to find the top on the stock. That means you have to recognize the resistance level. That is the point where buyers are leaving, but also the point where the sellers appear and begin to take over the stock.

    Short selling is dangerous anyway and only experienced trades should use it. If you practice this strategy or want to, be careful. Without proper knowledge and experience, you’ll jump into one of the biggest trading mistakes.

    Use stop-loss orders to avoid trading mistakes

    Cutting losses is a very serious issue. If you don’t cut your losses quickly you could lose everything. This mistake apparently takes most of the money. Avoiding to admit that we’re sometimes wrong, we are actually admitting we’re human beings. Nothing is wrong with that. People are doing that all the time. Sometimes it can be good. But not in trading stocks. 

    The main problem with trading and you cannot find many people that would like to admit that, is that there is no possibility to be correct on your trades 100%. The best traders are correct under 80%. How do they manage to not blow up their accounts? Simply, they know when they are wrong, they recognize that and admit that. When wrong trade occurs just get out fast. Why will you wait? To make more losses? No one would like that. Just admit you are wrong and exit the trade while you still have a chance to reduce losses. 

    But you must decide about your risk before you enter a trade. You have to know your risk to reward ratio and how much you are comfortable to risk.

    When you identify what you’re ready to risk, enter the trade. But that is not the end. 

    Set a stop-loss order 

    You have to set the stop loss. For some traders, it sounds unnatural to enter the winning trade and promptly set stop-loss order. We have one question for them. Is it natural to lose all capital invested? And, yes, there is a possibility to lose everything without setting a stop loss. In this way, you’ll avoid making huge losses to your account. 

    Never neglect stop-loss orders. That will prevent you from extreme losses and lock in profit when you have winners. You have to set a stop loss for every single trade.

    You might think you don’t need this order while you are sitting in front of your computer all the time. But you don’t have that single one trade to monitor, sooner or later you’ll have more of them. It’s almost impossible to monitor several trades at the same time. Changes are speedy and it could happen that you don’t notice the stock is losing support. In that situation, everyone would like to get out as fast as possible. The stock price could fall a lot faster than you are able to set your sell order in. And what did happen? All your profits are wiped in a second. By setting stop-loss orders at the moment when the trade is filled. 

    Bottom line

    Trading stocks is not an easy job. It takes discipline, time, and knowledge. Some traders can’t handle it and gave up. Also, there is one thing you must know before entering this marvelous world, the most important part of trading is preparation to execute it.

    You cannot find a lot of people out there to help you figure out what trading mistakes to avoid. We pointed several but there is much more. To be prepared to avoid them, you have to learn and not be greedy. 

    As we said, trading isn’t easy but can be very profitable if performed properly. It’s okay to be wrong from time to time, but if you are wrong all the time you’ll never become a successful trader. Just admit your trading mistakes, examine what went wrong, and continue with success. While trading, your emotions must be under control. Okay, some level of fear is favorable, it can protect you from meaningless and harmful moves. But you have to be honest with yourselves and admit when you made mistakes. To remember them better, write it down in the trading journal. That will make things easier in the future.