Trading a small account is a great way to learn. Increasing a small account isn’t an overnight process. Don’t rush the process and don’t have unrealistic expectations. That will slow down your account increase.
By Guy Avtalyon
Trading a small account is possible. Can you be successful in that? Of course, but you have to understand some rules. Anyway, since trading is one of the most difficult efforts and most complex endeavors to earn money you have to know something. If some enthusiastic guru tells you don’t need capital for trading. Such a liar! You’ll need capital. But we’ll discuss how much is it?
Trading a small account is good to start and after you see some progress you can continue with a larger amount of money. While you are trading a small account it is smart to think about that as a side-job. Don’t quit your primary job yet. Trading a small account will not give you a chance to live from it immediately. This is especially true for new traders.
Some traders will tell you that small trading accounts can’t be traded successfully. This is a lie. Trading a small account can be tricky but if it is traded properly it can be very profitable. The point is that trading a small account isn’t a waste of time. It is contrary.
What to expect from trading a small account?
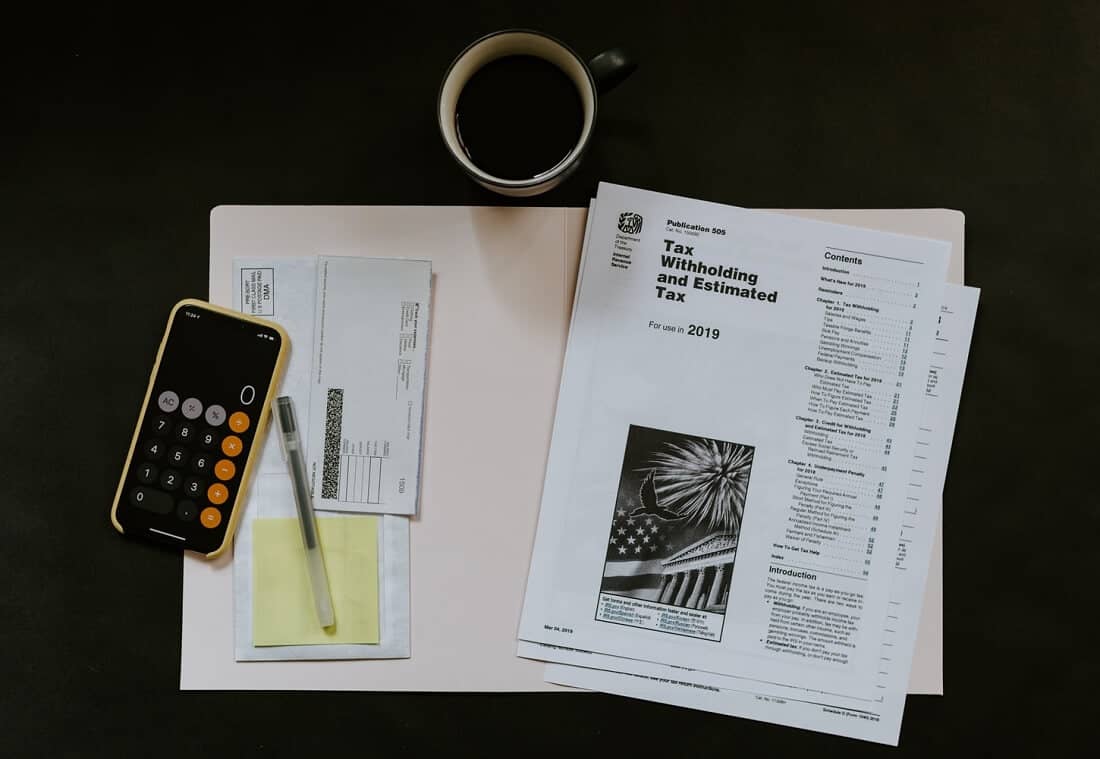
When you start to learn trading stocks or any other asset be prepared to spend months without making money. You will make a lot of trading mistakes along the learning trajectory. Your mistakes can be costly. If you start with a $1.000 trading account your mistakes will disturb you less. Of course, the pain will be greater if you start with a $10.000 trading account and you make some mistakes. It can be a total disaster. So, to avoid the emotional and financial blows here are some rules you have to follow. We suppose you already end up with your demo account and it’s time to start trading live.
But trading with paper money and real trading is very different.
First, don’t think about money, think about your strategy. Can you execute it and when? Do you have proper entry and exit levels? What is the level where you will take profit?
Why did we say you shouldn’t think about money? The point in trading a small account is to make it bigger. The aim is to grow it into bigger but without putting in risk a big part of the account. The same is if you are a beginner with a bigger account, for example, you have $40.000. Still, it is smart to start with smaller and as time goes by, add more assets but only when you have progress.
Is trading a small account easy?
To be honest, it isn’t. Trading a small account can be complex. Sounds like nonsense, right? Actually, it isn’t nonsense, and here is why. When trading a small account you have less protection, less than when trading a large account. The large account has protection against losses, mistakes, it is adjusted for them with numerous buffers. A small account hasn’t such protection. If you have a large account you can trade any market. With a small trading account, you can trade the market with small values and low margin. The large account gives you an opportunity to have many contracts, but the small account is bounded by strategies able to use.
So, the pressure can be great when you know you can afford just one losing trade. If you have more than one losing trade your account may become untradeable because you will not be able to cover the margin. So, you see, even before you start to trade, even before you even enter the position, you are under pressure. If you know how to handle it, you don’t have such an issue. Just remember, even the most experienced traders have bad trades from time to time. Sometimes you can do nothing to avoid bad trade.
Tips for trading a small account successfully
Okay, we warned you of the disadvantages. But don’t think it isn’t possible to trade a small account. Of course, it is, even more, it is possible to be profitable. Even professional traders trade small accounts and they are very successful and profitable. Even the undercapitalized account can provide you a nice gain.
How is that possible?
As MUST, you have to use leverage to increase the size of your trade. By using leverage you’ll have the opportunity to trade markets which you wouldn’t be able to trade by using cash. Let’s explain this in more detail. To be able to trade individual stocks, you need about 25% or even 30% in cash of the trade’s value. But if you trade the options of the same underlying stock, you will need around 15% in cash. Moreover, by using leverage you’ll reduce the margin requirements for the trade.
In trading with a small account, you need to be more careful. So you have to be sure that its risk-to-reward ratio and its win-to-loss ratio are properly calculated.
There is one more tip. Stick to the one-percent risk rule. That means you’ll trade with the same buffer as traders with large accounts. This one-percent rule appears as a powerful risk management method. You wouldn’t believe how many professional traders use this rule.
Have a strategy
It’s important to have a strategy when trading no matter if your trading account is small or large. But beginners frequently don’t have the strategy so they have nothing to follow, though. We said that numerous times, but we’ll repeat again and again: you MUST have a trading strategy and follow it. When trading, you must know what you are doing and why. You cannot place your trade randomly. It is insane! You have to understand that your hard-earned money is at play, which means, there will be some consequences in the future. Good or bad, it’s up to you. If you have a trading strategy the chances for a good future are better.
The other benefit of using a trading strategy is the possibility to test it before you shift to a larger account.
Trading a small account gives you a chance to estimate your risk tolerance. Also, it will give you a chance to develop your edge and hone your strategy. That is the goal of small accounts, you are not trying to sink a three-pointer.
The final step
After you have made steady progress for several months, it’s time to increase your position size. But you have to do that slowly. Don’t just jump from $50 risk per trade to $1.000 risk per trade. If your risk per trade was $50 go to $75 or $100. Never force your position-size because it may lead you to emotional trading, and trust us, you would like to avoid it. Emotional trading can destroy all your hard work.
Experienced traders would tell you to avoid setting daily profit goals and they are right. In trading, you cannot control opportunities. One day you’ll have a lot of them, but the other day can be none. So, don’t even try to earn some specific amount of money each day. Be focused on weekly or even better on monthly gains.
So, don’t overtrade. Your goal with your small trading account is to grow it into a bigger one. It is impossible if you don’t have profits. You have to increase the amount you can afford as a risk per trade. Only that will give you a chance to increase the profit you make per trade. Also, in this way, your account will grow faster and finally provide you to live from trade. But you must set realistic expectations.
When to switch from a small account to a large account?
While trading with a small account you learn how trading seems by using real money. Yes, the principle is the same, but the feeling is different. Hence, it is very important to start with trading a small account before entering the wild but wonderful world of the stock market. You will get a sense of trading, maybe a bit slower but precisely. You’ll be able to read charts, recognize the patterns, catch the trends, and moreover, you will know what and when to do something. Also, you’ll learn how to manage the risk and your trades will be more profitable.