
Forex market is like any other market where instead of stocks or bonds people trade currencies and make money.
Trading in Forex is popular low capital trading but you have to know how to make money with Forex. The truth is that you don’t need a huge capital to get started. Also, the Forex market is available 24 hours during working days, but you can’t trade over weekends. Maybe the most common truth about every single person that enters the Forex market is that they are excited, eager to earn a lot, and fast, but only a few of them know how to make money with Forex.
How beginners in forex trading look like?
They are excited by the possibility of quick money earning and becoming rich. Beginners will easily sign up on some platforms without doing the necessary research. They are entering a position like gambling putting money somewhere and somehow, random, without a strategy. Even more, they don’t know how to place a trade, when to enter the position, where to set stop-loss orders or limits, or take profit. Actually they know nothing. And what happens? After several days when everything invested is lost, they will conclude the Forex is fraud and it is impossible to make money there. For them it is completely the truth. With this approach, they will never earn because they don’t know how to make money with Forex.
The other side of the Forex rainbow
Beginners could see successful Forex traders. But they are using tested and well-checked strategies. The strategies that they have developed or discovered thanks to a lot of trials and errors made for a long time. Yes, that’s the way! You’ll have to make many trials and mistakes to understand forex trading and understand how to make money with Forex.
Forex traders have a unique trading style, a unique system, and their own strategy. But they came up to them after deep research, hundreds of attempts, losing a lot of money before they found a profitable strategy that works for them and became successful traders. Well, we are sure that the most successful traders will never talk about their failures but now and then you can find someone ready to share that unpleasant experience. On the other hand, you’ll find a lot of them sharing their great stories about winning trades. Learn from them. Only the knowledge will allow you to make the proper strategy, consistent profits on it every single day. That is possible, of course. But you have to learn how to make money with Forex. And here are some hints.
How to make money with Forex?
If you are a complete beginner without knowledge but willing to start Forex trading and make money from it, the first thing you have to do is to read reputable books. Sorry folks, but knowledge is MUST. The point with reading books is that you’ll obtain theoretical knowledge. It is extremely important to understand the financial markets, otherwise, you’re not able to trade them especially if you want to stay there for the long run.
Good places for sharing knowledge are social networks. Join as many groups as you can and start the conversation. Don’t be shy to ask whatever you need to get better knowledge. Professional traders are also members of such groups and often, they’ll be glad to answer you. Also, interact with other rookies and share your knowledge but dilemmas also. Ask elite traders about the effects of leverage. That could be a very interesting conversation where you could find that trading with excessive leverage could be dangerous. You don’t believe it? Well, using leverage is good but if you use excessive leverage in your trading strategy that can end up as a failure. Using excessive leverage might mean that you are not realistic in expected returns on your investments.
What is leverage in Forex trading, in the first place?
In general, leverage enables you to increase the result of your trading efforts but without developing your resources. Leverage in Forex will simply boost your account while you actually don’t have that money. You are borrowing it to trade with even 1.000 times greater amount than your capital is. That is giving you access to the larger volumes than it is possible with your initial capital.
We are sure that you noticed banners on the trading websites that offer trading with 500:1 leverage. Well, it’s time to explain this in more detail. As we said, leverage is a kind of loan that a broker gives you. You use leverage in margin trading. And here we come to an important point. But leverage isn’t quite a loan even if it is one of the highest that traders can take.
This thing goes right this way
When you enter the forex market, the first thing you have to do is to open a margin account with your broker. Depending on the broker, the amount of leverage can be 20:1, 50:1, 200:1, 500:1 even more. Also, the amount of leverage will depend on your position size. For example, a 100:1 leverage ratio indicates that you have to deposit on your margin account, let’s say, $1.000 to be able to trade $100.000 of currency. These 100:1 leverage or 50:1 are for the standard lot size. If your position is at $50,000 or less the leverage would usually be 200:1.
But compare these leverages with, for example, the 15:1 leverage in the futures market. Well, you might think this forex leverage is too risky. Keep in mind that currency values normally switch by less than 1% within one-day trading. So, this huge leverage is possible because of small changes in the prices of currencies. If currencies are changing more in price, the broker would never give you that much leverage.
More math on how does Forex leverage work
Assume you have a small account with $1.000. A standard lot is 100.000 currency units. If you want to trade mini or micro-lots, this deposit size would allow you to open micro-lots. That is 0.01 of a single lot or 1.000 currency units with no leverage set in place. Nevertheless, you’re looking for a 2% return per trade, which is $20.
So, you decide to employ financial leverage to trade big. Your broker is giving you a leverage 200:1. This means you can open a position as large as 2 lots. To make the long story shorter, let’s do some math.
$1.000 x 200 leverage = $200.000
This equitation shows that you actually have a maximum size position of $200.000. That is 200 times the size of your deposit. So, instead of earning $1, you’ll earn $200. Also, you can lose even faster.
Let’s follow our example, and assume you opened an order with a 1.00 lot. What will happen if the market goes against you? You will have minus 100 pips and lose $1000. Your order will be automatically closed. So, you will lose only your total deposit but you’ll not have money to continue. That’s why it is better to trade a smaller position to reduce the risks.
Use a stop-loss order to reduce risk
This one is probably most important. You can find hundreds of Forex courses on the internet that promise you a strategy that will show you how to make money with Forex every day. A lot of them are scammers, trust us. They just want your money for the low-quality courses. The better way is to start with some simple and easy strategy. It’s not hard to build a suitable strategy.
For example, you notice that the EUR/USD currency pair will rebound from a current support or resistance level. Your first strategy should be to take the benefit of this trend. Later, you can adjust this first strategy by adding some details that will improve efficiency. For example, set a stop-loss when the price goes down to a particular percentage or number of pips to exit the position.
Here is what you have to look out when creating a Forex trading strategy.
Firstly, choose the currency pair. Pick it from the market you know, for instance, avoid currencies from exotic countries if you don’t know them well. If you trade only one currency pair you’ll have better chances to recognize trading signals. Also, your position size will determine the risk you are willing to take in every single position.
Further, find when to set your entry, will you go short or long. Never forget to set the exit level. You must know when to exit the position to maximize your profit and minimize potential losses.
Find when and how to buy or sell your currency pair.
Can you become rich with forex trading?
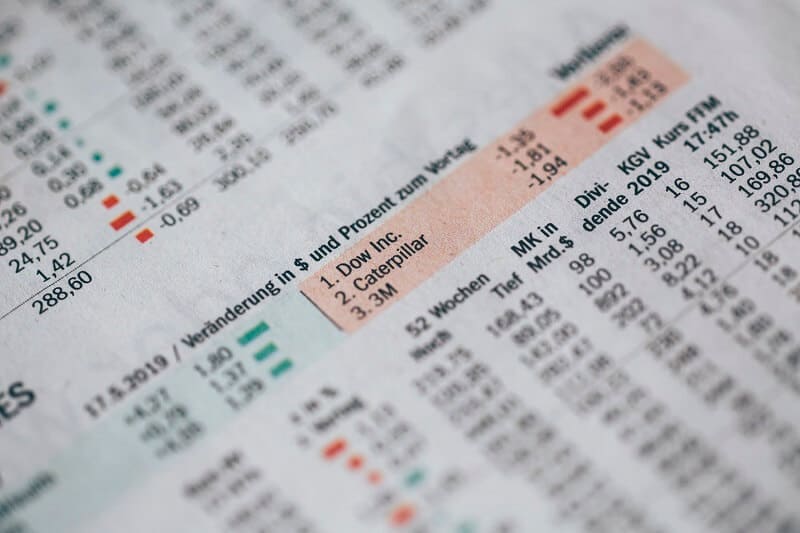
Some will tell you that it is impossible. And they would be right. The others will tell of course, and they would be right, also. The truth is that the Forex market may give you a chance to earn a lot. This market is much bigger than the stock market, for example. Also, it offers the highest leverage possible in any market. Also, you can trade every day. In essence, the Forex market is a place where small investors with small capital have a real chance to make fortune.
Trading forex is easy, but trading it with constant profit is difficult.
Opposite to what you’ve heard or read Forex trading will not turn your $1.000 account into $1 million. The amount you can earn is determined by how much risk you want to take. If you want to know how to make money with Forex, start with education. Sorry guys, it is necessary. When you learn the basics you can develop your skills further and you’ll start to make money for living by trading forex.
There are traders that are targeting even 100% profit per month. Yes, but the risk they are taking on is almost the same as the profit they are aiming for. In short, if you want to make a 100% profit per year, it’s possible to have a loss of 100% per year. Even if you are trading with an edge your profits will be small without leverage. On the other hand, with leverage, you can profit a lot, but you can produce extreme losses. The main point in forex trading is to buy a currency pair at a lower price and sell it at a higher price. The difference between is your profit.
For example, you have $1000 on your trading account and want to trade the EUR/USD pair with the exchange rate at 1.25. That means that for 1 euro you’ll take $1.25. Keep in mind that the prices are changing every day, from minute to minute. But you believe that EUR will increase versus the dollar.
Let’s assume, you buy 800 euros for your $1000. And the exchange rate changed from 1.25 to 1.35. That’s good for you, and you close the trade at this level and you can exchange your 800 EUR back to $1.080, and your profit is $80. But, if you used the leverage of 1:3000 you would get $24.000 in one single trade. So, you invest $1000 and trade $3.000 000! Pretty good!
Always keep in mind, if you want the higher profits you’ll have to take the higher risks.
Bottom line
One thing is completely true. If you never try you’ll never know how to make money with Forex. With an account with just $1.000 and leverage of 1:100, it is possible to make a lot of money in a single trade. All you have to do is to have at least 1% of the trade on your margin account to use this leverage which is one of the most profitable. That is how to make money with Forex.