Author: Editor

  • Stocks Reached New Records in the First Five Days This Year

    Stocks Reached New Records in the First Five Days This Year

    Stocks Reached New Records in the First Five Days - January Effect
    Stocks rose in the first five trading days in January. There is an old tale of the January Effect but is that true or myth?

    Stocks reached new records in the first five days of this year. And when stocks play well in the first several sessions in some years like it is in this one, investors like to recall the “first five days” rule. The point is that this rule is, therefore, able to predict the market is often up at year-end. But is this true?

    Stock Trader’s Almanac, which analyzes the market phenomenon since 1950, discovered that if the first five days have a good track record it is a good prediction for the whole year meaning it will be well in the stock market.

    Actually, it is an old Wall Street “first five days in January” indicator and as we know the brokers are superstitious. They believe if the stock market during the first 5 days of the year reaches record, that represents the potential for the strong performance in the given year.
    So, stocks are sending a bullish signal for this year, according to that old indicator. Well, it is a good way of pumping stocks. Bulls in the market do that.

    Will the whole year be like this?

    But is this a reasonable way to make predictions for the whole year? We think it is an absurd way to estimate valuations.
    Yes, stocks reached new records but if you take a serious look at the indicator you will find some drawbacks. Frankly, stocks are overvalued more than ever.

    The stocks reached new records

    Yes, in the first five days in 2020 but few days will last forever and maybe it’s time to consult the historical data just to compare what could happen next.

    According to Dow Jones, historical data shows that the S&P 500 index has completed the year in the same trend as it started it in 82% of presidential-election years. It occurred from 1950 to today every time. In the first 5 days of 2020, the S&P 500 rose 0.7% and if the mentioned historical pattern is correct that should suggest that this year will finish with higher gains.

    But be serious. We will need a deeper look at this indicator and on what it shows. Otherwise, you can easily read your horoscope (pay attention to the “sex” section better than “finance”) it will make more sense.

    The ‘first five days of January’ indicator

    January in the stock market has a strong influence on predicting the trend of the stock market for the rest of the year. The January Effect occurs when investors’ selling off their losing positions at the end of the prior year to realize the tax losses. Usually, these stocks are at a discount during January. And what we have there? Bargain hunters! They step in with their buying pressure in the market.

    Statistics show when the S&P 500 rise in the first five trading days, there is around 86% possibility that the stock market will rise in that year. But this indicator isn’t very reliable due to the fact that we cannot find what happens when the gains in the first 5 days in January are below expected or in comparison to previous January or whatever. All we have is data for periods when the January Effect is triggered. But markets exist even without the January Effect. Even more, the markets exist even beyond January. 

    With a little help of stats, we can see that this effect had good predictions in 31 out of the past 36 years. Stocks reached new records in the first five days of 5 exceptions, 4 were war years and one was a flat market.

    So, this was a confirmation of the January Effect.

    Statistical answer as confirmation of something different

    Let’s use more current data and divide the past 34 years into two sections separated, from 1984 to 2000 and from 2001 to 2017. 

    Let’s observe the period from 2001 to 2017. Data shows that, for example, the December effect produced an average return of 2.62% or a return of 36.5% during the observed years. But if you take a look at January for the same period, you will find poorer results. The average returns in that month were at 2.48% or 34% pre the whole year.

    This seems to be a strong approval for the January effect. Nevertheless, whoever tried to use the January effect, and bought an S&P 500 index fund on January 1 and sold it on January 31, and kept cash for the rest of the year and did it in the next years to the end of 2017 made losses of 0.84% per year.

    Stocks reached new records but ignore the January effect.

    The using the January effect can be dangerous. This phenomenon is based on limited data and adjustments for confirmation. So, you shouldn’t believe that every time when the stocks reached new records in the first five days of the year were great gains in the market.

    The conclusion about the January Effect came from small samples. So, it has low statistical reliability if it has at all. You cannot make a conclusion based on limited data. Yes, some financial press reports will try to assure you how these “five days effect” is important and you will find a lot of catchy titles but it’s fishing and fake news also.

    Even the month of January was great for the stocks, what about the other months? If it is the only one-month effect what are you going to do with your investment over the rest of 11 months? Would you make decisions based on superstitions? Cash-out? We don’t think it is a smart investment strategy. 

    Common sense tells us something different. This isn’t a hypothetical situation, this is reality. Try to figure out why this phenomenon isn’t part of any extremely advanced computer software? Some software, and even not so sophisticated, will be able to identify the phenomenon and profit on it. 

    The reason is obvious. There is no unusual market’s phenomenons, that’s nonsense. If there is any phenomenon that is simple to be explained to the inexperienced trader or investor you can be sure it isn’t real. It is superstition.

    Bottom line

    This was another old tale to neglect, just like many others. Who can really believe that the first 5 trading days in January could predict the stock market’s direction for the full year? Yes, this old “indicator” gets much attention every year. As we said, the bulls are trumpeting it right now.

    But nothing is that easy, especially the stock market.

    If you have a problem to accept all of this, examine what did happen over the last 40 years. You will find that this pattern was a reversal. The fact is, since the 1970s every time when the Dow was down during that mythical period of 5 days in January, the whole year had higher gains. 

    To be said, any investor who admits the extraordinary influence of this superstition has a lack of knowledge and self-confidence. On the other hand, newspapers and financial reports enjoy cheating people when insisting on this.

    We would like to point one thing at the end. The words written above doesn’t mean the stock market will not rise this year. It can do it very well and produce great gains, but what does it have with “First Five Days of January”?

    Nothing!

  • Leveraged ETFs – How to Trade, Guide, Tips and Strategies

    Leveraged ETFs – How to Trade, Guide, Tips and Strategies

    (Updated October 2021)

    Leveraged ETFs - How to Trade, Guide, Tips and Strategies
    Two times leveraged ETF is a vehicle calibrated to 200% or double the gain or loss of the price movement

    Did you come across something called a leveraged ETFs?  What is leveraged ETF and how it is different from other ETFs? We found a lot of questions like these thanks to visitors to our website. We’ll try to make this closer to you especially if you are a beginner in this field. 

    Let’s take time to jump in and explore these somewhat new securities.

    Firstly, leveraged ETFs aren’t for long-term investors.

    When you are buying a leveraged ETF, you must know that you have to make short-term trade. As we said, it isn’t a long-term investment. For newbies, a short-term trade lasts from one day to several weeks, not longer. Don’t try to buy a leveraged ETF for a long-term investment. 

    They became one of the most successful varieties of ETFs in recent times. So, we can easily say that leveraged ETFs are a novelty. However, they can be difficult innovation. Well, they are not either good or harmful, all you need is to know them better to be able to trade. Here are some basics about leveraged ETFs.

    Let’s say the traditional ETF tracks one security in its underlying index, 1:1. As a difference, with leveraged ETF, you can strive for a 2:1 or even 3:1 ratio. A leveraged ETFs use financial derivatives to magnify the returns of an underlying index. 

    Leveraged ETFs are possible for the Nasdaq 100 and the Dow Jones Industrial Average, for example.

    Where is the advantage?

    Leveraged ETFs can help you to capitalize on the short-term momentum of a particular ETF. The main question is how to add leveraged ETFs into your portfolio?

    For example, the trader is assured that a particular stock will drop. And trader is shorting that stock. Besides, shorting stocks are bought on margin and the trader has to borrow the money from the broker. That is leverage.

    With leveraged ETF, you don’t need to buy the securities on margin, since it allows you to amplify your returns by multiples of over 1 up to 2 or 3 times. That depends on the ETF product you are trading. The amount of leverage will depend on your experience or temperament. Some less-experienced traders will choose lesser leverage, for example.

    But be aware, they are designed to return three times the inverse of the S&P 500 index. So, if the S&P 500 drops by 1%, this fund should rise by approximately 3%. And contrary, if the index rises by 1%, this fund should drop by about 3%.

    Leveraged ETFs have the aim to outperform the index or stock they track. 

    Also, there are inverse leveraged ETFs. They give multiple positive returns if some index decreases in value. They operate the same as normal inverse ETFs but designed for multiple returns.

    Leveraged ETFs are not suitable for beginner’s portfolio

    Please, don’t make a mistake. Yes, it is fascinating to have amplified returns but you should never add leveraged ETFs into your long-term portfolio. By buying them as a long-term investment you are making a foolish decision. To repeat, leveraged ETFs are not investments, they are speculation. Don’t mislead yourself.

    Moreover, the payoff may not be as bright as you predict. So, they are risky. You will have to pay management fees, brokerage commissions, taxes on capital gains. 

    Leveraged ETF surely has its purpose for short-term investing. For example, you can use it as a hedge to protect a short position. Yet, long-term investors should be careful with leveraged ETFs.

    Definitely, when things are going fabulous, leveraged ETFs are excellent investments. Over the first 6 months in 2017, the S&P 500 has returned a bit over 10% but the 3 times amplified leveraged ETF has returned approximately 30%.

    But, think about what happens when the market turns down. For example, the S&P 500 falls by 10%. A leveraged ETF tracking the index could fall by approximately 30%. Just think about these figures.

    How to make success in trading leveraged ETFs

    As experts recommended, start with small if you aren’t experienced enough. When your portfolio becomes larger add more shares. There will be more risks, of course. But you will diversify your trades. Some elite traders recommend starting with an account of $25.000 minimum. Less isn’t recommended due to trading ability and margin rules for smaller accounts. Moreover, a smaller amount may cause conflicts in your decisions. You’ll need space to make them. 

    Further, trade when the sentiment is low. It is the best opportunity to profit. Set a stop-loss to, let’s say, minus 2% or 2.5%. Follow the trend and enter the winning position. If your profit goes up, sell some of your winning positions. Do it on spikes. If you reach 2% of profit very quickly, sell half of your shares to move stops up to breakeven. This can be a no-lose trade.

    Read a lot about ETFs and leveraged ETFs and test some free trials to find the accurate one. Do your own homework, it is the best way.

    Always monitor leveraged ETFs on a daily basis. If you have to use a limit order on a position it is reasonable to sell your position since you can’t follow market makers strictly. If you want to turn trade, it is better to trade traditional ETFs. that will give you less profit, but more freedom. For leveraged ETFs, you will need to sit and look at the screen or phone almost all day long. Trading isn’t for everyone, at all. That job can be addictive. Take a break from time to time but don’t give up. If you made some mistakes, keep in mind why, when, what caused them. And learn how to avoid them.

    And buy when the ETFs are positive.

    Disagreements

    The leveraged ETFs are new and still developing, and the disagreements will change as time goes by.

    Yes, they will provide you 2 times bigger returns but not always.

    The typical fault is that leveraged returns are on a yearly basis. This is false. They provide multiplied returns on a daily basis. So, don’t look at the index’s yearly return of say 2% because the leveraged ETF will seemingly not have a return of 4% per year. Rather take a look at the daily returns during the year. However, something is more important. The multiple returns don’t mean you will have multiple profits. You may have multiple negative returns also. 

    Leveraged ETFs are high-risk due to their design. Also, some index-tracking malfunctions may occur as well as some other limitations.

    Bottom line

    These the most attractive ETFs in the market today have a great advantage of using. Traders can overcome some of the risks through diversification and leveraged ETFs are very suitable for that. Still, they are still adjusted for stocks only. Therefore if the stock market falls the ETFs will fall too. Anyway, you can enhance your trades if you spread the risk across other assets besides stocks. It’s easy to find ETFs assets like currencies, bonds, or commodities. That will help you to improve your portfolio diversification buying power (the last mentioned is for really aggressive traders).

    Leveraged ETFs are new products but they are providing more choices to manage risks and take profit. 

    They are a good option but what if you don’t want to enhance your buying power if the bear market is in play? That would require short positions to take advantage of the downside potential in the market.  A leveraged ETF could be a great answer in this situation, also.

  • Trading Exit Strategy App – Where to Find It

    Trading Exit Strategy App – Where to Find It

    Trading Exit Strategy App
    Here’s a look at the best trading exit strategy app to avoid your losing trades

    Do we really have the trading exit strategy app? Only when you can assure yourself that you are not holding a wrong position you can be confident that you hold a good trade. Every single trade must have its own exit strategy, that takes into account both price rises and price drops. In other words, risk management. So you MUST plan your exit and you must have the best trading exit strategy that is possible.
    Well, how to create a good risk management system? How to choose a good exit strategy? How to determine it?
    That’s science. It is difficult and mostly depends on your feelings which is the riskiest part of every trade. 

    Identify when to take profit from trading

    Having an effective trading exit strategy app means to have the opportunity to identify when to make a profit from trading. Sometimes you will close your position too early and miss the bigger profits, other times you may lose if you stay too long on position. 

    When is the right time, how to know when to take a profit? 

    It is crucial, before entering the trading setups, every trader MUST have an exit strategy. It isn’t a matter of traders’ will, it is a matter of protecting from losing trades. 

    If you don’t have a trading exit, you’re trading without a strategy, you’re trading based on guesses or emotions. So, the chances of making a loss instead of profiting, are more likely. 

    What is the best trading strategy?

    Basically, a trading strategy is a plan of buying and selling in the stock markets. It is based on rules that have to provide successful trading and make a profit.

    When you are trading the stock market, you have to make a decision to buy or sell an asset, or to stay on the position. To be able to make a decision you’ll need information.

    Trading strategies MUST assist you to simplify the process of analyzing all information and making decisions. 

    The stock market works simply. It is like an auction house. It provides to both buyers and sellers to set prices and make trades. The stock market operates thanks to a system of exchanges but it is a zero-sum game. Meaning, some traders have to lose, so you would have a chance to make a profit. There is no other way. Any trade has only two ends: loss or profit.

    What is necessary to identify when to take profit from trading? 

    You should consider at least two exits: stop-loss and take-profit in your trading exit strategy.
    Stop-loss is the point where you exit the position when the trade isn’t going in your favor. Take-profit is the point where you exit the trade in profit.

    Getting out of losing trades

    Losing trades is a reality. They are coming together with winning trades. Yet you are never sure is your trade losing or winning one. This can discourage many traders and they may give up.
    But, wins and losses don’t need to come randomly. You don’t need to trade like that.
    Yes, the stock prices may go up and down and nobody knows exactly why the stock price makes changes. The stocks are volatile and their price may extremely and rapidly change.

    That’s the reason to have the best trading exit strategy app and keep the investment safe.

    Traders choose different strategies depending on the time frame of the trade and how long they want to keep the trade opened.
    Today, if you want to trade successfully, you will need to pay for hardware and software to use available strategies. But still, you have no guarantees and (this is more important) you don’t have any chance to check will your chosen strategy end with loss or in profit.

    Reasons for seeking the trading exit strategy app

    If traders have a good entry, it is more likely to reach the stop-loss or take-profit target faster. That will give you a chance to make another trade. And another, and so on.

    But, if you don’t have a good entry you will need time to see the result. That may hurt your profit. Of course, some winning trades will take a bit of time to develop.

    When you have a good entry you may increase the number of trades you want to take and you will have more advantages. To this point, everything sounds logical.  But how to avoid premature trading exits and losses? 

    For all traders, this should be the last warning! 

    When it comes to the exit strategy the things are not so clear to many people.  Having the best trading exit strategy (as much as it is possible) is important. Even more than planning for entry. Why? Your exit strategy shows how you have hedged your trade.

    Do you really know when and how to exit the trade?

    Most of the traders think that the entry point is the most important. Yes, it is important without doubts. But are you sure your trade will go in your direction? Do you have something to protect you from sudden price changes? That is the exit strategy. And if you don’t plan your trades you may end up with big losses. 

    If you didn’t think of an exit strategy, here is what you have to do.

    Set Trailing stop-loss

    A trailing stop-loss will help you to manage risk while optimizing possible peaks. By setting a trailing stop-loss you will secure your profits and accumulate more. Firstly, you must set levels for profit and loss. You will do that in a percentage, for example, 1.75% stop-loss and 3% take profit levels. What will the trailing stop loss do for your trade?

    It will close your trade when it has created the set peak and the trend begins to reverse. 

    A trailing stop order means to set a limit on the maximum potential loss but without setting a limit on the maximum potential profit. We can identify “buy” and “sell” trailing stop orders.

    Use time-based exit strategy

    This exit strategy is when you appoint the maximum time you want to spend on a trade. This is a good strategy because if your trade isn’t successful after a given time, the smart choice is to exit the trade. Well, how much time you will give a trade is up to you.

    Time-based exits are good when the trend is moving against you. It is a simple strategy that can help you control your losses.

    Stop-loss/take-profit strategy

    The truth is, there is no other way to get out of the trade than with loss or with profit. The last mentioned is better, right?
    One of the best exit strategies is applying stop-loss/take-profit.

    The goal of stop-loss is to keep you in a trade and limit losses while take-profit will secure profits by closing the trade when the profit target is reached. It isn’t easy to calculate adequate risk/reward ratios for stop-loss/take-profit orders. You’ll need time and effort to master it. 

    For example, how to identify the stop-loss position based on the money you are ready to risk at each trade? Stop-loss totally depends on the money invested. 

    Stop-loss and take-profit work almost in the same way but you have to define their levels differently. To make this more clear, the stop-loss will minimize the cost of the failed trade but the take-profit order will give you a chance to take the profit at the peak of the trade. You have to recognize the right moment to exit with profit.

    The market swings all the time. One positive trend can easily turn into a downturn in a second. You may think it is better to exit the trade with profit right now. Why risk potential earnings? Well, it isn’t a good option. If you don’t let your profit to grow enough and you exit the trade prematurely, you will lose a great part of potential gain. But, also, waiting for too long can be equally harmful.

    The drawback of stock trading apps

    Trading apps that you can find currently on the market are good for some things. They will give you a real-time market data or will help you to find new stocks. Yes, there are some apps for charting but still, you will need to write it down to Excel. Additionally, those apps can be costly and out of reach.

    The majority of stock trading apps you can find don’t give the variabilities in a meaningful way. Moreover, they don’t include one of the most important features for every single trade – examining and testing on where to set a stop-loss and take-profit level and when to exit the trade. 

    But, even if you decide to purchase them, will you have an opportunity to check the efficiency of your strategy? So, they are useless for the execution of your trades.

    You need an effective and accurate exit strategy app

    We were examining almost all apps, spent many years on research to find valuable tools or apps that would give traders a chance to check their exit strategies.
    We couldn’t find any. There was no such app.

    Until now.

    Here is Traders Paradise’s best trading exit strategy app.
    What our app is doing?

    Traders Paradise developed a trading exit strategy app, a unique tool for optimizing the exit strategy.

    This unique and easy-to-use trading exit strategy app will do all the hard work and complicated math operations for you and performs it all on its own. 

    All you have to do is to choose the stock you want to trade. We have a long list of the companies and you simply have to mark any by clicking on the name or to type the ticker name or the name of the company. But HERE you can find the full explanation.

  • Indicator Trading And How To Use It

    Indicator Trading And How To Use It

    Indicator Trading And How To Use It
    Indicators can help find some market tendencies but you must learn how to use them properly.

    Indicator trading means to use technical indicators to examine the stock price and ensure trade signals. Trading indicators handles stock price data utilizing mathematical formulas. In essence, indicators will show you an illustration of the mathematical formula and stock price data. But you have to be an experienced chart reader or elite trader to notice that indicators will not show you more than the simple price chart without indicators.

    But indicators may help to simplify it and that’s the reason why indicators are so attractive to fresh traders. Well, it is simpler to find an indicator that will define the trend or trend reversal than to learn how to examine and find a trend on the stock price chart.

    So, behind indicator trading lies the simplicity of using.

    Indicators will provide you a particular trade signal and alert you that is the time to enter a trade.

    We can say that technical indicators are primarily formulas that help to examine chart data. They are accurate, they are simple, also, they request less time and give direction to price charts. But here is the tricky part. Indicator trading doesn’t mean that you will have 100% successful trades.

    What are indicator trading strategies? 

    The main problem is that you can find numerous indicators and new indicators appear almost every day. But you can combine them and create an indicator trading strategy.

    For example, a crossover strategy which means that price or an indicator crosses way with different indicator. Let’s say that price crossing a moving average is one of the simplest indicator trading strategies.

    One of the variants of this strategy is when a shorter-term moving average crosses a longer-term moving average and it is so-called a moving average crossover.

    Some crossover signals combine an RSI moving above 70, for example, and then go back under. When you see this signal you can be sure that there is the overbought condition and a pullback will occur. Thus, when you see a drop under let’s say 20 or 30, and it is accompanied by a rally back over 20 or 30, it is an indication that the rally will come. 

    Also, you can use indicators as a tool to confirm your opinion in trading since they will show you reversals and downtrends. There is one thing you have to keep in mind, a lot of indicator trading strategies will not result in profit.

    What are the disadvantages of indicator trading?

    So, it is obvious that indicators have their flaws. The problem is that they make calculations based on historical prices, so they don’t provide any outside insights. If you practice indicator trading in the stock trading, technical indicators will never give you actual data about the company.

    Moreover, indicators usually come after the price chart. So, the following situation may occur. Let’s say the current price is changed for a short time and got back, but your indicators will be changed according to the previous price but you entered the trade based on them. What is likely to happen? Your entry point is wrong and you could end up with a loss.

    Lastly, indicators may oppose each other. Also, the same indicator may display different things at different times. And you have to recognize when they are accurate. 

    This is the reason why many traders have doubts about indicators. Yes, you can find various indicators or develop your own by using software but you have to use them properly.

    How to use indicators properly?

    Firstly, don’t expect a miracle from indicators. All you can expect is that your estimation will be a bit more accurate. But your decision shouldn’t be based on one particular indicator. The reason behind is that all indicators are not the same. Each of them has its own philosophy and mission, to be said.

    You can find many types of indicators, for example, trend indicators,  volatility indicators, oscillators, etc. But indicators are useful only if you use them in line with their design. For example, the trend indicator is adjusted to recognize and follow a trend. You cannot use it for the price in a range because you will miss its full potential. Another thing is very very important. Indicators may provide you faulty information if you don’t use them in a proper way.

    The benefit of indicator trading

    As we said above, they can simplify price moves. For newbies in the stock market indicators are easier to understand than the complicated price chart. But easy isn’t always profitable, you should know that and keep that in mind. 

    Indicators are outstanding tools for mastering how to find gaps or strengths in the stock price when trends are weakening. They can be very helpful for new traders that still have a problem to guess on a price chart. With the help of indicators, they could recognize the fine tunes they have not yet qualified themselves to notice on the price chart.

    How many trading indicators to use?

    In indicator trading, you will need several indicators to know when and how to enter the trade. If you use only one indicator it is possible to get false signals. A lot of them.

    For example, the MACD provides crossover signals and it is smart to sell when the MACD graph goes under the signal line. But if you are a really smart trader, you will not sell every single time when MACD shows that or you’ll have a lot of losing trades. So, you will need to use some other indicators as control or filter in order to recognize the trend. For example, the moving average can be useful. In this way, you’ll increase the number of valuable signals. Simple as that.

    But be cautious, if you use too many indicators you may overanalysis your chart. That can have a bad influence on your trade. 

    The experts’ recommendation is to use up to 5 indicators per trade. Actually, 3 indicators are quite good enough for a solid trading strategy.

    Bottom line

    The indicators are a key part of technical analysis, after all. But do you really need indicators for profitable trading? Actually, no. Surely, they can give you strongly aid and improve the results of your trading and they are worth using. On the other hand, never observe indicators as only and the most important part of trading. The truth is they can simplify your trading more than price action trading. But keep in mind, as we said, the simple isn’t always more profitable. 

    Use indicator trading to recognize occasions when to get in or out of the trade since it isn’t always visible in the price charts.
    In most cases, indicators will not tell you what the price chart is not telling you. Hence, use indicators if required. If you see they are not raising your profit, give up. 

    Is there any other reason you may have to use them? No.

  • Is Coca Cola Overvalued – Trick Or Treat

    Is Coca Cola Overvalued – Trick Or Treat

    Is Coca Cola Overvalued
    Coca-Cola has performed very well in 2019. The stock isn’t cheap but also, not overvalued. The increasing margin and investors seeking yield couldn’t be a problem for the company to continue great performing. 

    The question Is Coca Cola overvalued could be a trick. Why do we think so? If we take a cash flow at a consideration we can see that Coca Cola is trading at 24.4 times operating cash flow and 31.3 times earnings. Further, the forward price-to-earnings ratio is at 24.6%. and the latest price is $54.69 (data from January 3th, source Yahoo Finance). Although, the company is not expensive. 

    Further, if you have in your mind that most government bonds are trading under 0% yield, the negative interest rate in the EU, currently inflation is low, KO that provides a 2.9% yield, you must understand that it isn’t expensive.

    Of course, it will be better if the stock can provide a higher yield but for that, we have to wait for additional dividend increases. On April 9, the stock traded at $55.77, the current price is at $54.69 but we all have to admit it isn’t a sharp decline in the stock price. Coca Cola management may reinvest the company’s operating cash in capital expenditures (CapEx) to get, improve, and keep the property, improve technology, or equipment. Further, the company can reinvest in development such as innovation to improve the product portfolio, marketing or M&A to maintain the business like it was in the past 20 years or more.

    Also, Coca Cola can use the operating cash to further improve profitability. That would influence its P/E ratio.
    Having all these indicators in mind it is easy to conclude that Coca Cola isn’t overvalued stock.

    It has a high debt

    Coca Cola has raised debt levels. The company has a slightly low liquidity position as the current ratio is at 0.92. The sustainable level should be 1.00 but the current debt levels are not something to be worried about. Boosted debt came from the fast increase of long-term debt and falling sales. But as we said, the company plans to improve sales and operating cash flow will likely grow. That could easily cover the debt. Moreover, the company’s bonds are doing very well. 

    Why do some investors think that Coca Cola is overvalued?

    Some investors avoided this stock due to its valuation. But try to be honest, it isn’t expensive. The company is paying a stable dividend yield and, according to its statements, it plans to have strong sales in the future. Coca Cola isn’t in the phase of low operating cash flow. Experts’ opinion is the stock hasn’t sell signal. It is contrary, with 31.3 earnings it has “hold” or even “buy” signal. Moreover, some estimations and predictions show that stock may hit over $60 (close to $65) this year. Well, Coca-Cola is a solid dividend-paying stock and it will likely continue to produce stable profit for its shareholders.

    The profitability of the company

    Let’s see is Coca Cola overvalued. Over the last four years, the company had a total revenue drop of $10 billion to $34.3 billion. Operating margin was improved by 560 points up to almost 29% and income dropped to about $10 billion which is a difference of just $400 million. The good sign is that the company increased cash by almost $10 billion from its operations while dividend payments hit a new record of $6.74 billion. 

    This year, Coca Cola has got back $3.4 billion through dividends and distributed stock worth $233 million. Yes, it is lower than for the same period last year due to several factors and the dividend increase of 3% may not be so visible. But the stock has had a great play in 2019 with a return of over 16%. So, what do you think, is Coca Cola overvalued? We think it isn’t. The company has a great product portfolio that could boost sales. So, KO could be one of the best investments in the next year since, as we can see, there is still a lot of potentials. Maybe the better question could be is Coca Cola undervalued rather that is Coca Cola overvalued stock. 

    Coca Cola through the history

    After 133 years of existing Coca Cola isn’t a woman-body-shaped-bottle. More about the company you can find in its fresh statements updated for Q3 earnings result for 2019. 

    The Coca-Cola Company is an American corporation established in 1892. It is primarily recognized as a producer of a sweetened carbonated beverage. It is a global brand not only the US trademark. The company is also focused on producing and sells soft and citrus drinks. Its product portfolio consists of more than 2,800 products available all over the world. That makes it one of the largest beverage producer and seller in the world and, also, one of the biggest corporations in the US. The company is headquartered in Atlanta, Georgia.

    Almost 55% of its sales come from carbonated soft drinks. The rest 45% goes to juice, dairy, tea, coffee, etc. The interesting part is that Coca Cola is a market leader in almost all of these areas selling its products through over 28 million customer stores.

    Speaking about its stock, Coca Cola could be everything but not overvalued. Moreover, it is a growing brand after 133 years. And the company still has great ambitions to meet consumers’ demands. Respect.

    And don’t be worried if this famous producer is able to meet them. Despite the increasing competition, the company has transformed into an asset-light company. It manages to improve supply chains and modernize its packagings, the concentration of sugar and modern tastes. 

    Don’t ask is Coca Cola overvalued. It isn’t.

    Bottom line

    Coca Cola is consumer staples stocks. It provides goods that people need on a daily basis. That fact makes it an excellent investment in practically every economic condition exceptionally winning during economic slowdowns. People will always need these products no matter what economic or financial status is or if there is inflation or market downturns. The whole industry’s total return in 2019 was 27.3%. Compare this data with the 12-year average annual return of 10.4% and you will understand why it is still a good investment choice. Yes, it is 3% points below the S&P 500. Nevertheless, if the market gets rough, and especially if we will face the market correction, this industry will shine.

    In the face of this context, Coca Cola is one of the best consumer staples stocks to buy in 2020. This pick should be proficient if the market is turbulence in 2020.

    So, KO could be a good addition to investors’ portfolios.

  • The Average Stock Market Return

    The Average Stock Market Return

    The Average Stock Market Return
    The stock market average return of 10% is exactly that – an average, while the returns for any particular year may be lower or higher.

    The average stock market return was about 10% annual for the past almost 100 years. But when we take a look at any year particularly we could notice that the returns weren’t always average. And that is the truth about the average stock market return, it is average rarely.

    Historical data shows the average stock market return is 10% but when you look at year-to-year it can vary. For example, this rate should be reduced by inflation. Inflation can vary too let’s say from 2% to 3% which is a regular rate. 

    But when we talk about investing and investors we usually think about long-term investments. To be honest, the stock market likes long-term investors. They are keeping their investments five or more years.

    Keep in mind: the stock market’s returns aren’t average and could be far from average. For example, over the past 80 years, you could find that the average stock market return was from 8% to 12% only several times. Due to the volatility of the stock markets, most of the time the average stock market return was higher or lower. So, returns can be positive even when the market is volatile but the average stock market return will not rise every year. Sometimes it will be lower sometimes higher.

    What is the average stock market return? 

    The average stock market return actually is about 7%. If we take into account the periods of highs, for example, the 1950s the returns were up to 16%. But we had the negative returns of 3% in the 2000s.

    For example, from 1998 to 2018, we had an average stock market return of 6.88%. The lower return came from the enormous loss in the market in 2008. 

    But, over the last 50 years, the average stock market return was 10.09%.

    The stats may help here, the Dow Jones – by May 25, 2018, the average annual return was 5.42%. On January 6, 2012, a 25-year period ended with an average return of 7.55% per year. But if we look at data from the beginning of 20 century, the average stock market return was around 4.3% respectively.

    On the other hand, the S&P 500 index had average returns from 1957 through the end of 2018 about 7.96%. But, the average annual return from its inception in 1926 through the end of 2018 was about 10%. Last year, 2019 was great with a return of 30.43%. If we include dividend reinvestment, the S&P 500 return was 33.07%.

    How to calculate the average return on stocks?

    The average return on your stocks’ portfolio should reveal to you how well your investments have run in a particular period. This can also help you to predict future returns. Remember, this measure isn’t the annual compound growth rate.

    So, to calculate the average return on stocks you will need to calculate the return for each period. The next step is to add returns together and divide the result by the number of periods. That’s how you will get the average stock return.

    Calculate the average rate of return

    Firstly, what is the average rate of return?
    It is the percentage rate of return that is expected on an investment but compared to the initial cost. 

    The formula is quite simple. Divide the average annual net earnings after taxes or return on the investment to get the average annual net earnings and then display in percentage.

    The average rate of return formula = (Average Annual Net Earnings – Taxes) / Initial investment x 100%

    Here is the explanation of what we did:

    Firstly, determine the earnings from stock for a particular period, let’s say 10 years. Now, you have to calculate the average annual return. Do that by dividing the total earnings after 10 years by the number of years.

    Further, if you have a one-time investment, find the initial investment in the stock. If you want to calculate for regular stock investments, take the average investment over life.

    And finally, divide the average annual return by initial investment in the stock. 

    Also, you can do all of this and get the same result if you divide the average annual return by average investment in the stock but expressed in percentage.

    Let’s take the example of a stock that is likely to generate returns of 10% per year after taxes and for a period of 3 years.

    The initial investment       $10.000
    First-year’s net earnings   $1.000
    Second-year net earning  $2.100
    Third-year net earnings    $3.310

    Use formula

    The average rate of return formula = (Average Annual Net Earnings – Taxes) / Initial investment x 100%

    After 3 years your initial investment will be increased by 64% or you will have $6.420 more in your account.

    What does this mean for investors?

    As always, computing dividends is important and you have to account for them. If you reinvested received dividends, even better. That’s compounding on compounding!

    The truth be told, those who have stayed invested in stocks have largely been rewarded.

    The understanding of the concept of the average rate of return is important because investors make decisions based on the possible amount of return expected from an investment. Based on the average rate of return, you can decide will you enter into an investment or not. Moreover, the return is used for ranking the stocks and ultimately you will choose per the ranking and include them in the portfolio.

    In a few words, the higher the return, the better is the stock.

    But let’s examine one different case of the average stock market return. 

    Let’s say your initial investment is also $10.000 but (this isn’t easy to say) in the first year you lost 20% of the initial investment. That’s bad news. But in the second year, you gained 20% of the initial investment. Oh, how nice it is!

    Yes, nice but your gain is zero.

    (-20+20) = 0

    What do you think? Do you still have your $10.000? Things never move in that way.

    Here is why.

    When you lose 20% of your initial investment you ended up with $8.000. Right? That amount became the amount of your investment. On that amount, you gained 20% or $1.600. So, after two years you have $9.600 in your hands and you are short for $400 compared to your initial investment of $10.000. You lose money and your return isn’t zero. Your return is minus and you will need more gains in bigger percentages to cover that loss.

    The stock market average return isn’t misleading. That is how you have to calculate it.

    Or to calculate CAGR.

    Bottom line

    This means that investors MUST have a financial plan and investing strategy.
    There are no guarantees for big gains in the stock market and never were. The average return of 7% or 10%  is great if you are a long-term investor. It is reasonable to expect a good return on the current stock markets if you reduce your enthusiasm when the good times come.
    That’s nice, you’re making money. But, when stocks are jumping, remember that not so good time may come. Especially keep this in your mind over the bull market cycle.
    You can get the average return only if you buy and hold but not if you trade frequently. Even a few percent per year can produce nice gain over the years.

  • Buy More Stocks, And Here Is Why

    Buy More Stocks, And Here Is Why

    Buy More Stocks In 2020
    Your money should stay in stocks as bond yields and savings accounts interest rates are being held down

    by Guy Avtalyon

    Let’s explain why should you buy more stocks in 2020. The first stock market rally this year started with a lot of momentum. The S&P 500 index had its best year in 2019. The last such good year was 2013.

    2019 was really an active year. For all investors, the end of the year was a great opportunity to figure out what happened and how well they were doing. Well, it’s normal to make some mistakes but the point is to find any that has had a great influence on your investments. The most important is that these mistakes didn’t hurt your long-term investing goals and when you figure out what you did wrong you’re able to avoid repeating them. 

    So, you will be prepared for new investments which is very important.

    The beginning of the year is the right time to make plans on how to position your portfolio. Since no visible or specific cause could cause the stock market downturn it is the right time to buy more stocks in 2020.
    Actually, buying great stocks at reasonable prices should let us build our wealth firmly in the future.

    Let’s take a look ahead to 2020 for stock picks

    Many analysts are skeptical about the stock market’s gains will proceed with two-digits percentage, that’s true. So, we can conclude they are expecting volatility. This means the stock prices could go down. 

    And here is where the opportunity comes.

    Cheaper stocks represent a buying opportunity and some investors are waiting for that. Some companies are ready to outperform and continue to grow despite the economy slows.

    According to analysts from Wall Street, some well-known companies and brands could be the right choice.

    Buy more stocks in 2020 to get profit

    Picking stocks can be difficult so let’s see what is our choice for potential opportunities.

    Kohl’s (KSS)

    Kohl’s has over 1.100 stores and represents the largest U.S. department store chain. For some investors, its stock may look too cheap after the company posted the last quarterly results. KSS trades 20% under its five-year average and 25% below its average price-sales ratio. But the company is expected its revenue to grow 1.8% to $19.3 billion. The earnings would stay at $4.88 per share. But Kohl’s performed something else really great: it generated  $10.81 per share in free cash flow last year. Its annual dividend payout is $2.68 per share. Just compare these two figures. The current yield is 5.3%.

    Visa (V)

    It is one of the most powerful payment companies in the world. The company processed 180 billion in transactions worth $11.6 trillion. Net revenue was up 11% in 2019, and net income increased by 17% year-over-year and is about $12 billion. Remarkably, this large company reported two-digit growth both top and bottom line and a free cash flow yield of 3%.
    Some new initiatives should provide steady growth for Visa in the future and allow the company to take advantage of and beat competitors. This stock isn’t cheap but the high-quality is costly.

    Apple (AAPL)

    It is expected that the demand for Apple’s 5G iPhone will boost the company in 2020. AAPL stock price, according to some analysts could reach $300 in the next 12 months. Well, some are expecting the price to climb up to $440 in the year ahead and after 5 years to increase up to $1427.148. Even if you think the price is “overrated” Apple is confirmed as a good investment. Buy more stocks if you have enough capital to invest in. 

    Amazon (AMZN)

    Amazon’s stock could be a top bet fort he next year. Strong growth in its cloud-computing and advertising businesses is expecting. The analysts are rating the stock as a “buy”. The predicted price could pass a $2,000 target this year.  Shares could rise by 34% over the year, which is the experts’ opinion.

    Walmart (WMT)

    Walmart has been modifying. It has been investing in online. The company could take advantage of the growth in the middle class in China. Yes, Walmart’s market value is 40% of Amazon’s, but the difference is lowering. At the end of last year, the price of WMT stock was $120.440 but the price has been in an uptrend for the past 12 months. The future price of the stock could increase by 23%, said analysts, and predicted to be worth over $200 this year.

    Kronos Worldwide (KRO)

    This company from Dallas (Texas) produces and sells titanium dioxide pigments for broadly used in auto-industry, traffic paint, appliances, interiors, and exteriors. But the investors’ attention is focused on its revenue. It is expected to grow by 3.4% this year or to $1.8 billion. The earnings should rise $0.88 per share or by 14%.
    Despite this growth, Kronos shares trade nearly 40% under its five-year average P/E ratio. The quarterly dividend has increased by 20%. The stock yield is 5.4% at $0.18 per share.

    Tesla (TSLA)

    Tesla Inc will present its first Chinese made Model 3 sedans publically on January 7, reported Reuters. The deliveries came a year after Tesla build its only plant outside the US. The target is 250,000 vehicles a year. Tesla’s China General Manager Wang Hao said the plant had achieved a production target of 1,000 units a week, which is the production of around 280 per day, and that sales for the China-made vehicle had so far been “very good”. If Tesla’s earnings become firm, thenTesla’s stock could rise amazingly. Right now, Tesla stock trades at $418.33 but analysts are expecting to raise over $720 this year.

    Starbucks (SBUX)

    Starbucks has a great performance last year. Its shares increased by 37.5%. The company has reported revenue growth, an increase in total net revenues to $26.5 billion and net income grew to around $3 billion. Starbucks ended the past year with 31,256 stores in 82 markets. The company continues to grow in China as well as in the US. Starbucks has clear goals for its expansion. That provides a great level of certainty to investors and they could recognize Starbucks as favorable stock to buy.

    Why buy more stocks in 2020?

    For stock investors, this year already appears like a happy new year.
    Investors buy more stocks for many reasons. For example, capital appreciation could be one of them. Also, dividend payments or the ability to vote and control the company.
    Several reasons are behind choosing to buy more stocks in 2020. In this stock market condition, stocks provide the best potential for growth as always.
    The beginning of the year is an amazing time to decide where to invest. Since there is no 100% sure way to predict the stock market movements why not invest in assets with the greatest returns?

    What could we do instead?

    All we should do is to create diversified portfolios and adjust them to the market’s movements, to save a value in down markets. The general suggestion is to not look often at your portfolios. Take your time and read books about investing. You can find plenty of them packed with wisdom.  

    Traders-Paradise wishes you happy investing in the stock market this year.


  • What to Expect From the Stock Market in 2020?

    What to Expect From the Stock Market in 2020?

    What to Expect From the Stock Market in 2020?
    Create portfolios that will work no matter what the next year is going to bring. The recession will come or not, but your investments have to be protected. 

    By Guy Avtalyon

    What to expect from the stock market in the year ahead? The stock market could correct itself during the early days of 2020. But, despite some dark predictions, the stock market may keep rising over the long run.
    This is the last day (at the moment of writing) of the year during which the market was so unpredictable. At least, it was surprising.
    For example, Uber’s IPO was followed by fanfare, and what happened? Great disappointment.
    But many other stocks hit their highest-ever highs and quickly dropped to the lowest lows. The only truth in the stock market is that there will always be shocks. 

    Okay, that year is behind us so let’s take a look at what to expect in the stock market for 2020.

    The stock market will rise more

    The stock market boomed in 2019. The S&P 500 recorded a gain of 29.2% in 2019. Some analysts already told us the market will be down in 2020 but, to be honest, they could be wrong. Since the stock market rose over 20% in 2019 it is more likely in 2020 to see even greater returns than it was in the previous year.

    What you have to do? the answer is simple. If you had good returns in 2019 and your investment portfolio was doing well, just stay with it. Why would you change the winners? 

    But…

    Nothing related to the stock market is for sure and forever. There is always something to worry about. It’s our money. If you hold cash and not invest in stocks or somewhere else, your money will go anyway. So, don’t be frightened, come back to the market, and invest smartly. The year ahead could be promising. Build your portfolio, mix the assets, and avoid emotions. Yes, the stock market could be more volatile in the next year could since 2019 was much less volatile than the prior year.

    Some unpleasant occasions may arise over the coming year. 

    Firstly, in January due to the January Effect. What is this? The January effect is an increase in stock prices during that month. But is a seasonal increase. Usually, In December,  the stock market records an increase in buying, and the stock price is dropping. In January, stock prices will increase as always. 

    In fact, the January effect is a theory and calendar-related effect. Some small caps could be affected more than any other. But according to history, it was a case until several years ago. Since then, markets seem to have adjusted for it.

    What to expect from the stock market 

    The stock market is pretty much unpredictable, we can only guess. Maybe the right question is what to expect from the investors. So far the majority showed spectacularly bad timing when it comes to stocks. They are selling and buying at the wrong time. Many of them are selling just before rallies or accumulate stocks when they have to sell. 

    If you believe that the market is increasing and that it is a predominant trend, adjust your portfolio for the ups and downs in 2020. But it is the same as always. Your actions will depend on what your expectations are toward the stock market in the next year. Maybe, you will invest more money when the markets are more volatile with the expectation that pullback is temporary, who knows?

    The value stocks will come back

    Yes, stocks are growth or value type. Growth stocks are so attractive and popular. Everyone is talking about them, they are in the headlines, media are paying a lot of attention to them and burn our brains too. The whole world is watching the stocks of Amazon, Facebook, Uber, and many others because the growth stocks are giving great returns, they are well-known companies, famous brands.

    On the other side, we have value stocks. They are mostly companies form the utility industry, or energy or something else less attractive. Such stocks don’t have spectacular prices, the companies are not fast-growing. 

    Yes, the growth stocks are performing better results in growing markets but the value stocks will always do better in down markets.

    To be told, the growth stocks are increasing their value year-to-year and some experts are expecting a reversal in 2020. So, growth stocks may change their prices and decrease.

    A diversified portfolio will be helpful as always. If you hold any of these great players just sell part of it if you follow the experts’ estimations. At least, your portfolio will be less volatile.

    What to expect from the stock market: The bear market is coming for sure

    This prediction was wrong for many prior years. But, maybe the next year may confirm market bears’ expectations. We have a bull market and it showed a great strength over the year. It was faced with a yield curve inverted, trade war, Brexit, the possibility of a recession. Well, to add more pain into your lives, the bull market has to end at some point. Some experts expect that 2020 is that time.

    So, what investors have to do is to hedge the risk and take some profit, of course. As the market motto advises “you will never go broke taking profits.” Maybe it is really time to take some profit from your investment. If you believe the downturn in the stock market will come for sure, be ready to reinvest big gains. What different could you do when the important selloff comes in 2020?

    Will the recession surely come?

    Recession is an element of any business. So, we can expect it to come at any time, sooner or later. It may happen in 2020 or 2021 or 2022, literally anytime. Many circumstances have an influence on it, we are witnesses of some, that’s true. 

    Investors shouldn’t adjust their portfolios based on guessing. However, it is smart to analyze your allocation. Maybe some stocks are out of balance. Let’s say you wanted to hold 50% in stocks but you noticed that suddenly you hold 70%. That would be a clear sign that is clever to exit some positions. Just adjust your portfolio with your risk tolerance and investment goals.

    We all know that the stock market forecasts are useless. No one can predict how the market will perform. But still, we click on them to see and compare them with our opinions. The reduction of difficulties is in the essence of human nature.
    However, investing in the stock market certainly includes difficulties and risks. Seeking out for expert opinions about what to expect from the stock market in 2020 can be the wrong way to lessen risks or uncertainty.
    Investors must do their own examination. If you think the crypto will go up, just buy some of them or parts of them, or if you think Uber is a great investment, just buy some shares of it. A small portion will be quite enough notwithstanding that experts are expecting a big increase.

    One is a-hundred-percent sure, you will make at least one mistake. Take it as certain. But that’s life and also, that’s investing, be prepared for that.
    Just do your best to secure your right calls overpass your wrong ones. 

    Happy New Year!

  • Investing In Gold Will Always Be the Smart Move

    Investing In Gold Will Always Be the Smart Move

    Investing In Gold Will Always Be the Smart Move
    Get exposure to gold, it isn’t as risky as some may think and deserves a place in your portfolio.
    Gold can be a hedge against inflation and deflation

    By Guy Avtalyon

    Investing in gold whether own it as a metal, jewelry, mining stock or mutual fund is always a smart decision. This is especially true when the main currencies are dropping. There is one interesting situation that confirms the gold to be the most valuable asset. Gold is a benchmark for national currencies, for example. As the currency falls, gold will rise. 

    So, let’s highlight the chance of gold’s future. 

    Some may say that investing in blue-chips is better. Okay, it is still a good investment, yes. But is there a true potential for profit? Can blue-chips persist in the global market? They are mastodons. We are talking about them with respect but for most investors they are unachievable. 

    What is investing in gold?

    Gold has a possibility for future growth. The “golden standard” is still live no matter what the banks will insist on. It was in the past, it is now, and it will be. 

    Traders-Paradise wants to highlight some opportunities for investing in gold and how to do so. Hopefully, you will find your way.

    Why investing in gold? 

    Gold is respected everywhere in the world because of its value and bright history. 

    Gold’s history started in 3000 B.C but from 560 B.C. gold is used as a currency. The need of the ancient merchants was to use something broadly accepted in order to make trade simpler. Since the gold was universally accepted for expensive jewelry they recognized the potential in gold for valuing their products. And in trading, also.

    A coin with a seal was accepted all over the world as value for products. Since then, this rare metal that comes back, when other currencies don’t work.

    So, we can conclude that gold prices are negatively proportional to equity. Speaking about returns in long-term investments, gold isn’t so good because stocks or funds will always give better returns.

    Gold returns in comparison to assets returns

    Yes, the asset will always do better. But it can be volatile during the time.

    Oh, wait! Gold is a volatile investment too.

    Let’s look at some stats, like standard deviation. What is the standard deviation? It is a degree of how spread out numbers is. In the example of a stock price, it measures the volume of variability and dispersion around an average. It is a measure of volatility, also. Generally, dispersion is the difference between the current value and the average value. The larger the dispersion or variability means the higher the standard deviation. And vice versa, the lower figures are implying less price variability. Investors use the standard deviation to estimate the supposed risk and define the importance of specific price movements.

    During the last five years, the annual standard deviation of gold was 16. The annual loss was about 4%. This means that the chance that gold will give a profit is about 12% and a loss of 20%. That represents a big range and falls into a negative area. 

    If we compare data for, let’s say the S&P 500, we will see that the standard deviation was a bit under 10, for the same period of five years and an annual average return was around 13%.

    Let’s calculate again and we will see the range was between a gain of 23% and a gain of 3%.    

    Is gold volatile?

    But, keep in mind, the higher volatility of gold is the standard, not the anomaly. As an investment, gold is risky. But, something very similar to the relationship with currencies arises.
    Gold and stocks very rarely perform the same thing at the same time. Meaning, when the stock market lags, gold will be doing well. This doesn’t mean you shouldn’t invest in gold. Investing in gold ONLY is a risky position.
    This synergy between stocks and gold is where gold is a good investment. Honestly, gold can be a very safe investment. 

    For example, the relationship between the entire stock market and the midcap over the past 10 years is about 0.98. Gold has a relationship with the stock market of 0.04 during the same period. Basically, gold creates its own game.

    Is gold a good hedge against inflation

    Historically speaking, gold has been a good hedge against inflation. 

    The price of gold will always increase along with the increased cost of living. If we consider how gold prices performed over the past 50 years, we could see that its price has been rising while the stock market has been falling during the inflation periods. Do you remember the relationship between gold and currencies? 

    When fiat reduces its buying power during inflation, meaning, you will need more units of money to buy anything. Also, gold is much more valued in money, and, therefore, gold price tends to rise. Furthermore, gold is a good store of value. People are more willing to buy gold when they think that their national coin is dropping in value.

    But, should gold can be used as a hedge against inflation? In short, according to the mentioned above, yes. 

    Investing in gold as deflation protection

    When the business operations decrease, the economy has excessive debt, and prices decrease too, we are speaking about deflation. The full deflation we saw last time was the Great Depression (1930). Part of deflation happened after the 2008 financial crisis. But it has happened in some parts of the world.

    During the deflation (Great Depression), the buying power of gold rose while other assets’ prices fell. The most secure place to put cash in that time was gold. Today, we have a similar situation in some parts of the world.

    A portfolio plan

    Let’s explain this in the example from the recent past. During the recession from 2007 to 2009, the S$P 500 Index dropped 36%. But the gold price increased by 25%. Yes, it was extremely. But, can you see how good is to diversify your portfolio by adding gold? Even with the knowledge that gold is a volatile investment. 

    When you add the gold in your portfolio you will have that one that performs differently from the others. Gold will always act differently from bonds and stocks. That’s why many investors add gold to their portfolios. The recommended part is 10% of the overall portfolio in gold. That will create a good balance and good diversification of your investments. Moreover, you will provide the safety of the complete portfolio. By adding gold you will reduce volatility and risk. Moreover, investors are investing in gold as a safe haven during political and economic difficulties.

    Investing to have the dividend

    Gold stocks are suitable for growth investors, but a lot less for income investors. That is because the gold stock will change the prices along with the gold prices. But you can find well-managed mining companies, profitable even when the gold prices are falling.
    Rises in the price of gold are often increased in gold-stock prices. A small rise in gold prices can lead to important gains in the gold stocks. Moreover, holders of gold stocks could get a much higher ROI than holders of natural gold.
    Gold stocks that pay dividends tend to produce bigger gains. In periods when the whole industry is rising, they could be twice better than non-paying dividends when the market is in a downturn.

    Investing in gold is possible in many different ways.
    Today we have more investment options, such as futures, companies, bullion, coins, mutual funds, miners, jewelry, etc.
    For example, gold can outperform stocks and bonds which has happened during a period of 45 years. But if we look at 30 years-period, stocks and bonds were better. If we evaluate 15 years-period gold has outperformed both stocks and bonds. 

    This is one angle of view. The other comes from gold’s ability to protect your portfolio and act as a hedge against inflation.

    Anyway, it is smart to consider holding not more than 10% of the portfolio in gold. Choosing how to invest in gold includes analyzing the various gold-related investment products These investment products have various risks and return forms, liquidity components, etc. Consider how gold performs in a correlation with other assets.

  • Forex News: Dollar weaker despite the trade optimism

    Forex News: Dollar weaker despite the trade optimism

    Forex News: Dollar weaker despite the trade optimism

    Forex News for December 27: According to FXStreet, the US dollar ends on the last day (December 26) with losses against most major competitors in weak market conditions. Major pairs continue in limited ranges while trading is boring because most markets are closed due to holidays.

    Good news comes from the Chinese Foreign Minister and US President Trump. Both of them confirmed that the signing of phase one of the trade deal is just around the corner. 

    The EUR/USD pair advanced above 1.1100, while the GBP/USD pair re-took the 1.3000 marks, due to the dollar’s weakness, and chances of bigger gains are actually limited.

    The Bank of Japan Governor Kuroda said that the central bank would ease policy further if its 2% inflation goal came under peril. He also showed more confidence in the global economic outlook. USD/JPY near December high.

    The Canadian dollar is the strongest.

    All major markets are opened today (Friday 27), but there is a little action.

    Forex News: Dollar Index

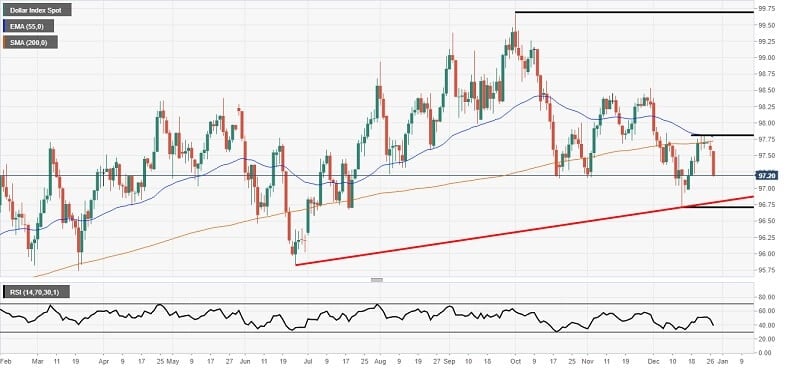
    The Dollar Index is tanking today as traders await the signing of the “phase one” trade deal.
    There are two support levels in the focus of the psychological 97.00 area and below that 96.72 wave low.
    There is also a trendline marked in red that might act as support a support area.
    Finally, looking at the RSI there seems to be room for a move lower as we are not in the oversold area.

    Forex News: Dollar weaker despite the trade optimism Image source: FXStreet

    EUR/USD consolidated near five-day highs of 1.1122 while the Cable traded choppily around the 1.30 handle         

    Asian stocks hit 1-month highs, Treasury yields traded on the back foot while S&P 500 futures recorded modest gains.

    Gold kept its bullishness above $1500. Crude oil traded close to three-month peaks on trade deal hopes and good US Consumer Spending data.  

    Cryptocurrencies reversed the recent upsurge. Bitcoin slid below $ 7,200 mark.

    Don’t miss this: Math Guide for Forex Trading