Tag: yield curve

  • Yield Curve Turned Positive

    Yield Curve Turned Positive

    Yield Curve Turned Positive

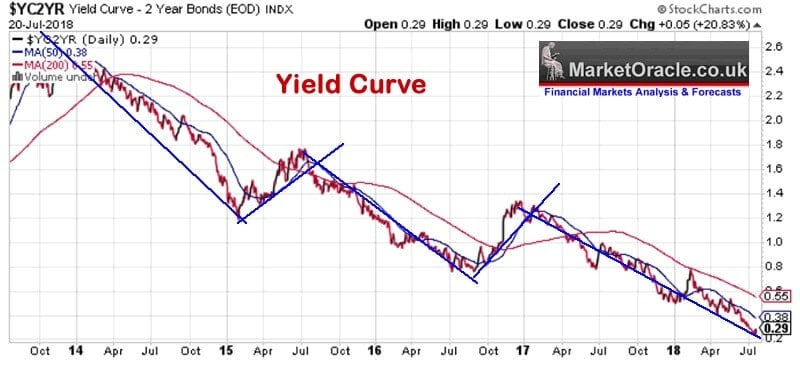
    The yield curve, an indicator from the bond market a few months ago was inverted and started alerts about the risk of a recession. Yield curve turned positive now, and that brings relief to the markets.

    The inverted yield curve is recognized as a recession warning. And now it isn’t inverted, the yield curve has turned positive now. So, can we speak about recession further? Well, that is not how these things work.

    OK, the stocks are rising, but they have turned into the new high. And what investors have to do now, to wait or hop? It looks like investors are cautious. 

    The market is an all-time high, as a difference from the past two years.

    The statistic is looking good for income investors since the 21 of the 30 Dow Jones Industrial stocks have yields of over 2%.

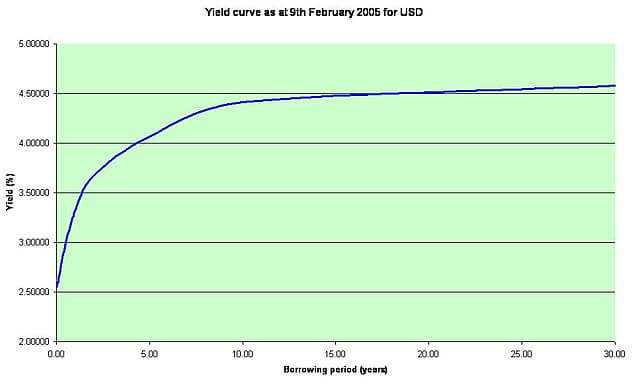
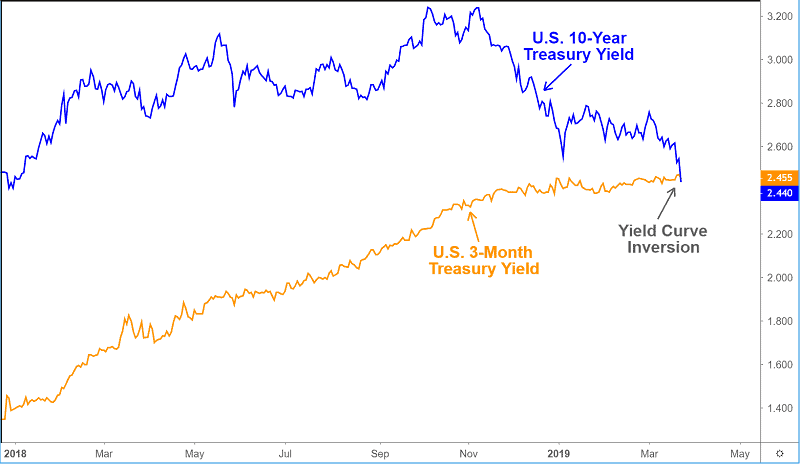
    But a 10-year US Treasury bond yield is below 2%, that level seems to be too low. Therefore, there seems to be risk without a proper return from holding bonds now. This means, there is a reasonable expectation that investors could turn to stocks. When bond prices are low and yield is low, such as right now, the investors could move out of bonds into stocks because stocks are offering a better return now.

    This is something known as great rotation.

    The positive yield curve should be a sign that rationality has returned and the markets are in regular condition now. Are investors ready for this situation and are able to adjust immediately? We are afraid that changes happened too fast and investors couldn’t be efficient at making instant trades. Only a few months ago, investors were convinced that the recession is coming, since the yield curve was inverted. And now the inverted yield curve turned positive. Earnings reports are great, stocks are growing, consumer confidence is returning, conditions look excellent. How can we mention the recession anymore?

    And this is something we have to make more clear.

    The yield curve inversions virtually ever lead recessions, but it isn’t necessarily happening right now, in the same moment. What experts noticed is that we will need about 20 months or 2-3 months more or less to see the recession triggered by inversion of the yield curve.  

    What can we expect when the yield curve turned positive?

    That should produce a change to the markets, and to forget a recession fears. This positive economic turn should produce stock prices to grow. How this can happen? Only if investors take action and invest. Their actions must have turned direction, they have to leave low yield bonds and jump into the stocks. So simple? Yes.

    The truth is, we are in an atmosphere where even the smallest piece of negative news adds fears in our lives. When the negative yield curve appeared everyone was talking about it. The newspapers were reporting, the experts were screaming from TVs, investors moved to bonds. And what we had is that yield curve was inverted and now shifts very quickly to positive giving us no breath. 

    The stock market is driven by expectations but we all have to turn to reality. The reality is clear when it comes to investing: stay focused on long-term goals and avoid emotional reactions. Don’t pay attention to a daily stock price’s changes. We must have a bigger horizon.

  • The Yield Curve is Inverted – Be Worried

    The Yield Curve is Inverted – Be Worried

    5 min read

    The yield curve is inverted - Be Worried

    by Gorica Gligorijevic

    The yield curve displays the price of borrowing money in the bond market. In essence, it is a way to measure bond investors’ feelings about risk. The yield curve has a great influence decision about your investments in the bonds market.

    We are very often talking about interest rates as all rates work in the same way. But the reality is far more complicated.
    You’ll find rates on different bonds behaving differently from one to another. It depends on their maturity. 

    A yield curve gives us the possibility to clearly see this difference. 

    It’s a graphic representation of the yields available for bonds of equivalent credit status but different maturity dates. A yield curve can be used to estimate the direction of the economy if we are analyzing government bonds.

    The yield curve follows the interest rates of bonds. And particularly important is the spread between 2 and 10 years Treasury bonds. Using it you can measure the way investors think about risk and prospects for economic growth.


     The yield curve


    When investors are worried or get nervous about economic growth, the yield curve inverts. What that means is that short-term interest rates become higher than longer-term ones.

    The short-term bonds carry lower yields as a reflection of the fact that an investor’s money is at less risk. The reason behind is the longer you invest, the more you should be rewarded, or rewarded for the risk. You can see the normal curve yield when bond investors suppose the economy to develop at a normal pace. The investors don’t feel there will be some radical changes in the rate of inflation or significant gaps in credit availability.

    But sometimes, the curve’s configuration diverges. That is a signal of possible turning points in the economy.

    Then we can say it is an inverted yield curve.


    The inverted yield curve


    Many studies confirmed the ability of the slope of the yield curve to predict recessions. And in the past 50 years, every recession in the US followed such inversion, while only once the inverted yield curve was not followed by a recession.

    An inverted yield curve marks a point on a chart where short-term investments in bonds pay more than long-term ones. When they turn up it is a bad sign for the economy.

    Receiving more interest for a short-term rather than a long-term investment doesn’t seem to have any economic sense.
    To make this clear, when you put your money in the bank, the bank will pay you interest rate. If you put your money on 6 months the interest rate is lower than if you put it on 6 years.

    But can you imagine if this was inverted? Imagine the situation when the bank pays more for the 6 months than the 6 years.

    That is happening when the investors’ fears of an impending recession are growing. In such periods investors are selling stocks and shifting their money to the long maturity bonds. That means they don’t trust in the economy and want to secure their capital until the storm passes. Honestly, it is a better solution than potential losses they could make by holding stocks during the recession. 

    But, what happens? 

    As demand for bonds increases, the yield they pay decreases.

    This kind of investors’ loss of confidence is followed by an inverted curve yield. We can see that since 1956.

    Also, the inversion started in December 2005 and announced the Great Recession. It actually started at the end of 2007, but the full-blown crisis occurred in 2008. 

    Furthermore, an inversion was noticed before the tech bubble burst in 2001.

    That’s why inversion is so horrible. Does this mean that we have a big downturn in the stock market? Not for sure.

    Inversion of the US Treasury yield curve caused a great reaction in markets last week. Losses were around 3% for the major US indices in one day. The media were on fire. And the whole world as well.

    Yet, the curve yield had reverted by the end of the week


    But it can invert again in the coming months. Let’s contemplate why fear may not be realistic.

    First of all, investors would lock up their capital if they feel that that the yield on the long maturity will fall dramatically.
    That would be a sign that the US economy was to slow noticeably.

    But investors will buy bonds when expecting price appreciation, also.

    Last week in Europe, many bonds sloped down in yield. 

    That produced the stock of negative-yielding bonds to over $16 trillion. 

    Who will be the savior? 

    The European Central Bank. It can easily restart its large-scale assets-buying program and, by doing so, push its policy rates even more into negative. 

    The other reason, international bond markets are more connected than national markets. Meaning, what’s occurring to US yields is also a consequence of what’s happening abroad. We saw this last week when the US curve inversion reflected insufficient growth indicators from China, Europe, and Singapore.

    Germany, Europe’s largest and most stable economy had an influence too.

    On Sunday, August 18, White House trade adviser Peter Navarro told CNN‘s, Jake Tapper:

    “Technically, we did not have a yield curve inversion. An inverted yield curve requires a big spread between the short and the long –we had a flat curve that was a weak signal of any possibility. In this case, the flat curve is the result of a strong Trump economy.”

    The fact is that the inversion did happen. 

    Many experts admit this inversion should make you worried.

    The yield curve “is one of the most reliable market indicators that we have and it’s not sending real warm and fuzzy signals,” said Mark Cabana, head of US Rates Strategy at Bank of America Merrill Lynch Global Research.

    Yes, the inverted yield curve isn’t a 100% sure sign for inflation or recession but, according to Bank of America, since late March, the gap between 3-month interest rates and 10-year has inverted on and off.