Tag: technical analysis

  • How to Use Technical Indicators to Analyze Stocks?

    How to Use Technical Indicators to Analyze Stocks?

    How to Use Technical Indicators to Analyze Stocks?
    Trading indicators are a component of every technical trading strategy. They help traders to get full insight into price trends.

    After you learn the basics of technical analysis, it’s time to learn how to use technical indicators to analyze stocks. This will be something very concrete because we’ll discuss their real implementation. After we debunk all myths about technical analysis it’s time to go forward. Everyone who wants to trade stocks should know how to use technical indicators to analyze stocks. 

    Traders use technical analysis to examine past market data in the hope to determine future price movements. They use indicators, charts, and other tools to recognize price patterns and trends for that purpose. Future performance of the stock price is maybe the biggest mystery in the stock market, and there is no such a trader or investor that wouldn’t like to unveil where the price will go. By using tools, the chances are bigger, without them we are just guessing, and instead of trading, we are simply betting. So it is very important to know how to use technical indicators to analyze stocks.

    Technical analysis is based on the belief that price movement would repeat, so the patterns can be recognized and used to determine a market’s trend.

    Technical analysis of stocks

    To put it simply, when analyzing stocks you have to look for patterns that appear in the chart. Patterns could be similar or exact as some previous one and based on this similarity you might have some clues of how the stock’s price will act in the future. But to have a clear picture of that you’ll need to use qualitative and quantitative techniques commonly named as technical indicators. Both techniques or types of indicators have their specific purposes. You’ll use qualitative indicators to find support and resistance levels, changes in polarity, or chart patterns but quantitative indicators will tell you if the stock is in an upward or downward trend. Quantitative indicators which are market trends, moving averages, and momentum indicators will show you the pattern in stock price actions. Based on this info you’ll decide if you will buy the stock. 

    Let’s break down each of these techniques separately.

    How to use qualitative indicators

    Important qualitative indicators are 

    Support and Resistance

    The technical analysis method assumes that stock charts will show you the bottom and top levels. In most cases, the stock price is moving between these two levels. We said “in most cases” because when there is a breakout the price could break one of these levels.

    The resistance level is also seen as a ceiling. When this level is reached the stock will not rise further, and you should consider selling the stock you own and to do so as soon as possible. You will not get a better price for it. So, that is the highest price, and you’ll profit.

    The support level represents the lowest price. To explain this, when the stock price is going down, demand for the stock will increase and form the support line below which the stock price will not fall. This means the stock will bounce back and rise in price after this level is reached. That is a great time to buy a stock at that lower price.

    This is how to use technical indicators when you want to buy or sell the stock you own. To tell that briefly, buy the stock when it is near to its support level and sell when it is nearing its resistance level.

    But there is one thing you have to keep in mind. 

    These levels are not fixed. 

    They are changing during the long term. These levels can be higher or lower. That depends on how investors look at the stock. If they think the stock is a great player they will massively buy it but if they think the stock isn’t good they’ll start to sell it. 

    You should find support and resistance levels in the stock chart. Also, an important point is where prices have paused or reversed after rising or falling. That might show you what will happen in the future, once when these price points are touched.

    When a zone of support or resistance is known, use those levels as potential entry or exit points. That could be a smart decision. When the price hits one of those levels it has only two possibilities – to bounce back from the levels or to break the levels and proceed in its direction. If that direction isn’t in your favor you can close your position with a minimum loss, of course, if you do it immediately.

    Change in the polarity principle

    So, what happens when the price breaks support and resistance? Investors are very active at these levels. But a break indicates that they are not interested in buying and selling stock further. That causes the price to move violently to find new support and resistance levels. 

    When the support level is broken, the stock could enter a freefall area and form new support. It is the same when the resistance level is broken, the stock will increase in price and find a new resistance level.

    The polarity principle means that whenever the stock price breaks through the support level that point becomes new resistance.

    Hence, the resistance is broken, it becomes a support level. 

    It is very important to know how to use technical indicators and notice when the price is near support or resistance levels. That will give you a chance to react in your favor to protect your investment.

    How to use patterns as technical indicators?

    You have to watch out the other relevant chart patterns that show where the stock price will go next. These chart patterns are grouped as reversal and continuation patterns. Reversal patterns show that a trend that was leading the stock price has expired. The stock will run in the opposite direction. This means if the stock was greatly valued, it would drop. If the stocks were undervalued, they would rise in price.

    Major reversal patterns are head and shoulders, inverse head and shoulders and, double bottoms and double tops.

    Continuation patterns represent confirmation that the current trend will stay. So, the suggestion is to hold your stock if the price is rising, or to sell it if the price is dropping.

    Significant continuation patterns are rectangle pattern and flags, triangle pattern, and pennants.

    How to use quantitative indicators

    Quantitative indicators are used in combination with other indicators for predicting the stock price movements. They can be trend-following indicators, for example, moving average will give you an insight into the current trend by smoothing out price movement.

    The other quantitative indicator is the oscillator as a momentum indicator. It measures the speed of how the stock price is changing. The oscillator will signal you when the stock is overbought or oversold. Overbought stock means that the stock price is probably dropping, and oversold means that the stock price is low. 

    How to use technical indicators – Moving averages

    Moving averages are a popular indicator, especially simple moving average or SMA and exponential moving average or EMA. Calculating SMA is quite simple but the calculation is more complicated. If you draft a 50-day SMA and a 50-day EMA on the same chart, you’ll see that the EMA acts promptly to price changes than the SMA does. But there is no need to calculate them manually since you can find charting software or trading platforms that can do that for you.

    How to use technical indicators – Oscillators

    Oscillators are extremely helpful when the stock is overbought or oversold.

    When using oscillators you can see when the stock is going upside. That is the level at which the stock turns into the overbought status. This indicates that the buying volume has been decreasing and traders will begin to sell their stocks. And vice versa, when the stock is oversold that means a great number of traders are selling their stocks consistently.

    Use oscillators when your charts are not displaying a clear trend no matter in which direction.

    Bottom line

    The way of how to use technical indicators to analyze stocks and predict market trends could determine how successful an investor you are. Technical indicators will help you to decide when is the right time to buy or sell the stocks you hold. Some will aid traders to identify and confirm a trend direction. For example, trend lines are helpful to predict support and resistance levels. Oscillators will measure the strength and speed of a price movement and help you to recognize overbought or oversold zones, potential entry, and exit points. 

    By knowing how to use technical indicators you’ll be able to make more profits and reduce your losses.

  • Technical Analysis Myths Demystified Completely

    Technical Analysis Myths Demystified Completely

    Technical Analysis Myths Demystified Completely
    There are a lot of great tools and methods that can improve your trading. But first, you’ll need to clear away some myths about technical analysis.

    By Guy Avtalyon

    What do you think, do technical analysis myths exist? 

    Some traders and investors criticize technical analysis as a “shallow” reading charts and patterns without any precise, final, or useful effects. Others think it is a Holy Grail of investing. Their misconception is that once learned will provide them constant profits. These conflicting aspects have led to the wrong using technical analysis.  

    In the world of stock trading, technical analysis is a controversial system. Many traders claim that there is no value, it is inefficacy. But on the other hand, many traders are strong supporters. Common misunderstandings come from traders that only use fundamental analysis, for example. Such will be cautious with technical analysis. However, a great number of traders across the world use technical analysis to make profits. 

    But put all these disagreements aside, and let’s take a look at the myths which come along with this.

    The technical analysis myths: TA will provide you a profit

    This myth comes along with technical analysis courses. All of them are promising great success, high profits, excellent gains. Moreover, many claims that just one indicator is quite good enough to enter the trade and profit a lot. That simply isn’t the truth. To be able to use technical analysis you’ll need to learn a lot, you’ll need practice, discipline, and risk management. To become a successful trader you’ll need time, experience, and dedication. Technical analysis is just one part of it, just one tool. But you’ll need more. TA used as only one method doesn’t have super-power. It cannot provide you easy money. All the hard work you have to do, the analysis will never do it for you. 

    Technical analysis myths are that this method singly can give you a deeper insight into trends or patterns and provide you gains. You’ll need more tools and analysis to make profits. 

    That is one of the technical analysis myths. 

    It’s a rookie illusion to believe that anyone can enter the trade armed with one method. This myth can catch everyone especially if you’re a novice. They use the lovely KISS rule extremely to explain the technical analysis. But this will never lead you to be profitable. Technical analysis will show you what has happened and what is happening. This analysis will never tell what will happen in the future.

    Real knowledge requires time to build.

    Is technical analysis simply a reading charts 

    It would be nice if true, but it isn’t. Actually, this is an idiotic opinion. Charts are useful tools but you cannot find in them everything you need to be a successful trader. The point is that you cannot step into the trading field with several simple setups or indicators and make a profit. This is one of the biggest technical analysis myths. But that’s nonsense! 

    Technical analysis is helpful to understand the market’s behavior in a simple way. It is crucial for understanding market psychology. Based on TA you can make informed assumptions about future price movements. However, just a few lines in the chart aren’t sufficient. 

    The truth is that you’ll need time to build competence in trading. You’ll make a lot of mistakes, you’ll have losses, and stress before you understand how to make decisions based on knowledge, math, and logic. Keep in mind, all that line you can see on your charts are worthless without context. 

    For example, the signals have the same value but have one big difference – the context. That’s why it is important to recognize the context in which signals appear. To repeat, the signal without the context is worthless. 

    You have to understand this character of technical analysis to be able to make recognize the way in which signals turn into results. For example, some signals acted fantastic several weeks ago but today could fail. Yes, the past performances do repeat, but never exactly. So, why is that? The answer is simple – the context is changed. Hence, the result couldn’t be identical. 

    Can you understand how dangerous this kind of technical analysis myths is? If you rely on the charts only you’ll ruin your portfolio.

    Can technical analysis give valid price predictions?

    This is also one of several technical analysis myths. Of course, never expect that all clues could be 100% accurate. That is the wrong expectation, especially rookies use to have it. If you see the exact future stock price in some predictions, go away. Don’t read it anymore. Real and qualified technical analysts normally avoid quoting prices so precisely. They will give a predictive range “from” and “to” which isn’t the exact number. 

    Technical analysis is all about probability and possibilities. There are no guarantees. When you put your money following some of the technical recommendations, understand them as the range of stock price. Keep in mind, if some stock works better more often than not that still doesn’t mean it will work all the time. But yet, that stock can generate profit more often than some other.

    The winning rate is higher when using it

    Really? The truth is that you don’t need a high percentage of winning trades for profitability. That’s the myth.

    Let’s assume you made 3 winning trades out of 4, while your friend makes one winning trade out of 4. Who is more profitable? Don’t say that you are because it isn’t quite correct until you have more info to show us. Hence, we have to know what your win-rate and risk-reward ratios are. For example, you made $40 on your winning trades but you lost $120 on your losing trade. What is your profit? Zero! Your friend had one winning trade and made $100 on his win and lost $80 on losing trades, so his profit is $20. Who is a more profitable trader now?

    The winning rate in the technical analysis is higher is also one of the common technical analysis myths. You can be profitable even with fewer wins.

    Technical analysis software can make you rich

    Maybe we should ask some successful traders this. What do you think, what has made you rich? Which software do you use? The answer will probably be: Are you kidding me? 

    No such software could be effective if you aren’t a good trader. Unfortunately, that is also a technical analysis myth. Also, misunderstanding of trading software. The internet is overflowed with a lot of software, they are cheap or expensive but all will promise you that it will perform all necessary analysis for your profitable trades. They will guarantee a profit. Just be smart, technical analysis software will provide you data about trends and patterns, but couldn’t guarantee profits.

    It’s up to you to properly evaluate trends and all other data.

    You can hear very often that technical analysis is suitable for short-term traders. That is also one of the technical analysis myths. Moreover, you’ll find it is useful for algo-trading, or high-frequency trading. It simply isn’t the truth. The truth is that technical analysis advanced along with the development of technology but traders used technical analysis much before computers appeared. Traders monitored trends by using moving averages 20-day, or 50-day, and some still do the same. 

    Technical analysis works based on the theory that past tradings and stock price changes can be worthy indicators of future price movements. But only if used along with relevant trading rules. Use technical analysis in combination with other methods of research. Also, you shouldn’t limit your research to fundamental or technical analysis when you have plenty of others. The main goal is profit. Remember it.

  • Fibonacci retracement – Know When to Buy and sell

    Fibonacci retracement – Know When to Buy and sell

    2 min read

    Fibonacci retracement - Know to Enter a Trade

    Fibonacci numbers are 1, 1, 2, 3, 5, 8, 13, 21, 34, 55, 89, etc. The sequence occurs by adding the previous two numbers (i.e. 1+1=2, 2+3=5). The main ratio used is .618. This is found by dividing one Fibonacci number into the next in sequence Fibonacci number (55/89=0.618). 

    The logic by Fibonacci based traders is that Fibonacci numbers occur in nature. And the stock, futures, and currency markets are creations of nature – humans. Therefore, traders can apply the Fibonacci sequence to the financial markets.

    There are many Fibonacci tools such as Fibonacci Retracements used by traders.

    In finance, Fibonacci retracement is a method of technical analysis for determining support and resistance levels. They are named after their use of the Fibonacci sequence. Fibonacci retracement is based on the idea that markets will retrace a predictable portion of a move. After which they will continue to move in the original direction.

    Use Fibonacci Retracements to Enter a Trade

    First of all, no indicator should be used in isolation. But by combining it with trend analysis it helps highlight logical areas for entering trades.

    Fibonacci Retracements are considered a predictive technical indicator as they attempt to identify a future exchange rate. The theory is that after a rate spike in either direction, the rate will often return or retrace. Part way back to the previous price level. Before resuming in the original direction.

    When the price of an asset pulls back, it typically has a mathematical relationship to the price wave that preceded it.

    Moves lower off a recent high, or moves higher off a recent low. 

    This relationship is based on the “Golden Ratio” and a series of “Fibonacci Numbers” that help define the numerical relationship of one thing to another.

    Interpreting Fibonacci Retracements

    Given their popularity and widespread usage by technical analysts, it is good to know how to interpret Fibonacci retracements. However, as with any indicator, it is wise to seek confirmation from additional sources. Just to bolster Fibonacci analysis before basing a large trade.

    Once an impulse wave has occurred, the price will quite often move to and stall at one of the Fibonacci Retracement levels. If the price falls through one level it will likely proceed to the next level. Sometimes, a price may stall at one level, then proceed to the next, stall and proceed to the next and so on.

    During such periods it is important to have some guidelines. To know on which levels are likely to be most important in certain market conditions. This will require a lot of practice reading price action.

    When there are strong trends, what to do?

    In a very strong trend, you should expect shallow pullbacks, to 23.6, 38.2 and sometimes 50. In regular trends, or during the middle of a trend expect a pullback to the 50 or 61.8 levels. Early in the trend, late in the trend or during weak trends expect retracements/pullbacks to reach the 61.8 or 78.6 levels.

    We can’t know in advance which Fibonacci level will reverse the pullback. Since there are multiple levels, which one it stops can be random. This is why we need some other tools to help make trading decisions. If we opt to use retracement levels.

    When it comes to using Fibonacci Retracements as a technical indicator, trader discretion is advised.

    The Fibonacci tool works best when the forex market is trending.

    Fibonacci retracements provide some areas of interest to watch on pullbacks. They can act as a confirmation if you get a trade signal in the area of a Fibonacci level.

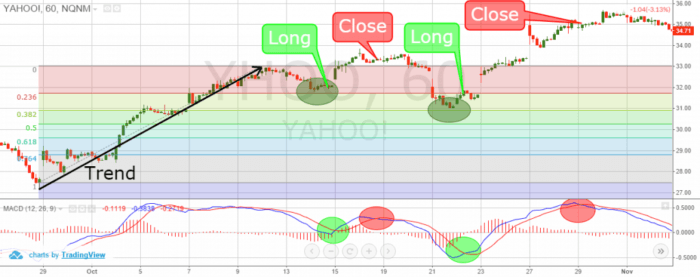
    The idea is to go long (or buy) on a retracement at a Fibonacci support level when the market is trending up. And to go short (or sell) on a retracement at a Fibonacci resistance level when the market is trending down.

    Fibonacci retracement - Know to Enter a Trade 1
    Fibonacci Retracements are ratios used to identify potential reversal levels. These ratios are found in the Fibonacci sequence.

    The most popular Fibonacci Retracements are 61.8% and 38.2%. Note that 38.2% is often rounded to 38% and 61.8 is rounded to 62%. After an advance, chartists apply Fibonacci ratios to define retracement levels and forecast the extent of a correction or pullback. Fibonacci Retracements can also be applied after a decline to forecast the length of a counter-trend bounce.

    These retracements can be combined with other indicators and price patterns to create an overall strategy.

    Unlike moving averages, Fibonacci retracement levels are static prices. They do not change. This allows for quick and simple identification. And allows traders and investors to react when price levels are tested.

    Because these levels are inflection points, traders expect some type of price action, either a break or a rejection. The 0.618 Fibonacci retracement, that stock analysts like to use, approximates to the “golden ratio”.

    Basic Fibonacci Retracement Strategy

    Fibonacci Retracements are a guide; don’t expect the price to stop exactly at a certain level. For example, the price slightly overshoots at the 61.8 level. It is typical for the price to stall just above or below a Fibonacci level.

    Buy when the price pulls back and stalls near one of the Fibonacci retracement levels. And then begins to move back to the upside. Place a stop loss below the price low that was just created. Or below the lower Fibonacci retracement level to give more room. In perfect position, the retracement level you buy at is one that the asset has a tendency to reverse it.

    Look for some sort of trade trigger to occur near the Fibonacci level. For example,  the price is up and the price has pulled to near a key Fibonacci level. You should wait for the price to consolidate. And then break out of that consolidation to the upside. This adds a second layer of confirmation. Also, you can watch patterns to trigger a trade.

    Without this trigger itis hard to trade Fibo levels on your own.

    How to apply 

    In a downtrend, sell when the price pulls up and stalls near one of the Fibonacci retracement levels. And then it begins to move back to the downside. Place a stop loss just above the price high that was just created. Or above the higher Fibonacci retracement level to give a bit more room.

    Again, add in a trade trigger or some other element of confirmation.

    Looking at how strong the trend is can help determine which Fibonacci levels are most likely to stall and hopefully reverse the pullback.

    The bottom line

    You can apply Fibo to any time frame, including ticks charts, 1-minute charts or weekly charts. Also, you can use retracement levels on any liquid market. And can be applied to individual price waves or multiple price waves. 


    You might also like:

    >>> Best Trading Strategy Without Indicators In Forex

    >>> How to Use Technical Indicators to Analyze Stocks?

    >>> MACD Indicator – Moving Average Convergence Divergence

    >>> Indicator Trading And How To Use It

    >>> P/E Ratio An Quick Method to Value a Stock


  • How to research and choose stock?

    How to research and choose stock?

    How to research and choose stock?
    Here you’ll find a full explanation on how to research stock.

    By Guy Avtalyon

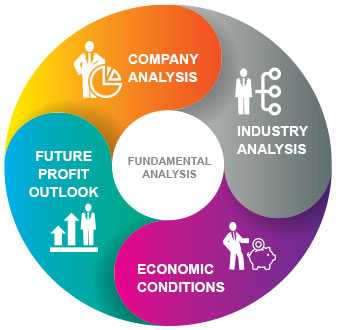
    This is the main question: how to research stock? Investors have a name for all types of research, one of them is fundamental analysis. Fundamental analysis involves looking at numbers and other measures in a company’s financials as well as assessing the less tangible aspects of a business.

    This approach can help you decide whether a stock deserves a spot in your portfolio. Pick a company you’re interested in. Read current and past annual reports and letters to shareholders. Collect the numbers and financial ratios and compare the company’s performance history to the industry and its rivals. Then work through the list of qualitative questions.

    How to perform a technical analysis

    Technical analysis is a way to understand market psychology or what are investors’ feelings about a company, which are manifested in the stock prices. Also, technical analysts are mostly short-term holders, concerned about the timing of their buys and sells. If you can identify a pattern, you could have a chance to predict when stock prices will fall and drop.

    This is useful in how to research stock because it can inform you about when to buy or sell certain stocks.

    The technical analysis makes use of moving averages to track security prices. Moving averages measure the average price of the security over a given period of time. This helps traders to easily identify trends

    Use patterns as a tool on how to research stock:

    Patterns include known price boundaries in the market price of a stock. The high boundary is known as the “resistance.”

    The low boundary is called “support.”

    Recognizing these levels provide a trader to know when to buy (at resistance) and when to sell (at support). And there are some specific patterns that are also noticeable in stock charts.

    The most usual is  “head and shoulders.”

    This shows a top price then drops, followed by a higher peak then drops. And eventually follows a peak alike in height to the first. This pattern indicates that an upward price trend will end.

    There are also inverse head and shoulders patterns, which mark the end to a downward price trend.

    What is the difference between a trader and an investor?

    An investor search for a company with a competitive advantage in the marketplace that will provide sales and earnings growth over a long period. A trader tries to find companies with a price trend that can be utilized in the short-term.

    Traders typically use technical analysis to identify price trends. Investors typically use fundamental analysis, because they are focused on the long term. The decision, will you be a trader or investor, will determine you how to research stock.

    What orders do traders use?

    Orders are what traders use to describe the trades that they want their brokers to make for them. There are a lot of different types of orders.The simplest type of order is a market order, which buys or sells a set number of shares of a security at the prevalent market price. A limit order buys or sells a security when its price reaches a decision point. For instance, placing a buy limit order on security will order the broker to only purchase the security if the price fell to a some defined level.

    This allows a trader to specify the maximum amount willing to pay, a limit order guarantees the price the trader will pay or be paid, but not that the trade will happen.

    Stop order tell the broker to buy or sell a security if the price rises above or falls below a certain point. But, the price that the stop order will be filled at is not guaranteed because it is the current market price.

    What is short selling?

    Short selling is when a trader sells shares of a security that they do not yet own or have borrowed.

    It is typically done with the hope that the market price of the security will fall. As a result, the trader can buy the shares at a lower price than sold them for in the short sale. Short selling is useful to exit a trade in profit or to hedge against risk. But it is very risky.

    This should only be done by experienced traders who understand the market thoroughly.

    What matters is developing greater self-confidence and knowing the limitations of what you can really learn and find out.

    Also, there is a combination of stop and limit orders called a stop-limit order. When the price of the security passes a certain level, this order specifies that the order becomes a limit order rather than a market order as it does in a regular stop order.


  • How To Learn About Trading and Master it?

    How To Learn About Trading and Master it?

    1 min read

    How To Learn About Trading?

    How to learn about trading or investing? First of all, don’t worry, you are not alone.

    I’ll start by telling you, there are a lot of people who are trying to make money online. You can find a very good way to make money online and for free.

    To be honest, I am not a fan of pay-to-be-rich-quick scams online. In other words, I think trading or investing is permanent learning. And life goal is to be successful in this field for a long time. 

    For new investors wanting to take their first steps, I offer great answers to the simple question.

    “How do I get started? How can I learn about trading?”

    The first step on how to learn about trading 

    Your first step should have multiple sources of a good education. Trying and errors combined with the ability to continue will finally lead to success.

    Read books, read articles, find a mentor or advisor, study the greats. Also, read and follow the market, consider paid subscriptions and be careful. 

    For some starting level investor, the stock market can be a lot difficult to understand. Without a good knowledge, no one is capable to dive into it.

    There are two main schools of thought regarding how to choose stocks.

    The first called fundamental analysis and second called technical analysis.

    How To Learn About Trading? 1

    The first refers to the use of a company’s financial reports and public statements to analyze the strength of the business. Balance sheets, income statements, yearly and quarterly earnings, and news releases are all important tools for fundamental analysis. You can find those reports online, as are tutorials on how to read them.

    The second refers that swings in stock prices follow sample that traders can learn to detect and profit from.

    Technical analysis

    Technical analysis is not as widely accepted or practiced as fundamental analysis.  Therefore many traders use a combination of the two techniques to choose stocks.

    Choosing a company with healthy fundamentals and then from time to time trading on a technical indicator is a safer strategy than relying only on technical indicators.

    How To Learn About Trading? 2

    Before you decide to buy or sell any stock, you should completely research the company, its leadership, and its competition. There are various sites which offer excellent compilations of news stories, financial statements, and stock price charts. Stock sites also show professional analysts’ ratings of a given stock, which indicates whether that analyst advises a trader to buy, hold or sell a stock. 

    Before you enter the trade

    Before you begin buying and selling stocks, you have to decide which online trading service you want to use, firstly. 

    Choosing your brokerage partner carefully can directly affect your bottom line.

    The best advice I got as an online trader is to choose my brokerage partner with open eyes.

    What you have to do, how to learn about trading:

    Practice with an online stock simulator: Using these allows you to practice your skills with zero risks. Many come with tutorials and forums to discuss investing strategies.

    However, keep in mind that simulators don’t reflect the real emotions of trading and consequently are best used to test theoretical trading systems.

    Trade penny stocks: You can find companies offer stocks that are traded for a very low cost. This wonderful opportunity to practice leveraging the market without a lot of risks.

    Trading penny stocks mean trading outside the major stock exchanges. You can trade them on the over-the-counter-bulletin-board (OTCBB) or through daily publications called pink sheets.

    The bottom line

    In conclusion, educate yourself about financial performance indicators.

    Read the news and financial websites. Listen to podcasts or watch online investment courses.

    Join a local investment club to learn from more experienced investors.

    Books provide a wealth of information and are inexpensive compared to the costs of classes, seminars, and educational DVDs sold across the web.

    Risk Disclosure (read carefully!)


Traders-Paradise