Tag: stocks

All stocks related articles are found here. Educative, informative and written clearly.

  • What is Alpha in Trading?

    What is Alpha in Trading?

    What Exactly Is Alpha?

    The ability of an investment strategy to beat the market, or its “edge,” is referred to as alpha (α). As a result, alpha is also known as “excess return” or “abnormal rate of return,” which alludes to the assumption that markets are efficient and that there is no way to systematically achieve returns that are higher than the overall market. Alpha is frequently used in conjunction with beta (the Greek letter), which quantifies the overall volatility or risk of the market as a whole, also known as systematic market risk.

    • Excess returns earned on an investment over the benchmark return are referred to as alpha.
    • Diversification is meant to eliminate unsystematic risk, and active portfolio managers strive to produce alpha in diverse portfolios.
    • Because alpha measures a portfolio’s performance against a benchmark, it’s commonly thought of as the value that a portfolio manager adds to or subtracts from a fund’s return.

    To put it another way, alpha is the return on an investment that is not influenced by broader market movements. As a result, an alpha of zero means that the portfolio or fund is perfectly mirroring the benchmark index and that the manager has contributed or lost no additional value over the general market.

    Advantages of Alpha

    Fund managers can use alpha to get a sense of how their portfolios are doing in comparison to the rest of the market. Alpha can be a useful tool in trading and investing for determining market entry and exit opportunities.

    The disadvantages of alpha

    The drawbacks of using alpha as a way to measure returns include that it can’t be used to compare different investment portfolios or asset kinds because it’s limited to stock market investments.

    Beta vs. Alpha

    To compare and analyze portfolio results, alpha and beta are utilized together. While alpha is a measure of a portfolio’s performance, beta is a measure of its historical volatility – or risk – in comparison to the overall market. For example, a beta of 1.2 indicates that the stock is 20% more volatile than the market.

    Conclusion

     Alpha is a technical analysis ratio that shows how a stock has performed or given outcomes when compared to a benchmark or market index. The alpha percentage, which is commonly expressed in simple numbers like alpha 4 or 5, or alpha -1, is the amount by which a stock or portfolio has excelled or underperformed its benchmark. A high alpha indicates a strong stock, while a low alpha indicates a bad stock.

  • How to Identify Trend Reversal?

    How to Identify Trend Reversal?

    How to Identify Trend Reversal?
    Some strategies can help you to identify trend changes even before they happen.

    If you want to know how to identify trend reversal ahead of time, we’re sorry but it doesn’t exist. There is no trading system or methodology capable of doing that. The only thing you can do is to learn how to read the price action and identify potential zones where the market could reverse. 

    So, how to identify trend reversal? It appears when the direction of stock changes and goes back in the opposite direction. The examples of reversal are uptrends that reverse into downtrends and vice versa. What trend reversal tells us? First of all, the sentiment in the stock is changing. For example, an uptrend that reverses into a downtrend tells us that traders are taking profit from the overbought price of the stock. 

    On the other hand, when downtrend reverses into the uptrend shows the sentiment is changing to bullish. That means the buyers are boosting bids to reverse back into the bullish trend. Let’s examine several indicators that might help us to understand how to identify trend reversal. 

    Why is it important to know how to identify trend reversal? 

    The main importance lies in the fact that if you recognize the trend reversal on time, you’ll be able to exit the position in profit or at least, to protect your trade from extended losses. But the trend reversal also gives you a chance to profit if you trade in the opposite direction.

    But there is a problem to recognize the start of the trend. We can spot the new trend only when it is already formed. It is visible after the new direction starts. The other problem is that you don’t see just one trend. Let’s say that the time frame you’re trading may have a trend that differs from the other on the lower or higher chart.

    Use Moving averages to identify trend reversal

    Traders broadly use moving averages to identify trend reversal and as alert of the “potential” start of a new trend direction.

    Let’s say the price passes a moving average and goes above it, that could be a sign that an uptrend has just started. Hence, when the price goes below the MA indicator, the downtrend is starting. 

    For example, in forex trading, use two MAs, one slower and one faster. When the faster MA crosses the slower MA, it is a confirmation that the new trend is developing. But you have to be careful because technical indicators can lag prices. So, you will be late for any trend change. In the best scenario, you’ll recognize a new trend, not at the start, but very close to. Still, moving averages, particularly the 200 periods moving average, are helpful indicators that may show a trend reversal.

    How to identify a trend ending? 

    Trends aren’t highways. You cannot just start the engine and drive from point A to point B.  What we can do about trend reversals is to estimate its probability to happen.

    For example, while you are trading in an uptrend direction, you can notice on your chart that something may show the market has a high possibility of reversing.

    Bullish and Bearish – how to identify trend reversal?

    An uptrend is bullish price development that proceeds to make constant higher highs and higher lows. A bullish reversal appears when the stock stops making higher highs and begins to make lower highs and lower lows. In other words, it reverses the direction from up to down. 

    A bearish trend reversal develops the same formations but inversely. In a bearish downtrend, the price action creates lower highs and lower lows. When the price ends forming lower lows and establishes a higher low and remains to rise with higher highs and higher lows, it is a bearish trend reversal.

    Different time frames

    How to identify trend reversal on different time frames? 

    The high and lows can differ depending on the time frame chart you use. Let’s explain this. For example, you use the 60-minute and 5-minute charts. In the 60-minute chart, you can see a range of lower high and lower low in a downtrend. But, your 5-minute chart can show the uptrend where higher highs and higher low candlestick closes.

    This means, your 60-minute chart shows the overall constant trends but your 5-minute chart can show a different tendency. It shows moves back to the longer time frame resistance. Here are two possible scenarios. The price will return back down is one possible scenario. The other scenario could be, the price may continue to bounce and reveal the early trend reversal attempt. The time frame you are trading is very important. It has to be aligned with a more extended time frame trend.

    How to trade trend reversal

    You can trade trend reversal at different points during the reversal process.

    The first important thing that you must keep in mind is to regularly maintain trailing stops. It is important in case the reversal turns out to be a fake. Usually, trend reversal starts as a move that fails to bounce but finally succeeds in reversing the trend. The point of reversal is a break: breakout or breakdown. It is followed by the opposing trend direction. The uptrend will ultimately top.

    As the price tries to bounce again, it is faced with greater selling pressure. So, it starts to produce lower highs and lower lows to finally break support and forms the downtrend

    Of course, this trend reversal has to be confirmed. If you enter the position in anticipation of a reversal without confirmation,  that may expose your trade to a risk of getting a fake signal. Also, your stop-loss will be triggered and you’ll exit the trade without profit. 

    If you enter the trade based on the confirmation, your entry point can be too far, so you’ll profit a little. Also, you could get stopped low on the reversion.

    How to have a proper execution?

    After you get the confirmation, wait for the first attempt and enter the trade close to the reversal support zone. You’ll have enough time to enter the trade if you use some of the popular methods to confirm the trend reversal. 

    For example, you can use trend lines. They are a simple method of visually recognizing trends and reversals. You’ll need to draw the trend lines ahead of time and to actively monitor. It’s simple to draw the trend line. Just connect the highest high and the lowest high to make the upper trend line. To draw the lower trend line, connect the lowest low and the highest low. 

    Trend lines could be diagonal or horizontal. If both trend lines are moving up or down together diagonally, they are in an uptrend or downtrend. How to identify trend reversal occurs? If the opposite trend line of the trend gets breached and then developed in higher highs and higher lows we have downtrend reversal in a breakout. Hence, the lower highs and lower lows represent an uptrend reversal.

    In case both trend lines are horizontal,  it is a consolidation that will finally end as a breakout or breakdown. 

    Bottom line

    There is no system that can tell you how to identify trend reversal with total precision. The only chance we have is to watch the price action and identify the potential zone where the market could reverse. So, we have to identify the weakness in the trending move, and strength in the retracement move. The also important signal is a break of support and resistance. Some other indicators could be a break of the long-term trendline, or if the price is coming into the higher-timeframe formation, or goes parabolic. Also, pay attention if the price is overextended.

    The more concentrated circumstances there are, the greater the possibility of a trend reversal.

  • The Settlement Period For Stocks – What is T+1, T+2, and T+3 Timeline?

    The Settlement Period For Stocks – What is T+1, T+2, and T+3 Timeline?

    The Settlement Period For Stocks - What is T+1, T+2, and T+3 Timeline?
    When trading stocks, the settlement refers to the approved, an official shift from the buyers’ account to the sellers’ accounts. This never happens quickly, it will take a few days.

    By Guy Avtalyon

    The settlement period for stocks means that the trade became official at the end of one, two, or three days. For example, you aren’t an official owner of the stock on the day you bought it, you have to wait for 3 business days while your purchase becomes official, meaning to settle. The settlement period for the stocks refers to a period after the trade date. Terms T+1, T+2, T+3, are broadly used to indicate the settlement period is one, two, or three days after the trade of any type of security is executed.

    Today, when almost all trades are done electronically, these terms are used to show that the stock you bought doesn’t yours officially until the third-day from the purchasing day. So, technology does not influence this, it is an exchange rule. To be honest, this is an important rule because it could happen that you bought or sold by mistake or you made some errors, so you’ll need some time to fix that. 

    Without a doubt, some people buy stocks accidentally, random. Later they would like to cancel their purchases when they notice a mistake or change their mind. In case the trade is a real mistake, both participants are agreed to correct the problem. And they would like to do that at the less cost possible.

    Also, there is another group of people in the stock market that don’t want to pay stocks with some weird idea that their buying will be characterized as a mistake if they prolong the time to settle them. In short, they are expecting to obtain these stocks for free. Hence, the settlement period for the stocks is an important period for the sellers or exchanges to clear up such a trade.

    The basics of the trade

    There are three phases of any trade. First is the execution which is an agreement between buyers and sellers to buy or sell a stock for a specified price. When the buyers and sellers are agreed, the exchange registers the trade on its ticker tape. 

    The next step or phase is clearing. It is an accounting process. When you bought your stock, meaning the trade is executed, the exchange should send the detailed report to the National Securities Clearing Corporation to verify the accuracy.

    The last step is the settlement. On the settlement date, the buyers execute payment for the stock and the sellers deliver it to the buyer. Typically, the settlement period for the stocks happens three days after execution.

    Purpose of settlement period for the stocks

    The settlement period for the stocks provides both sides of the trade to fulfill their side of the settlement. For example, the buyer will get more time for payment to do, also the seller might need time to fix something, like to deliver the stock certificate. Even today when the whole trading process is done digitally, the trade is official only after the number of days assigned by trade settlement rules. When the last day of the settlement period comes, the buyer becomes the true owner of the stock and registered as that.

    What are T+1, T+2, and T+3?

    Every time you buy or sell a stock, or some other asset, you’ll have two dates to keep in mind: the date of the transaction and the settlement date. This T refers to the date of the transaction. The figures T+1, T+2, and T+3 point the settlement dates of stock transactions that happen on a day of the transaction plus one, two, or three days

    The day of the transaction or the transaction date is the day when you traded a particular stock, no matter if you bought or sold it. For example, you sold your stock on May, 29. That date is the transaction date. and nothing will change it.

    The settlement period for the stocks is important for investors interested in companies that are paying dividends. The settlement date can decide which party will receive the dividends. If you are a buyer of the stock, keep in mind to settle the trade before the date of the dividend payment to get the right to receive the dividend.

    The end in the settlement period for the stocks, the last day, is the day when the new owner is assigned and the ownership is transferred. The transaction date and settlement date will not occur on the same day. It depends on the type of security.

    Consequences during the settlement period for stocks

    You have to understand what the two-day settlement period for stocks means. Let’s say you are selling the stock and expect money immediately. That is not going to happen. Yes, you’ll see that money in your brokerage account but it will not be available until the trade settles. Only after the T+3 period, you can withdraw your money.

    What could happen if you are the buyer and the stock price dropped during the settlement period? Or you don’t pay in the three days? That will not get you out of the trade and the consequences are serious. 

    If you do not pay for the stock during the three days, the broker will sell it at any price. So you’ll have to pay for losses and penalties.

    Also, selling stock through the 3 days to profit and not paying for the stock is outlawed. It’s a so-called freeriding and refers to cash accounts. It’s better to use a margin account if you trade frequently.

    Stockholder of record and dividends

    When you buy stocks, you are not the stockholder of record until settlement completes. The investor who purchases stock, for example, two days before a dividend record date will not get the dividend. So you have to buy a stock at least three business days before the record date. In investors’ lingo, such a stock goes “ex-dividend”. 

    To decide which investor is qualified to get a dividend, the record date is part of a dividend announcement. The amount of the dividend and the payment date are included also. You must own the stock on the record date. Meaning the settlement date must be before or on the record date. The dividend payment date will occur a few days (sometimes a few weeks) after the previous date, the record date.

    For example, a company declared a $0.50 dividend payable to stockholders of record as of Jun 4, 2020. To have the right to the dividend, you should buy stock on or before Jun 1, 2020. That is three business days earlier. The following day, Jun 2, is recognized as the ex-dividend date. It will be the first day when the stock will trade without that dividend attributed.

    Why the settlement period for stocks is important?

    There are several reasons. This rule is important to limit the probability of errors, even today in this digital world. Also, it keeps the markets in order. For example, if the market is in a downturn too long settlement times might cause your failure to pay for your trade. When we have a limited time for the settlement period for stocks, the risk of financial difficulties and losing money is reduced.

  • Investment Portfolio Rebalancing – Why Should We Do That?

    Investment Portfolio Rebalancing – Why Should We Do That?

    Investment Portfolio Rebalancing - Why Should We Do That?
    Even if you’re a less aggressive investor, you should rebalance your portfolio at least once a year.

    By Guy Avtalyon

    You invested your hard-earned money for the long term, you added your lovely stocks, bonds, whatever, and thought everything is done and suddenly somebody told you’ll need investment portfolio rebalancing. What? Should you find an accountant? What you have to do? How to perform that investment portfolio rebalancing? What does it mean, at all?

    That is the main key, the fundamentals of investing. You have to do two main things: building it and investment portfolio rebalancing. 

    The investment portfolio is a collection of your investments. You hold stocks, bonds, mutual funds, commodities. The allocation of the assets you own has to be done based on your risk tolerance and your financial goals. But nothing is finished with the moment you bought your lovely assets. It is just a beginning. After a few years or sooner you’ll notice that different assets generate different returns and losses as well. Some stocks may have nice and high returns, so they become a large part of your portfolio. Much bigger than you wanted. 

    Assume you built up a 60/40 portfolio where 60% were in stocks. But after some time, you found that the value of those stocks represents over 80% of your portfolio’s overall value. What you have to do? Honestly, it is the right time for investment portfolio rebalancing.

    Investment portfolio rebalancing means that you have to adjust your investments, you have to change the asset allocation of the portfolio to obtain your desired portfolio outlook.

    Why is investment portfolio rebalancing important?

    It will help you to keep your desired target asset allocation. In other words, to keep the percentage of assets you want to hold adjusted to your risk tolerance and to earn the returns you need to reach your investment goals. If you hold more in stocks, you’re taking on more risks since your portfolio will be more volatile. That might have a bad influence on your portfolio because the value will change with changes in the market. 

    But stocks look like a better investment than bonds due to their ability to outperform bonds as a long-term investment. That is the reason to hold more stocks than bonds in your portfolio but as a reasonable portion to avoid additional risk.

    In periods when the stock market performs well, the portfolio’s money value that’s come from stocks will grow along with stock price rise. We already mentioned this possible scenario when your 60% of holdings in stocks rise to over 80%. This means your portfolio can become riskier. So, you’ll need investment portfolio rebalancing. How to do that? Simply sell stocks until you manage them to represent 60% of your portfolio. For the money received from that selling, you can buy some less volatile assets such as bonds, for example. 

    The drawbacks of investment portfolio rebalancing

    However, there are some problems if you rebalance your portfolio during the time when the markets are doing well. Even more, it can be hard to sell stocks that are doing well, they are your winners and their prices might go even higher. What if you miss huge returns?

    But consider this. What if they drop and you lose an important amount of money? Are you okay with that? 

    Remember, every time you sell any asset that is an excellent player, you are actually locking in gains. That’s real money and you can use it to obtain some stocks that are not such a good player but you’ll buy them at a bargain. Do you understand what you actually did? You sold high and bought low. You’re every single investor’s dream. You made it happen! 

    The real-life example 

    Our example of rising to 80% is rather drastically than a realistic one. Investment portfolio rebalancing ordinarily means selling 5% to 10% of your portfolio. We are pretty sure you are able to choose 5% of your winners and to buy some current losers but in the long run also winners. Investors usually buy bonds instead of stocks when rebalancing their portfolios. 

    Investment portfolio rebalancing is important because it provides you balanced asset allocation and, what is also important, in this way you’ll avoid additional volatility of your portfolio. If you’re the risk-averse type of investor this added risk might produce bad investment decisions. For example, you might sell stocks at a loss.

    Investment portfolio rebalancing is the best way to follow your financial plan and obtain the best returns adjusted to your risk tolerance. Anyway, you don’t need to be overweight in stocks because the markets are cyclical, and it could be a matter of time when the next reverse will come.

    Why rebalancing your investment portfolio?

    Let us ask you. Are you having a car? Do you change the oil or broken parts from time to time? The same is with your investment portfolio even if it is the best created. As we said, the markets are cyclical and some parts of your portfolio might not play well in every circumstance. Why should you want to hold a stock that isn’t able to meet your investing goals or you bought it by mistake?
    It isn’t hard to rebalance your portfolio, at least once per year. In short, that is investment portfolio rebalancing. If you think your investment portfolio is well-diversified among asset classes, just think again. Maybe it is diversified among asset classes but is it diversified within each asset class?

    For example, why would you like to hold only Swiss biotech stocks? There is no reason. Moreover, it can be dangerous. It can hurt your investment portfolio a lot. It is better and safer if you hold a mix of different stocks, domestic and foreign from different sectors.

    What if some of the investments grow in value while others decline? 

    In the short term, it is good. In the long run, it can be a disaster. That is the reason to rebalance your portfolio promptly and properly. Otherwise, your portfolio will be hurt as well as your overall returns.

    For example, you own 50% in stocks and 50% in bonds. Sometime later, your stocks performed unsuccessfully and their value is lower now, but bonds performed outstandingly. So, what do we have here? Bad performers – stocks at lower value and bonds as excellent players at a higher value. Would you think to change the proportion in your portfolio? Of course, you would. So, what do you need to achieve that? 

    Let’s examine a different mix. For example, you may rebalance your portfolio and now it will be 40% in stocks and 60% in bonds. But what is the consequence if you don’t rebalance your portfolio and stay with your initial mix? You will not have enough capital invested in stocks to profit when stocks come growing back. Your returns will be below expected.

    What if stocks were growing in value while bonds did unsuccessfully? Or, what if your portfolio turned into a collection of 60% stocks and 40% bonds, and quickly the stock market dropped? You’ll have greater losses, much bigger than it is possible with rebalanced the 50/50 mix. In short, you had more money in stocks. Your long-term gains are in danger.

    To make a long story short, when rebalancing, you have to cut the over-performing stocks and buy more underperforming assets. The point is to sell overvalued stocks and buy less expensive but with good prospects. Do you understand this? We came up again to the winning recipe: buy low, sell high.

    How often should you do that?

    The answer is short, once or twice per 12 months mostly. Markets are cyclical and unpredictable. However, if you rebalance at an uncertain period of the year you’ll put your money at risk. Never avoid rebalancing your portfolio after significant market moves. Follow a 5-percent rule. Your investments should be within 5% of where they were when you build your portfolio. For example, if your initial portfolio was with 60% in stocks (you were smart to buy good players) and after several months they changed to 65% or over, it’s time to rebalance. In case you weren’t so smart and you bought poor performers and they changed to 55% or below, it is also time to rebalance. You have to prevent your portfolio from fluctuating more than 5%.
    That’s the whole wisdom.

  • What Is a Good Rate of Return?

    What Is a Good Rate of Return?

    What Is a Good Rate of Return?
    The rate of return measures the profit or loss of an investment over a particular time. A good rate of return shows how smart an investor you are.

    By Guy Avtalyon

    What is a good Rate of Return is the question that many people continually asked, but it is almost impossible to get an answer until we explain what the Rate of Return is. So we have to make this clear before we answer what is a good Rate of Return. 

    A Rate of Return represents both gains and losses of your investments during a particular period. To know what is the Rate of Return on the investment we have to compare these gains or losses to the cost of our initial investment. RoR is shown in percentages of the initial investment. If the Return of investment is positive, meaning over the zero, we call it the gain. But if it is negative, in the minus area, below the zero, it represents our losses on the investment.

    In essence, RoR represents the net gain or loss and can be calculated. When we do that, we are actually looking for the percentage of which the investment was changed from the beginning until the end of a particular period of investing. 

    To know what is a good Rate of Return let’s see the formula: The formula to calculate the rate of return (RoR) is:

    Rate of Return = ((Current investment value – Initial investment value)/Initial investment value)) x 100

    Deduct the initial investment value from the current investment value, divide the result by initial value, and multiply by 100. 

    For stocks and bonds, some dividends should be added. You have to calculate the RoR for stocks a bit differently.  Suppose you bought a stock for $100 and hold them, let’s say, 5 years. After 5 years you sold them at $140. Your per share gain would be $40, but you also received dividends for that stock and it was $20 per share. So, your total gain is $60.
    The RoR for this stock is $60 per share divided by the initial cost per share which was $100 and multiplied by 100. So, the rate of return on this stock is 60%.

    What is a good Rate of Return?

    First of all, you must have a realistic expectation of return on your investment, to understand how compounding works, how to calculate it, etc. That is to say, every single percentage that increases in profit can boost your wealth every year. It is all about geometric growth.

    So, you know how to calculate the rate of return on investment, but how could you know what is a good rate of return? 

    There is one interesting rule in investing, everyone who has guts to take more risks will have higher returns. 

    Stocks are maybe the riskiest investments because you will never have guarantee the company will proceed to work or exist. It could fail quickly in an uncertain environment and leave investors with empty hands. So, as being an investor you have to protect your investments and to reduce the risks. And the best way to do so is to invest in different sectors and different asset classes. In other words, you have to diversify your portfolio. And do it over a longer period, at least five years. That will not provide you the best returns of, for example, 30% but can save you from market crashes. 

    Keep in mind, the answer to what is the good RoR depends on the market condition. What was good in one period could be a complete disaster during some other. Market standards can change and what was “good” easily can turn into “very bad.”

    For example, the S&P 500 has a 7% annual rate of return, if your investment has a 9% rate of return, it is doing better and outperforming the market. Okay, RoR of 9% maybe isn’t what you wanted but still, your head isn’t under the water.

    Remember, the rate of return can be negative also. 

    What a good RoR has to beat?

    However, if you are a more aggressive investor you would like the higher RoR. So, let’s see what is a good RoR for more aggressive investors. Let’s find the answer to this eternal question. Don’t be surprised if it is quite simple.

    A good rate of return has to beat the market, must beat inflation, taxes, and fees. But, as always, there is another point of view. What is a good rate of return depends on the investment you choose. It isn’t the same for stocks, bonds, or some other asset. Generally speaking, a good rate of return has to beat inflation at least.

    We know that the average inflation rate was about 2% per year over the past 10 years. This means that you had to earn 2% or more on your investment to keep your purchasing power and to keep the real value of your investment.
    But if you invested in bonds that have 4% annual interest, your RoR will be 2%. Can you see, you have to decrease this annual interest, and for the rate of inflation and you will not have 4%, instead you’ll earn 2% of your initial investment.

    What is a good Rate of Return for aggressive investors?

    So we come up to value investing which is the best way to make money. It is a simple “buy and sell” strategy. So, you buy a good stock at an excellent price and sell it at a profit. Simple as that. The only thing you should take care of is to figure out what is the right price of a stock, in both situations, when you buy it and when you sell it.

    Figuring out the right price for a stock requires you to know how much you want to earn when you sell it. In other words, you have to know how much you would like to earn. For example, an excellent rate of return is 15% per year. It might look like an aggressive approach, but we are talking about more active investors, right? 

    How can you achieve this?

    You’ll have to look for bargains. That will take some time until you find a good stock at a bargain, but it isn’t impossible. Let’s assume you found a stock that produces the rate of return of 15% annually. After taxes and inflation, it will be about 12%. At that rate, you’ll be able to double your purchasing power after a few years and beat the market. That’s the point, that’s your intention, of course. If we know that the lowest rate of return for the stock market is about 7%, this is a really good return.

    And as we said before, if you want a higher rate of return you must be ready to take a bigger risk. But we think that repeating average returns over a long period is a better choice. Yes, it’s possible to have the great winnings from time to time, but if you take a look at historical data and your trading journal, you’ll notice that it is followed by poor performances. And it is more likely you’ll have losses than you’ll have profits in the final balance sheet.

    Maybe a better way to understand what is a good return is to recognize what the bad RoR is. We explained that a good rate of return is when it beats inflation or it is equal to it. Also, we know that a good RoR of stocks is when it outperforms the benchmark index, for example, the S&P 500 index.

    A bad rate of return is when investment returns are under the rate of inflation, or underperforms the benchmark index. No matter if the investment has a positive return, in case it is as described it is recognized as an investment with a bad rate of return. The negative rate of return is useless to talk about. This word ” negative” explains everything.

  • How To Make Money By Trading Stocks?

    How To Make Money By Trading Stocks?

    How To Make Money By Trading Stocks?
    There are many ways of making money by trading stocks and numerous methods to find potential investments that match your trading strategy.

    It is almost normal wishing to make a lot of money in several months but do you know how to make money by trading stocks? Yes, it is possible. Everything you have to do is to make several high-risk trades buying stocks that are paying dividends. Simple as that. But it isn’t going to happen to all of us. 

    Someone can make fortune trading stocks in a short time. Some people can do that. But it is too risky. Honestly, when we talk about them we are actually talking about people who know how to make money by trading stocks. Others prefer other approaches. Many of them are less risky and safer ways to participate in the stock market. But still, it is possible to make a lot of money. That’s true. 

    Also, the truth is that some traders and investors got lucky but it isn’t a common story. Actually, it is the opposite. Most traders fail to make money on the market. So if you want to know how to make money by trading stocks you have to understand the nature of the stock market. We are not going to tell you the sad stories but what you have to know is that the stock market is a zero-sum game. Meaning, if someone doesn’t lose, you’ll never earn. Is that all? Of course not. There are more so, let’s see how to make money by trading stocks. 

    Can you make money by trading stocks?

    Why not? Thousands of people already did it and still do. Some are trading stocks every day or month but the others are more buy-and-hold types. They are sitting in the stocks for decades and today they are counting their millions. For example, risk-averse types will do that. They will choose some reputable company or the company with a promising outlook, good business plan, and stick it out for the long run.

    Also, there are some other approaches. You’ll find plenty of outstanding traders capable of making money through several quick but risky trades. Frankly, they are a minority. Great success in trading will come if you pick a day trading or short selling the stocks but it is connected to the extremely high risks. You’ll have to trade in the high-risk and volatile market. But it is one of the most important and usual features of the stock markets: they are volatile, they are risky no matter how strong or experienced you are. Let’s call statistics as help, only 20%, or even less, of traders, are successful when trading the stock market. The others constantly fail to make money.

    But this article is about how to make money by trading stocks. So, let’s go!

    As we mentioned above, one way is to adopt a strategy to hold stocks for a long time. At least five years, for example. If the stock pays dividends, it’s better.

    Quick ways to make money by trading stocks

    Making money by trading stocks, especially with a small amount, is challenging, and honestly, riskier. Of course, if you don’t know what you’re doing. But let’s try to be more creative.

    Certainly, it is ideal if you have more money to trade. But it’s not mandatory. The mandatory is to have the right strategy that works for you, to have a trading plan and trading journal. If you are a beginner in trading stocks, start modestly. Try with small amounts, test different approaches, and methods. After you did it, monitor, and examine the result you got. Don’t think about obtaining the fortune overnight. That’s not going to happen. 

    The smartest thing you can do is follow some of the rules and methods on how to make money by trading stocks and place a small amount, and over time raise it until you become ready to trade with larger sums.

    Let’s go! Play the market and earn money!

    Day trading is for traders with courage and heart. It demands to understand various forces at play in the stock market. For day trading you’ll need more experience. Well, if you are a good student and learn a lot, day trading will give you a chance to make a lot of money in several hours. The point is that you don’t need to invest a large sum, you can do it with a relatively small amount.
    But be careful, you’ll need to hedge your bet. What does it mean? You have to set stop-loss limits to cut potential losses. The advanced traders know that market makers push stocks to provoke our fear of failures or our greed. They want the stock to run for their profit, not ours.

    So you have to be very careful, to understand what you are doing, and to examine the market trends to be able to make important gains. For example, moving averages. Pay attention to them. If some stock breaks through the 200-day moving average that is the sign that potential upside or downside change in price is coming.

    Can you make money quickly by trading stocks?

    Yes, it’s quite possible. Just find companies in very volatile sectors. The other possibility is to find high-value or low-value stock with high risk but with the potential for an enormous reward. Also, you’ll have to be a short-term trader for that. That is the only way to make money quickly by trading stocks.
    For example, you’ll have to look for a high-value company that stock recently fell but you must have some clue that the stock price will rebound soon. When it happens, you’ll sell them for a higher price.

    Also, one of the possibilities is to buy a stock of some startup with the potential to produce tremendous returns. This is risky, also but can generate a great reward. The point is to hold it shortly, wait for a significant increase in price, and sell quickly. The risk here is that startups, in general, could be risky investments. A very small number of them succeed to survive a few years. They are like comets, light the sky for a while, and boom – disappear. But while they are here, in the markets, they are a great opportunity for traders to make money by trading their stocks.

    Trading stocks for a living

    People are trading stocks for a living which means they are making enough money for everyday life and over. Trading stocks can be a full-time job but also, a part-time job. What you choose depends on you. You have to find out how to make money by trading stocks from your home. Also, you may try day trading as a regular job.

    How much money you’ll make depends on your trading strategy, your skills, knowledge, etc. But not all is in your hands. You’ll have to know how the markets are doing and be familiar with many other things. Professional traders can make above $5,000 per month but that varies depending on the amount of money you put in play.
    For example, beginner traders can make several hundred or a few thousand monthly. Once, when you become more experienced with developed skills, your gain will be much higher.

    Buy low, sell high to profit from your trades 

    This approach is easy to master. It is a tested and proven formula for making a profit as a trader. But you don’t want to jump in the trade always when a stock price rises or falls. Sometimes you’ll need to stay aside and wait for your moment. It’s incredibly important not to panic when a stock falls below the price you paid. That’s the point with stock prices, they may rebound and if you exit the position too early you might miss the greater profit.
    When deciding whether the stock price is high or low enough to guarantee a trade, you should examine just a few things: the company’s earnings per share, do employees buy its stock, take a look at the company’s profit history, strength in different circumstances.

    The point is to buy low, that’s true. However, it is important to recognize the company that is able to recover and its stock will rise in price. That is exactly what would you like and as fast as possible, best right after you bought the stock. 

    The same is with the second part of the saying – sell high.

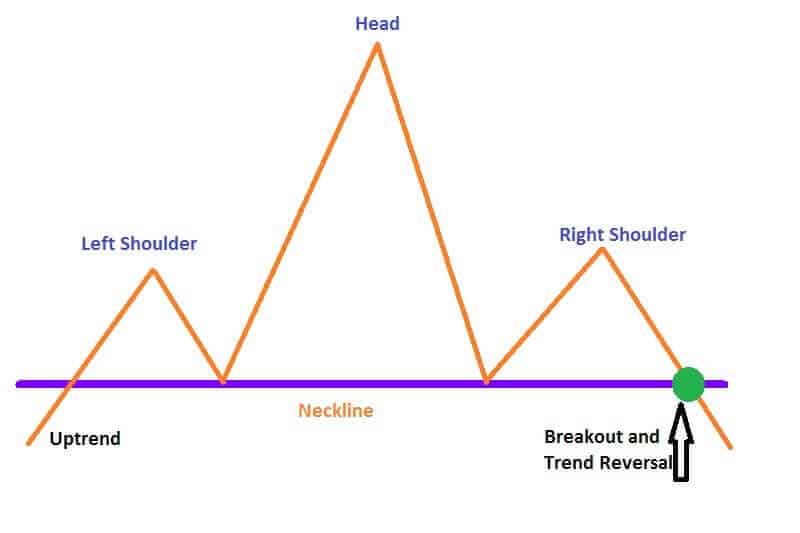
    When selling stock to reinvest the profit, you would like to ride the trend of the stock price rising as long as possible. The keywords “as long as possible.” That’s why you’ll have to learn how to recognize when the price stagnates and in which direction will go after that. In other words, you’ll have to know how to track the trends.

    In day trading or short selling, buying low, and selling high is essential to your profits. In these kinds of trading, you are dealing with highly volatile markets. The stock prices will fluctuate frequently and literally any change in stock price could end in a profitable trade. Yes, there are lots of risks but rewards might be magnificent.

    Diversification is important

    You must have a good trading plan and a diversified portfolio but not over diversified. 

    Diversifying will protect you against unpredictable changes. For example, all your stocks were in biotech, but new products have a bad influence on your stock’s prices. So, your whole portfolio could be crashed. If you have a well-diversified portfolio the influence will be protected against such trends. Also, this strategy is proper for balancing high-risk and conventional investments.  

    We have one suggestion if you really want to know how to make money by trading stocks – never walk away from trading after you made a profit. If your goal is to trade in a long time, it is smart to reinvest part of your profits or all of them.

    Bottom line

    Trading isn’t easy but practicing will help you a lot. At first glance, it may look so easy and simple. What you have to do? Just to pick a good stock and trade it. We all would like it to be that simple. The truth is that traders are carrying their knowledge to the market every single day. They can make a difference between good trades from bad trades, they are able to catch the trends, they know when to enter the position and, which is more important when to exit. Moreover, they know how long they should stick to their rules but also when it is time to break them and profit.

    Some do get lucky in the stock trading, that’s true. But it is very rare. Behind any successful trade lies great knowledge. Armed with that, you’ll make money in the stock market.

  • Head and Shoulders Pattern  – How To Trade

    Head and Shoulders Pattern – How To Trade

    Head and Shoulders Pattern - How To Trade

    Head and shoulders pattern occurs on all time frames. It can be detected visually. The complete pattern gives entries, stops, and profit targets, so traders can easily execute a trading strategy. 

    A valid head and shoulders pattern occurs very rarely. But when it appears, traders recognize it as an indicator that a significant trend reversal has occurred. A usual head and shoulders pattern is held as a bearish setup while an inverse head and shoulders pattern is held as a bullish setup. 

    But let’s start from the shape of this kind of triangle pattern.

    As you can see, the head and shoulders pattern is a chart formation that follows a baseline with three peaks. The outside two, on the left and right side, are similar in height but the middle is highest. This pattern is used mostly in technical analysis because it is broadly accepted that this pattern is a strong trend reversal indicator. One of the greatest advantages of head and shoulders pattern is its accuracy that shows that an upward trend is approaching its end.

    But let’s start from the shape of this kind of triangle pattern.

    Head and Shoulders Pattern - How To Trade

    In the image above you can see a large peak in the middle and smaller peaks from both sides, left and right from it. This pattern is extremely useful for traders because of its ability to predict reversal, from a bullish to bearish.

    And as you can see, the first and third peaks are smaller than the middle one. The horizontal line is known as neckline and all peaks will fall back to this line which represents the level of support. When the third peak falls to the neckline traders believe that a breakout occurred and the bearish downtrend started.

    In our image, you can see a bearish reversal. But if all these peaks are formed under the neckline it would be a bullish reversal.

    How to trade the head and shoulders pattern?

    It’s crucial in trading this pattern that traders wait for the pattern to form. Why is this important? Sometimes the pattern will not develop completely or maybe it will not develop at all. If the pattern isn’t developed completely, meaning it is almost or close to be, don’t trade. Just wait until the pattern breaks the neckline.  

    When you trade a head and shoulders pattern it is crucial to wait for the price move to go below the neckline after the peak of the right shoulder. So the regular pattern has one smaller peak, one fall, second higher peak, second fall, third smaller peak, and third fall to the neckline. Wait for the price action to break the neckline and then trade. When you have an inverse head and shoulders pattern, you should wait until the price action goes above the neckline, once when the right shoulder is formed.

    Open a trade only when the pattern is complete. 

    It is very important for any trader to have a plan before entering the position. For example, the best way is to write down your entry point, stop-loss, and profit targets. Also, do the same with variables that might alter your stop or profit target.

    For the head and shoulders pattern, development time isn’t a crucial element since it can develop over any period of time. Yet, traders believe that pattern that takes a longer time to form is more significant. Meaning, the probability to identify a significant price reversal is greater.

    How the head and shoulders top pattern shapes

    The head and shoulders pattern appears in the precise order and we’ll describe it. Keep in mind that we have only one variable here. It is how long it will take to finish each step in the sequence.

    As we said, in trading the head and shoulders pattern, we have to wait until the price moves a bit under the neckline after it reaches the peak of the right shoulder. For the inverse, wait for the price action over the neckline.

    Once the pattern is complete, we can initiate the trade. Traders usually enter the trade when a neckline is broken. But this is not the only entry point. The other method demands more patience since it’s based on the possibility that the movement may be missed completely. For this entry point, we have to wait for a pullback to the neckline after a breakout has already happened. This is a more conservative method. The point is to be sure if the pullback will stop or continue the original breakout. This is important because if the price continues to move in the breakout direction, we will have a missed trade.

    How to place the stops?

    In the conventional head and shoulders pattern, traders commonly place the stops above the right shoulder, just after the neckline is broken. The other way to set stops is to use the head of the pattern as a stop. This approach is risky and your risk-reward ratio can be reduced.

    When we have the inverse pattern, set the stop a bit below the right shoulder. Also, as previously explained, you can place the stop at the of the head and shoulders pattern, but you’ll be at exceptional risk once the trade is taken.

    How to set the profit targets?

    First, we have to explain that the profit target in this pattern is the difference in price between the head and low point of any shoulder. When you find out that difference, just subtract it from the neckline breakout price. It is important to provide a price target to the downside for a market top, right?

    For the market bottom, the difference should be added to the neckline breakout price to provide a price target to the upside.

    Here is an example.

    Let’s say that $100 is high after the left shoulder and $90 is the low of the head, so the difference is $10. And let’s say the breakout is $100,50. What you have to do is to add the difference to the breakout price, which is $110,50. That is giving us a target price of the same amount. 

    In the case of the regular head and shoulder pattern, you should subtract this difference from the breakout price.

    We already mentioned a timeframe. Sometimes traders will wait more than several months until they reach the perfect profit target after noticing the breakout. That is the reason to monitor the trades in real-time.

    Head and shoulders pattern really serves

    It is impossible to find an ideal pattern that will work in any circumstances and all the time. But we’ll point out several reasons why this pattern works.

    Firstly, when the price drops from the market high (which is the head in the patter), sellers would enter the market and there will be less aggressive purchasing. Further, when the neckline is met, traders who purchased in the last wave higher or on the rally in the right shoulder of the pattern, are confirmed wrong and thus facing large losses. They will exit their positions, which will drive the price to the profit target.

    The importance of stops

    Setting the stop above the right shoulder is reasonable because the trend can move downwards if the right shoulder is lower than the head. So, there is a little chance for the right shoulder to be broken until an uptrend continues. The profit target reveals that traders who made wrong trades will exit their positions, which will create a reversal. The neckline is a painful point for many traders. Many of them will decide to exit the positions, which will drive the price to move closer to the price target.

    Also, you can examine the volume from this pattern. When the inverse head and shoulders pattern occurs it would be ideally the volume to grow as a breakout happens. This presents a rising buying interest. It is very important because it provides the price to move closer to the target. When the volume is decreasing, that means that the traders’ interest in the upside move is lower.

    The traps of trading head and shoulders pattern

    Nothing is perfect and this pattern also. You can be faced with some problems when trading this pattern.

    First of all, this pattern isn’t easy to spot. More harder is to wait until it develops and completes. Sometimes you’ll have to wait very long. The other problem that may occur is stop-levels. It is hard to set the proper stop level. Also, the profit target couldn’t be easily reached every time. Sometimes, you’ll need more detailed data to uncover how the market condition may influence your exit from the trade.

    One of the widely spread beliefs is that this pattern could be traded always. It isn’t true. 

    For example, when you notice a massive decrease in one of the shoulders caused by some event, your calculated price targets will not be reached. Also, not all traders are able to notice this pattern. Some will do it without a problem but the others will never notice one.

    Bottom line

    We hope you have a better understanding of the head and shoulders pattern now. If yes, put it to work. Try to recognize both the head and shoulders and inverse head and shoulders patterns. When you recognize them, just monitor the development. This pattern can help you to find trends ahead and establish fair targets. Also, you’ll be better prepared to enter the trade when the time is right.

  • Sell in May and Go Away Strategy – Repeated Every Year

    Sell in May and Go Away Strategy – Repeated Every Year

    Sell in May and Go Away Strategy
    April is the past, and May is here. “Sell in May and go away” is an old saying that investors repeat every year without giving any actual belief to. Should they?

    “Sell in May and go away” is a popular maxim in the market. Investors noticed that some stocks are underperforming over the summer when they compare their performances to the winter period. The stock market summer-period starts in May and finishes at the end of October. The six-months period from November to the end of April is known as the winter period in the market.

    Sell in May and go away is a strategy which investors use to sell their holdings in May and come back again in November to invest. They usually sell their holdings in late spring, sellings are not in May exactly.  But nevermind. We have “Sell in May and go away” as a well-known saying in the market.

    A lot of investors find this strategy is more comfortable than staying in the markets over the whole year. They believe that when warm weather occurs, volumes are lower and the number of market participants is also lower. Investors hold that vacations may cause trading to become riskier and, at least a lifeless period in the market.

    Where the saying “Sell in May and Go Away” came from

    The old custom among English aristocrats was to leave the city of London and spend their vacations in the countryside and come back to London in early autumn when St. Leger’s day is. So the full phrase is: Sell in May and go away, and come back on St. Leger’s Day which is in September. For British aristocrats, it was a very important day because it was a race day for pureblooded horses as a final part of the British Triple Crown competition.

    Later, traders from America adopted the habit of going on long vacations after Labor Day. Moreover, they adopted this phrase as an investing saying. What is really interesting, all data from almost the whole of the past century confirmed the theory behind this strategy.

    For example, in the span of 60 years, DJIA reported average returns of 0,3% during the period from May to October. In contrast, in the same span of 60 years, the average return was 7,5% from November to April.

    But despite the historical background of this seasonal trading pattern in disparity in performance during summers and winters, it looks that it isn’t relevant in modern times. In recent years, some excellent runs occurred during the summers, the stock markets were very dynamic and generated lucrative gains to the investors who stayed in the market. 

    Some markets closed higher in May and rose in June giving an increase of over 50% from the end of June until the end of January. So, the phrase “Sell in May and Go Away” isn’t correct anymore.

    “Sell in May and go away” strategy 

    Some investors use this phrase as a strategy to manage a portfolio over the summers based on the perception that markets underperform during summer. They believe that lower trading volumes from May till October can boost share price volatility and weigh on stocks also. Selling off in May is a method to react to the slowdown. Our suggestion is to look at facts before you adopt this strategy.

    The strategy requires the stock allocation before and throughout the summer months to protect your portfolio against seasonal changes in trading. That means you would sell off stocks you own in May, then stay out of the market for the summer. When the autumn comes you would buy stocks back.

    In an academic study of the saying “Sell in May and go away,” we found that from 1998 to 2012 the returns from November to April surpassed the returns generated from  May to October by nearly 10%.

    Maybe this strategy is good because you’ll be out of volatility that might occur during summer, so you would be able to protect your portfolio from losses caused by volatility. Also, when you reinvest in autumn and do it just before stock’s upward trend you’ll probably generate better returns. The problem might occur when to seek what stock to buy and when to do that. In other words, timing the market is the key question.  

    That can be a critical part because timing the market isn’t a precise science. Actually, it is difficult for even the most skilled investors.

    The other benefit is that you would have a chance to re-evaluate your portfolio and remove losing players. But for this to do, you must have a great understanding of the market subtleties. For example, how a particular stock acts during different periods of the year. 

    For long-term investors, this strategy might be irrelevant but investors with a shorter horizon or for active traders it can be very profitable since they have a more active approach to investing.

    Drawbacks of this strategy

    Sitting out the stock market during the summer and having a long, long vacation might seem attractive, but you have to be cautious. What if there is the potential to miss out on great opportunities? The 

    This strategy is based on past trends. But here is the key problem. Not all investments or stocks will act according to this date-based investing, that to say.

    The “Sell in May and go away” strategy neglects the performance of particular assets or prevailing market or economic circumstances, changes in interest rates, or inflation, for example. Also, as you already know, everything and literally anything may influence the stock market. It might be the political atmosphere, natural disasters, change tariffs, etc. For instance, you sold your stocks in May but they hold strong during the summer. What the consequence can be? It will cost you your gains. No one has the ability to predict what the market will do during a few months.

    The impact on your portfolio is very important also when we talk about the “Sell in May and go away” strategy. It is very important, even if your stocks hold steady, to invest constantly, which means, you shouldn’t avoid summer investing. Otherwise, your portfolio could be hurt. 

    Time is probably the most influential tool you have as an investor. This is all about compounding interest and how long you are invested. That is the power of the time. If you go in and out of the market you will lessen the chance for your portfolio to grow. Also, to compound.

    The “Sell in May and go away” strategy can cause increased trading costs. Yes, online brokerages offer commission-free trading, but not all of them. Also, free trades could be set for stocks or ETFs but what if you sell options in May?  When you buy them back later, the fees could be higher which could lead to lower returns.

    Maybe the most important drawback of this strategy is that it could go against you. For example, the volatility is increasing in May and you decide to get out of the market because you’re panicked. Well, in June, for example, stock rebound, the prices increase. What do you have? You’ve missed the opportunity to get the returns.

    Bottom line

    Instead of “Sell in May and go away” strategy, sometimes rotation is a smarter move. This means, to not sell your investment and cash it out. It is better to diversify your portfolio to the assets that could be less influenced by the seasonal slow market growth. For example, the health or high-tech sector.

    For retail investors with a long-term objective, a buy-and-hold strategy continues as the best choice.

  • Concentrated Stock Positions Are Risky

    Concentrated Stock Positions Are Risky

    Concentrated Stock Positions Are Risky
    The worst-case scenario of holding a concentrated stock position is that the chosen company can bankrupt and the stock value drops to zero.

    Concentrated stock positions occur when you as an investor own shares of one stock in a big percentage of your portfolio. So your capital is concentrated in a single position. How big is that percentage? It depends on the size of your portfolio and the volatility of the stock. But concentrated stock positions commonly occur when that stock represents 10% or more of your overall portfolio. 

    The modern theory says that it can be any position size that may hurt your investment plan. So, we won’t be wrong if we say that concentrated stock positions are any portion in one single stock in your portfolio that have a major influence on your overall portfolio no matter if it is 5% or 55%. Generally, it is a position size that can destroy your financial goals.

    But nothing is so bad as it looks at first glance. Many people created their wealth by holding a single stock. So many families built a fortune in this way. The value of that stock grew heavily over time and the members of such a family inherit these concentrated stock positions, a large one that consists of just one stock.

    Don’t matter how the concentrated stock positions are earned, they always represent an unbalanced allocation of investments. Since the holder of such a portfolio needs to reduce risk, it is essential to understand it and maintain it properly. There are several strategies very suitable for handling concentrated stock positions.

    Strategies for handling concentrated stock positions 

    Have you ever heard a saying: “Concentrated wealth makes people wealthy, but diversified wealth keeps them wealthy.” It’s kind of credo among investors. Concentrated stock positions are challenging for managing. They have great risk potential included. So for that to be done, the investor needs a proper strategy.

    One of the most common strategies is selling the part of these concentrated stock positions or the whole holding on it. To be honest, that is the simplest way to reduce the concentration on the stock. 

    But there are some that may occur, for example, the capital gains tax is connected with selling. In order to decrease the tax, you don’t need to sell the whole position. Sell it in the parts. For instance, you can define an amount and sell one by one quarterly. Of course, you can choose a different time frame but the goal will stay the same, to reduce the concentrated stock position since you would like to reduce the exposure also. Depending on the position’s value it may take a few years unless the whole process is done. Some experts claim that 3 to 5 years is the optimal time frame for that.

    So you have two choices with this strategy: to sell the stock immediately or in portions over time.

    Hedge the position – a strategy for handling concentrated stock positions

    Those are actually two strategies but we’ll put them in one because they are connected. This is a bit of a complicated strategy but an effective one. Everyone wants to protect the owned stock against drops. You can do it by using options. So, think about the buying of put options as a kind of insurance against the potential losses in your stock. When you buy a protective put option, you’ll have the right to sell your stock, the whole or part of it, at a predetermined price. Don’t be worried if the stock price increases above the predetermined price. Your option will expire worthlessly and you’ll still hold your stock.

    This strategy is quite good if you need short-term protection, so think twice are you willing to use it because over the long run this strategy may cost you a lot.

    Also, you may sell covered call options. The strike price should be above the current market price. That will give you an extra income but the smallest protection against total loss if the stock price decreases significantly. Moreover, you’ll not benefit from price appreciation if you use covered call options as a strategy to handle concentrated stock positions. 

    Maybe you can use covered call options as a part of a well-organized selling process based on the market movements. Meanwhile, you get paid the premium.

    Diversifying

    It doesn’t mean you’ll make some small adjustments to your portfolios. Your main goal is to reduce the volatility that a concentrated position generates. And you cannot do that randomly, this diversification has to be exact.

    As we said, you can sell this large position at once but there are some problems that may arise. The most important is that you can reduce the value of your overall portfolio by doing so. For example, if you sell the whole position at once that could cause the stock price to drop in value. 

    Sometimes such a decision can be emotionally difficult. So, a staged sale can be a way to avoid emotional reactions when selling a large position. You can do this if you determine the number of shares of the stock you want to sell by a particular date.

    For example, you want to sell 21,000 shares of the stock over the next 21 months. And you decide to sell shares every quarter. There will be seven sales during this period, right? At the end of each quarter, you are selling 3,000 shares. This will not disturb you a lot, you have a schedule, your emotions will be under control, you don’t even have to think about the market fluctuation.

    Use the exchange fund 

    This method is useful when you find other investors in the same situation with concentrated stock positions and who want to diversify as you do. What investors have to do? What are their options? They can join their shares into a partnership where each investor gets a proportional share of that exchange fund. Since the stocks are not the same, each shareholder will have a portfolio of different stocks. That will provide diversification. The additional advantage of this method is that it provides the deferral of taxes

    The straightforward approach to diversify the concentrated stock positions

    It is rebalancing with a completion fund. We describe it above. It is simply selling smaller parts of your position over time. You can use the money you got to buy some other asset and have a more diversified portfolio. That’s how a completion fund operates. But as a difference from exchange funds, you are in control of your stock.

    For example, you own $10 million worth stock, and you want to reduce the exposure to this stock. But you would rather sell part of your position because if you sell $10 million in one transaction the taxes you have to pay would be expensive. So, you prefer to sell  20% of the position every 6 months, and use that money to diversify into other assets. Over time you’ll have a fully diversified portfolio adjusted to your risk tolerance. 

    Bottom line

    Some wealth transfer strategies could benefit you. For example, family gifting strategies, and charity gifting strategies such as direct gifts, foundation, or trusts.

    The most important is to have peace of mind. Holding such a great but only one stock that generated money for many generations is a great responsibility. But that kind of portfolio is very volatile and risky. So you have to be smart and find the concentrated stock positions exit strategy suitable for your circumstances and goals. Your chosen strategy has to increase your overall wealth. 

    These strategies can reduce risks, reduce the tax of reducing the position. They are worth seeking. If you still are not sure which strategy to choose, find a professional financial advisor.

  • Beginner Investment Portfolio- How Should It Look Like?

    Beginner Investment Portfolio- How Should It Look Like?

    Beginner Investment Portfolio
    These tips are kind of a guide to new investors for building a good stock portfolio. Selecting stocks needs analysis, time, and the ability to estimate different parameters for the stock, industry, and overall market.

    By Guy Avtalyon

    We are going to show you how a beginner investment portfolio should look like. Of course, if you think the stock market is getting crazy, you couldn’t be more right. DJIA is going up, going down, S&P 500 Index also. The graphs are looking like ECG of some very vulnerable hearts. Maybe you don’t believe it, but this is the right time to enter the stock market. A stock market is truly a wealth-building tool. Moreover, entering the stock market is easier than ever. But, as you are new in this field, you would like to know what to buy or, in other words, how a beginner investment portfolio should look like.

    There are so many ways to invest the money and can pick the level of risk you’re willing to take. So, it is obvious the first thing you have to decide – the level of risk you can tolerate.

    High-risk investments mean greater chances for high rewards. Wait, that also means bigger chances for losses. As a beginner investor, you should avoid high-risk investments if you don’t want your capital to throw through the window. Later, when you become more experienced and earn more cash, you’ll understand how to handle the risk, for now, here are some tips of how a beginner investment portfolio should look like

    We know that a lot of beginners think of investing as attempting to get a short-term gain in the stock market. But if you want to build wealth, you have to think about long-term investing. 

    Beginner investment portfolio in 2020

    ETFs

    The world of the stock market and investing can be confused for beginners. There are individual stocks, mutual funds, bonds, mutual funds, etc.

    Our first suggestion for you is some low-cost ETF. But there is a question: is it worth it? You’ll need time to build an individual stock portfolio.

    Exchange-traded funds (ETFs) can be an excellent investment way for small investors. You can trade these funds like stocks. They can give you to expand the diversity of your portfolio and to do that without spending too much time on it. 

    Here is how an ETF works. A fund provider holds the underlying assets. Such creates a fund to follow the performance of underlying assets. At some point, such a provider decides to sell shares in that fund to other investors. As a shareholder, you’ll own a part of an ETF, but you will not own the underlying assets in the fund. 

    ETF tracks a stock index. So, as a shareholder of the ETF, you’ll get dividends, which you can reinvest, for the stocks included to the index.

    ETFs are a passive approach to investing. Brokers will not charge you trading costs for ETFs. It is zero. Just make an automatic investment each week or month, it’s up to you.

    Include the gold

    Due to the coronavirus pandemic, the global economy is suffering. In the first quarter, only five main asset classes posted gains. Among them, apart from the US dollar and yen which are currencies, the list includes gold. Gold always was a great way to protect the portfolio and historically it was known as a safe-haven investment. It is the same nowadays. You can add some gold into your portfolio while you are waiting to come into stocks because today they can be too volatile for beginner investors. So, you should grow the exposure to gold. Gold works great when the dollar is flat-to-down. Also, gold can be a great hedge against inflation.

    Moreover, it performs best when investors are worried about low growth on other assets. Basically, if we take a look at its historical performances, we’ll notice that gold played best and rose fastest when other economic measures were falling quickly. We have such a situation today.

    We have negative interest rates, bond yields are almost zero, so gold could be a very good opportunity to hold it. Add it as very good protection to your portfolios.

    A beginner investment portfolio should include mutual funds

    Mutual funds are still amazingly popular. Especially target-date mutual funds in retirement plans, so add them in your beginner investment portfolio. Mutual funds are basically a basket of investments. When you buy a share in some mutual fund you are actually investing in all holdings included to the fund with just one step. 

    A target-date mutual fund usually is a mix of stocks and bonds. 

    How to invest in target-date mutual funds? 

    For example, you plan to retire in 20 years and everything you have to do is to pick the fund with 2045 in the name. But you have to know, so don’t be surprised, the fund you choose will hold stocks essentially. How is that possible? Your retirement is far away, and stocks have higher returns in the long run, higher than any other asset. As time goes by, the fund manager will shift part of your investment toward bonds because they are less risky. You wouldn’t like to take too much risk while you are approaching the date of your retirement.

    Add Index funds to the beginner investment portfolio

    If you don’t want to employ a manager to create and manage your beginner investment portfolio, index funds are a good choice for you since they track a market index. What is the market index? It is a collection of different investments that represent a part of the market. For example the S&P 500 Index. It is a market index that covers the stocks of about 500 biggest companies in the US. So, an S&P 500 index fund will reflect the performance of the S&P 500, by purchasing the stocks in that index.

    Index funds represent another passive approach to invest just like ETFs. They carry lower fees charged based on the sum you have invested. The advantage of these funds is that some brokerages offer a range of index funds without an established minimum. So you can start investing in some index fund at $100 or less.

    Help to create the portfolio

    For example a robo-advisor. Let’s assume you would like to invest but you’re not the DIY type. Well, we have some good news for you. You have a lot of robo-advisors out there. They will handle your investment by using very complex algorithms. But don’t be worried. It will cost you less than a human advisor, usually, it will be from 0.25% to 0.50% of your account per year. Also, robo-advisers will let you open an account without the minimum required.

    Robo-advisors are an excellent way for beginners to get started investing. Look, you are a beginner and you don’t have good knowledge about investing yet. So, robo-advisors will do all that hard work for you and you’ll need a little money for them. All you have to do is to check your portfolio from time to time. So to say, it’s your money invested. Also, they will give you a chance to learn more about investing since they’ll provide you tools and educational material.

    Investment apps are also extremely helpful. You can easily find some aimed at beginners.

    Traders-Paradise recommends

    For example, M1 Finance is excellent if you want to build a free portfolio for long-term investments. This app offers commission-free investing, automated deposit, buying fractional shares, and has many other features like free maintenance of a portfolio, diversified portfolio, etc.

    Fidelity is another great app that offers full service at zero trade prices. It allows you to invest for free, a variety of ETFs that it offers can help you to build a well-balanced portfolio, stocks, or options trades and all for free.

    TD Ameritrade offers free options trading. If you want to become a trader rather than an investor, it’s a really good pick for you. We already wrote about this app but we would like to point again how excellent it is. For example, its platform “Thinkorswim” is one of the best. It will not charge you a commission for trading stocks, options or ETFs.

    After deeper investigation, you might choose to invest in the companies that offer the chance for growth. Just keep in mind, your portfolio has to be diversified. Never expect that each stock can generate great returns. That is the reason for diversification. It appears especially when we are talking about a beginner investment portfolio. But that doesn’t mean you’ll need a large collection of investments. You’ll need just a few stocks but they have to run together in your favor.

    Today’s volatile stock market offers discounts on great stocks. So, this is a great time to start investing and create your beginner investment portfolio that will generate you amazing gains in the future. 

Traders-Paradise