Category: Traders’ Secrets


Traders’ Secrets is something that everyone would like to know, right?
How is it possible that some traders are successful all the time while others fail to make a profit all the time?
That is exactly what Traders’ Secrets will show you.
Traders-Paradise’s team reveal all trading and investing secrets to you, our visitors.

What will you find here?

How to find, buy, trade stocks, currencies, cryptos. You’ll find here what are the best strategies you can use, all with full explanation and examples.
Traders-Paradise gives you, our readers, this unique chance to uncover and fully understand everything and anything about trading and investing. The material presented here is originated from the experience of many executed trades, many mistakes made by traders and investors but written on the way that teaches you how to avoid these mistakes.

Moreover, here you’ll find some rare techniques and strategies that are successful forever, for any market condition. Also, how to trade with a little money and gain consistent returns. By following these posts you’ll e able to trade with greater success. You’ll increase your profits and your wealth, of course.

The main secret of Traders’ Secrets is that there shouldn’t be any secret for traders and investors. Rise up your trade by reading these posts, articles, and analyses!

You’ll enjoy every word written here. Moreover, after all, your trading and investing knowledge will be more extensive and effective.

Traders’ Secrets will arm you with those skills, so you’ll never have a losing trade again.

  • Gain of 15 percent Yearly When Trading – Is it Possible?

    Gain of 15 percent Yearly When Trading – Is it Possible?

    Gain of 15 percent Yearly When Trading - Is it Possible?
    One of the journalistic truths is that if an article is titled with a question, most often the answer is “no”. But in this case, it is “it depends”.

    By Gorica Gligorijevic

    Making money is the aim of markets, and the gain of 15 percent yearly is often a goal of individual investors. In the colloquial speech “beating the market” means having the return on investment higher than the S&P 500. Since this index was established in 1926, it has posted on average just a bit over 12% gain annually. Which makes striving for 15 percent yearly gains an appealing target to aim for. But the gain of 15 percent yearly is possible. Especially in this world of relatively frequent market corrections and downturns?

    One of the primary characteristics many famous traders are looking for in potential stocks for investment is having an average yearly growth over a number of years of 15 percent or more. The fact that big and successful traders do make investments in stocks says more than anything that such gains are out there waiting to be earned. But there are two schools of thought on this subject matter. One is saying that it is impossible and other, that it is possible to achieve a gain of 15 percent yearly or even more profits per year on the market.

    Why is the gain of 15 percent yearly not possible?


    One of the most common arguments among the members of this school of thought is the historic data, particularly for the past 20 years. One of the most cited sources is the J.P.Morgan Asset Management’s data which paints a bleak picture of annualized returns. The absolute bottom of all investment classes in their study is taken by the average investors with just 1.9% returns. The top of the pack is the real estate investment trusts with just 9.9% annualized gains in this period.

    And when you look at those numbers it does look impossible to reach a gain of 15 percent yearly. 

    But among them are also those that point out that this number is by itself a misleading measure. And the math does back them. Because simply put, an average is calculated by adding up all numbers and dividing the sum with how many numbers you have. And it doesn’t reflect how much money you end up with after a certain number of years. 

    For example, if you invest $1,000 and in the first year you have 100% gains but in the second 50% losses, your average return is

    (100-50)/2=25%. 

    But in reality, you have no gains at all. After the first year and 100% increase, you have $2,000. But after losing half of that in the second year, you are back where you have started. With $1,000.

    The influence of CAGR

    Often, they would point out that the compound annual growth rate (CAGR) is a more precise metric, especially for a long term investment. The point is that it captures the compound effect of gains. In other words, average gains show only the average of percentile changes over some period of time. The CAGR shows at which rate your investment actually grew.

    Another argument is that the long term averages, either the arithmetic mean or CAGR, are a misleading measure due to fundamental changes in the markets in recent times. Market corrections happen more often and are caused for different reasons than back in the old days of the 20th century. Thus, over the long-term decreasing the annualized gains even more.

    The third and most common argument is that only the best of investors have ever beaten the market. People like Warren Buffett, Seth Klarman, Benjamin Graham, and so on. Long term value investors, who have gained fame and fortune by extraordinary means. That the average Joe at best can hope to equalize the track record of indices in the long run.

    Why is the gain of 15 percent yearly possible?

    To understand why it might be possible to have a gain of 15 percent yearly when trading you first need to understand that most of the arguments against such possibility are concerning the long-term investments. The buy and hold strategy. And that they are painting the generalities, while precise and correct, fail to present a more granular image of markets.

    Many will point out that the paradigm of the markets has changed. That the real profits are in the “buy and protect” strategy. While it can be costly, smart protection of your profits can yield considerable annual gains.

    Another group of proponents points out the fact that in the 21st-century markets are marked by considerable short-term swings. So that profits are in the swing trading, buying low and selling high while holding stocks just several days or few weeks. This type of trading can bring high and fast profits, but also high and fast losses. Thus, they warn that you should arm yourself with knowledge if you want to achieve a gain of 15 percent yearly.

    Educate yourself 

    Looking for patterns with increase and fall, and thus guessing accurately when to buy and when to sell. Also, collect data about the stocks you wish to invest in. patterns emerge and disappear, and the inherent volatility of the markets is an opportunity for making profits. 

    Studying the historical data of a limited number of stocks can give you insight into a very probable future movement of the prices. You should aim to get in the market at the right time and also exit at the opportune moment. And many will suggest you to not throw your net very wide, not to study too many stocks or look for too many different patterns. To concentrate on quality and not quantity. And always, make sure to have set a stop-loss.

    Try day trading

    The most convincing argument comes from day traders. It can be done very easily, but it comes with a risk. Day trading amounts to entering a trade at a certain predetermined point and exiting at a similarly predetermined point. All after just a few minutes or maybe a couple of hours. 

    Achieving the gain of 15 percent yearly when trading is very easy if you look at it in a certain way. That it is a large number of trades with relatively modest gains on average, in a relatively large period of time. Day trading can involve almost any financial vehicle, but the most popular are stocks, futures, and forex. 

    Quick, relatively small trades compared to multi-million investments you can hear about in the news can bring you a tidy sum in profits on a daily level. And if you are not greedy and use a system which can net you a 50% or more success rate, little by little it adds up.

    A portfolio that can yield a 15% gain per year

    One of the journalistic truths is that if an article is titled with a question, most often the answer is “no”. But in this case, it is “it depends”. If you are looking for a long term investment conventional wisdom is that it will be almost impossible to create a portfolio on your own. And such that could have a gain of 15 percent yearly from trading. Your best option is an investment into ETFs of well-known super-traders and established fund managers with a solid track record. That could, in the long run, net you around 10% per year. 

    But, if you decide for short-term trading there is money to be made in the markets. Markets are by nature volatile, and that presents the risk. But even the steepest market downturns are not straight lines but have a lot of small upticks along the way. And these are the opportunities, which if seized can give you a gain of 15 percent yearly when trading. 

  • Low-risk Options Trading Strategy

    Low-risk Options Trading Strategy

    These low-risk options trading strategies are commonly used for trading stocks but they are suitable for any market you would like to trade.
    By Guy Avtalyon

    Low-risk options trading strategy should be cleverly defined. It is a whole different story from any other trading.  Options trading means a bit more security. How? Instead of estimating what price the particular asset will hit, you can enter the opposite position and speculate which price it will not hit. Sounds weird? Absolutely not. Yes, for some people this whole world of puts and calls may sound scary but low-risk options trading strategy is one of the easiest ways to make money.

    For example, you can take a position called a covered call which is one of the safest. So, instead of talking a lot, let explain this low-risk options trading strategy. 

    Covered call as low-risk options trading strategy

    This can be an excellent method to increase your profit. This strategy means to sell the right to buy a stock that you own, at a specific price, on a determined date. You’ll receive the premium when selling a contract, and you’ll receive it immediately. The best part is that you’ll profit even if the stock price doesn’t change, no matter if it stays the same or drops. The buyer, to whom you sell the contract, can make a profit only if the stock price increases within the specified time frame.

    So, you’ll have better chances than the buyer of doing well. And, don’t forget this, you’ll get the premium. You can use it to protect your trades in other positions you take if they are risky. 

    For you, that are new in this field, use the stock you already hold. In case you lose on the contract you’ll have the stock to simply give. Keep in mind that the call is only valid until the expiration. If the stock price stays below the strike price, then you’ll keep the profit or cost reduction. You can do it over and over again with the covered call. In this way, you’ll continue to reduce your cost and increase protection against unfavorable moves in the stock.

    Collared Stock

    Collared stock, or ‘collars’, are similar in approach to a covered call. In this strategy, you should start with a covered call. But the difference is that you will not take a premium to reduce the cost of your positions. Instead, you’ll take that profit to buy a put option and use it as added downside protection. By buying the put option, you’ll get the right to sell your stock at the strike price. And the best part, despite anything that could happen, you’ll have the right to sell that stock at the strike price. Frankly, this put option is the best stop-loss you can buy.

    This strategy is suitable after a large run-up in the stock. Also, when the investor assumes there is a notable downside.  You can tune Collared stock to take the remaining risk out of the stock position. How much it will be, depends on the position of the call and put options strike prices relative to the current price.
    For example, if you got $1.80 for the sale of 115 call option.

    How much put to buy?

    Let’s go further. If you have, let’s say the 110 put costs $2,75 and 105 put costs $1,15, you have a tradeoff. So, make it. The other solution is to buy the 110 strikes that will give you almost the full protection. Or you keep a bit risk on the position and purchase the 105 strikes. For the first solution, you’ll need more money, you’ll have to pay an extra amount of $0.95 for the protection. It can be a rocky path. Instead, buy the 105 strike puts. By entering this position, you’ll save $0.65 in cost reduction.

    Can you see it? This strategy means to take off as much as a possible risk from stock you can. The point with tradeoff is to take upside reward with the most risk you take off.

    In essence, it’s almost the same when you’re selling the stock. The potential risk is big, so the reasonable question is why shouldn’t you sell the stock instead? It’s simpler. Anyway, this strategy is broadly used by hedge funds to limit the market’s moving.

    Short Put or Naked Short Put

    Nothing indecent to see here. All you are performing is writing a put for the premium, or the credit from selling the put. It is alike as a covered call but without the stock.

    When you sell the put, you have an obligation to buy shares from the counterparty at the strike price if they decide to execute the contract. You’ll sell a put when you suppose the stock price will go up or stay near to the current price. But, if the stock increases, you’ll keep all the money you got from the sale.

    But there is another way also. You can use writing puts to be paid to wait for the price to pull back. And then enter the stock. In essence, you’re paid to take the risk of some other trader’s stock. Your hope is the stock will pull back and the option will be exercised by the owner of the stock. So you’ll take delivery of the shares. 

    This strategy is excellent while the markets are high. Well, what will happen if you don’t want that stock or the price suddenly drops? The premium will compensate for the drop. Same as with a covered call. If you try this with stock instead of the options, there will be no compensation. 

    With short put, you’ll have lost less than you can in stock trading.

    Generally, short puts outperform covered calls in risk-reduction trade-offs but unfortunately not in all market conditions. There is a concept in options trading known as the “volatility smile”. It points out that markets are more terrifying than greedy.  Remember, since a short put doesn’t have stock in the position, you’ll need to be very active to stay invested.

    This is a kind of leverage, so you’ll have to use it very carefully. The beginner traders should approach short put trades with the knowledge that they could be forced to buy the stock at the strike price of the put they sold. It’s very reasonable to keep aside enough money to buy the stock if you are assigned.

    Risk Reversal as low-risk options trading strategy

    With options, the focus is on implied volatility. This means, when the market falls, implied volatility increases, and vice versa. The market becomes rougher when stocks decline and more pleasant when stocks grow.

    A risk reversal copies buying stock. That means you’re selling a put and then using those profits to buy a call. But as a difference from the stocks, in this position, you’re taking advantage of the already mentioned volatility smile. It will allow you to spread out the exercise prices and take additional advantage of volatility differences. 

    This low-risk options trading strategy is a great method to employ for a big move up in stock. But, you’ll not be allowed to play in the zone between the put and call.

    Put Spread 

    So far we mentioned the low-risk options trading strategy that trades upside for downside protection. But there are other low-risk strategies for options trading.
    When you trade a position that has direction there is one obvious risk that won’t go away: the risk that you’re wrong in gauging what is the future direction of the stock. In options trading, you don’t need to trade a direction. You don’t have to determine if a stock will grow or decline. Instead, you can trade volatility and time decay. One of the lowest risk strategies is the calendar spread. The calendar spread is when you sell a near-term put and buy the same put but with the later expiry date.

    For instance, you sell the March 100 put and buy the April 110 put.  So, if we know the pricing is based on the future value of the stock, the more time the option lasts, it will lead to more value. That is the benefit of the calendar spread.

    But why would you need to do this? Simply, to benefit from the time and volatility changes. This isn’t the most exciting strategy but in trading, less is more. In other words, less excitement means less risk.

    Low-risk Options Trading Strategy

    How can you make money?

    Easy! As you go closer to the expiry date of the first put contract, its value will decline every day more than the longer-dated put. But you’ll have to stay close to the current trading range. Meaning, take advantage of the time decay of a short put. This is the way to have a steady increase in profit as long as you stay in the range. Don’t wait for the expiration date. Wait until 15-25% of the maximum return. You’ll have a nice profit.

    With these low-risk options trading strategies, you’ll have some of the tools needed to add to your portfolio. These strategies are commonly used for trading stocks but you can also buy calls and puts if you want to trade cryptocurrencies. In trading any market, it is very important to be equipped with the knowledge of how to take lower risks and maximize the profit.


    More articles on this subject:

    >>> Low-risk Options Trading Strategy

    >>> Mistakes in Options Trading – How To Avoid Them?

    >>> How Options Trading Make Money?

    >>> Greeks In Trading Options As A Risk Measure

    >>> What Is Options Trading Examples

    >>> Trading Options – Understand the World of Options (Full tutorial)

    >>> Short Call Option Strategy Explained


  • How to Identify Trend Reversal?

    How to Identify Trend Reversal?

    How to Identify Trend Reversal?
    Some strategies can help you to identify trend changes even before they happen.

    If you want to know how to identify trend reversal ahead of time, we’re sorry but it doesn’t exist. There is no trading system or methodology capable of doing that. The only thing you can do is to learn how to read the price action and identify potential zones where the market could reverse. 

    So, how to identify trend reversal? It appears when the direction of stock changes and goes back in the opposite direction. The examples of reversal are uptrends that reverse into downtrends and vice versa. What trend reversal tells us? First of all, the sentiment in the stock is changing. For example, an uptrend that reverses into a downtrend tells us that traders are taking profit from the overbought price of the stock. 

    On the other hand, when downtrend reverses into the uptrend shows the sentiment is changing to bullish. That means the buyers are boosting bids to reverse back into the bullish trend. Let’s examine several indicators that might help us to understand how to identify trend reversal. 

    Why is it important to know how to identify trend reversal? 

    The main importance lies in the fact that if you recognize the trend reversal on time, you’ll be able to exit the position in profit or at least, to protect your trade from extended losses. But the trend reversal also gives you a chance to profit if you trade in the opposite direction.

    But there is a problem to recognize the start of the trend. We can spot the new trend only when it is already formed. It is visible after the new direction starts. The other problem is that you don’t see just one trend. Let’s say that the time frame you’re trading may have a trend that differs from the other on the lower or higher chart.

    Use Moving averages to identify trend reversal

    Traders broadly use moving averages to identify trend reversal and as alert of the “potential” start of a new trend direction.

    Let’s say the price passes a moving average and goes above it, that could be a sign that an uptrend has just started. Hence, when the price goes below the MA indicator, the downtrend is starting. 

    For example, in forex trading, use two MAs, one slower and one faster. When the faster MA crosses the slower MA, it is a confirmation that the new trend is developing. But you have to be careful because technical indicators can lag prices. So, you will be late for any trend change. In the best scenario, you’ll recognize a new trend, not at the start, but very close to. Still, moving averages, particularly the 200 periods moving average, are helpful indicators that may show a trend reversal.

    How to identify a trend ending? 

    Trends aren’t highways. You cannot just start the engine and drive from point A to point B.  What we can do about trend reversals is to estimate its probability to happen.

    For example, while you are trading in an uptrend direction, you can notice on your chart that something may show the market has a high possibility of reversing.

    Bullish and Bearish – how to identify trend reversal?

    An uptrend is bullish price development that proceeds to make constant higher highs and higher lows. A bullish reversal appears when the stock stops making higher highs and begins to make lower highs and lower lows. In other words, it reverses the direction from up to down. 

    A bearish trend reversal develops the same formations but inversely. In a bearish downtrend, the price action creates lower highs and lower lows. When the price ends forming lower lows and establishes a higher low and remains to rise with higher highs and higher lows, it is a bearish trend reversal.

    Different time frames

    How to identify trend reversal on different time frames? 

    The high and lows can differ depending on the time frame chart you use. Let’s explain this. For example, you use the 60-minute and 5-minute charts. In the 60-minute chart, you can see a range of lower high and lower low in a downtrend. But, your 5-minute chart can show the uptrend where higher highs and higher low candlestick closes.

    This means, your 60-minute chart shows the overall constant trends but your 5-minute chart can show a different tendency. It shows moves back to the longer time frame resistance. Here are two possible scenarios. The price will return back down is one possible scenario. The other scenario could be, the price may continue to bounce and reveal the early trend reversal attempt. The time frame you are trading is very important. It has to be aligned with a more extended time frame trend.

    How to trade trend reversal

    You can trade trend reversal at different points during the reversal process.

    The first important thing that you must keep in mind is to regularly maintain trailing stops. It is important in case the reversal turns out to be a fake. Usually, trend reversal starts as a move that fails to bounce but finally succeeds in reversing the trend. The point of reversal is a break: breakout or breakdown. It is followed by the opposing trend direction. The uptrend will ultimately top.

    As the price tries to bounce again, it is faced with greater selling pressure. So, it starts to produce lower highs and lower lows to finally break support and forms the downtrend

    Of course, this trend reversal has to be confirmed. If you enter the position in anticipation of a reversal without confirmation,  that may expose your trade to a risk of getting a fake signal. Also, your stop-loss will be triggered and you’ll exit the trade without profit. 

    If you enter the trade based on the confirmation, your entry point can be too far, so you’ll profit a little. Also, you could get stopped low on the reversion.

    How to have a proper execution?

    After you get the confirmation, wait for the first attempt and enter the trade close to the reversal support zone. You’ll have enough time to enter the trade if you use some of the popular methods to confirm the trend reversal. 

    For example, you can use trend lines. They are a simple method of visually recognizing trends and reversals. You’ll need to draw the trend lines ahead of time and to actively monitor. It’s simple to draw the trend line. Just connect the highest high and the lowest high to make the upper trend line. To draw the lower trend line, connect the lowest low and the highest low. 

    Trend lines could be diagonal or horizontal. If both trend lines are moving up or down together diagonally, they are in an uptrend or downtrend. How to identify trend reversal occurs? If the opposite trend line of the trend gets breached and then developed in higher highs and higher lows we have downtrend reversal in a breakout. Hence, the lower highs and lower lows represent an uptrend reversal.

    In case both trend lines are horizontal,  it is a consolidation that will finally end as a breakout or breakdown. 

    Bottom line

    There is no system that can tell you how to identify trend reversal with total precision. The only chance we have is to watch the price action and identify the potential zone where the market could reverse. So, we have to identify the weakness in the trending move, and strength in the retracement move. The also important signal is a break of support and resistance. Some other indicators could be a break of the long-term trendline, or if the price is coming into the higher-timeframe formation, or goes parabolic. Also, pay attention if the price is overextended.

    The more concentrated circumstances there are, the greater the possibility of a trend reversal.

  • Morning Star Pattern How To Trade It?

    Morning Star Pattern How To Trade It?

    Morning Star Pattern How To Trade It?
    How to identify the Morning Star pattern, how to trade it? Is it bullish or bearish? Is the Morning Star pattern good or bad when seen in the chart?

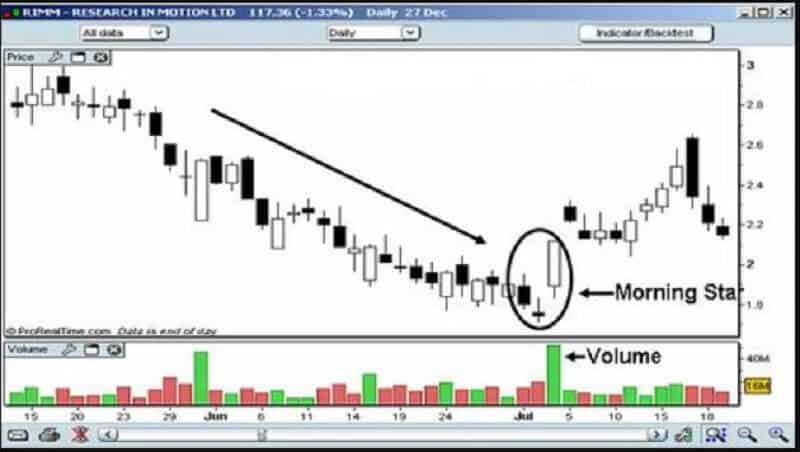
    To know how to trade this pattern we have to know what the Morning Star pattern is. First of all, you have to look at three candles and are near the support level. If yes, to have the Morning Star pattern, the first candle has to be bearish, the second has to be doji, and, finally, the third has to be a bullish candlestick. This third candlestick is important because it creates a bullish reversal pattern. So, logically, the Morning Star pattern is a bullish reversal pattern. At first glance, it may not look as bullish but we’ll explain to you how to recognize this pattern when it appears. Also, Traders-Paradise will introduce you to some trading techniques related to the Morning Star pattern. 

    This pattern will always tell you that something good is on its way. Bullish traders will always look for this pattern because a great reversal may occur. 

    The advantage of Japanese candlestick patterns is that even one candle has the whole story but when they are arranged together, you’ll have the novel. In terms of trading stocks, you’ll have the pattern that will tell you when your stock is going to breakout or breakdown. What is more important, when using the Morning Star pattern, you’ll know everything about the emotions of traders. For example, if you see long-legged candlestick, you’ll know that there was a hard battle among bulls and bears but without progress or change. At the end of the trading day, they are both pushed to the starting levels. 

    Therefore, understanding of candlesticks and their purposes is essential.

    What is a Morning Star pattern?

    We’ll need three trading days to be sure the Morning Star pattern appears. As we said earlier, this pattern is bullish but the first candlestick is large and bearish. That is due to the current trend and the first candle is in harmony with the trend. The second candle you’ll recognize when you see a small real body. It is a doji. This doji reveals hesitation and it’s followed by the third candlestick which is bullish. This third candle should be a large bullish one (the charts aren’t perfect, so how big is this third one, doesn’t really matter at this moment), so it tells us the bulls are coming back. They want to take over.

    So, the first day the bears have absolute control. The candlestick from the next day will tell us that there was a battle between bears and bulls and one of them is in control but yet it isn’t known which one. That’s something that doji tells. Still, we don’t know who is the winner so we have to look on the second day as on the day of indecision. We’ll understand who has a control on the third day when the bulls actually are knocking down the bears and winning the battle. So, the new direction on the stock price is starting. The price reversal is here.

    How strong is the reversal? 

    Well, we have to consider several signs to be able to conclude that.

    The longer the candles, the higher reversal. Further, the reversal will be higher if there is any gap on both sides of the middle candlestick of the Morning Star pattern. 

    To make this clearer, the second candle is the star. It has a short real body, separated from the real body of the first candlestick. The gap between the real bodies of the two candles separates a star from a doji or a spinning top. The star may appear in the shadow of the first candle, it isn’t necessary to form below the low of the first candle.

    The appearance of the start is the first sign of bears’ weakness. They are not strong enough to push the price lower than the closing price on the prior day. The third candle will confirm their weakness. This third candle has to be lighter in color. Actually, the middle candle can be red or green or black or white because the bulls and bears are going to balance out across the session.) in the charts and pierces into the body of the candle from the first day. 

    Also, if there is a gap between the first and second days. Here we came to the size of the third candle. If this candle is higher than the candle from the first day, that means the greater the bullish takeover. 

    How to trade Morning Star Pattern?

    We already said the Morning star pattern is a sign for the start of a trend reversal. From bearish to bullish. Well, you have technical indicators on disposal that may help you to unveil the Morning Star is going to form. For example, when the price is nearing a support zone. The other indicator could be when RSI confirms that the stock is oversold.

    Also, pay attention to the volume. It can be a great contributor to the forming of this pattern. When the volume increases during the three trading days and on the third day it’s the highest that’s the confirmation of the Morning Star pattern followed by the reversal.

    You should take up a bullish position in the stock when the Morning Star forms. Then, ride the uptrend until there is an indication of an added reversal. So, it’s important to notice when the first falling bearish candlestick is going to form. Further, monitor for the second smaller candlestick which is spinning top or doji, as we explained above. Plan your stop now. When the third candlestick is formed it is a bullish one, wait until it breaks above the third and take a long position. If you go long, set your stop below the bottom of the last candlestick. Some traders would wait until the price drops below the third candlestick and then enter a short position and set a stop above that candle. 

    Bottom line

    This pattern is a bullish reversal pattern. That means that buyers (bulls) take control of the sellers (bears) and push the price in the opposite direction.
    Trading completely on visual patterns can be a risky plan. The Morning Star pattern is best when it is supported by volume and a support level, as the back indicators. It isn’t hard to notice this pattern. It will appear whenever a small candle occurs in a downtrend.
    Whatever the candlestick pattern you use, you have to understand that there are many variations of it and on it. But one thing is sure, the Morning Star is a bullish reversal pattern that tells us that some good things are going to come.

  • Lies About Stock Investing And Trading

    Lies About Stock Investing And Trading

    Lies About Stock Investing And Trading
    To know about stock investing is something that will pay you off for the rest of your life. 

    By Guy Avtalyon

    Several years ago Forbes published an interesting article on the topic lies about stock investing and trading. The headline wasn’t exactly like ours but something similar. If you’re interested to read the whole article try to find it in the archive.  

    Brokers, financial gurus, even governments lie to us about global warming, the national economy, giving us false promises, lie about the stock market, taxes, or the national debt. We are also faced with so many lies about stock investing and trading. What we really need is the truth even if it isn’t pleasant.

    Since the Traders-Paradise team thinks that an honest approach is necessary to this topic, we collected several unbelievable lies about stock investing and trading. Investing and trading are very serious jobs and any investor or trader doesn’t deserve to get lies instead of the whole truth. They have to survive this tough business. However, it’s impossible without telling the truth. 

    What are lies about stock investing and trading?

    The first lie is that we should beat the stock market! Why should anyone want that? Why is it such a big deal? Theoretically, when you pick the stock randomly you have 50/50 chances of beating the market. Your stock will perform better or worse compared to the overall market. Yes, we know! The point is to hold some stock with a better return than investing in, for example, some index fund. When you want to buy the stock that is advertised as winning one, count how much fees you have to pay when buying and later, when selling. This means the return on that stock has to be much higher than you can see it at first glance.

    Beating the market means the great risk involved. If we know that only 2% of stocks can match the market well, so your stock may not be able to beat the market all the time. So, be prepared to lose money most of the time. The main problem is in your capability to gather the true information about the company which stock you’re buying.

    Honestly, it is almost impossible unless you’re an insider. No matter if you’re buying a hot-stock. You’ll have zero guarantees that it’s able to beat the market. Past performances will not guarantee you a big future return. This led to the stock buying to the level of casino games. Meaning, you can beat the market from time to time but you’ll fail to do that in the long run. If nothing else, the transaction costs will get you. So, beating the market all the time is one of the lies about stock investing and trading.

    Investing and trading are risky, the stock market is volatile

    The stock market is fluctuating, it will go up and down. Investing is risky but there are so many strategies to reduce investment risks. The possibility to make money on the stock market is bigger than the possibility to lose. What you have to do is to follow some rules and avoid randomly picking the stock. Also, with a strongly created investment portfolio, diversification, and strong risk management, your chances to profit from stock market volatility are bigger. 

    We wrote about risk management so many times. Also, if you add new info for every trade in your trading journal, you’ll have the pattern in hand. Hence, you’ll be able to act on time and protect your investment if it is necessary or place the trade at the right time and exit in profit.

    If you hold a large portfolio of stocks over a long period, for example, 20 years, you’ll be able to significantly reduce the risk of losing your capital. There still will be some risk but reduced.

    Also, traders and investors should consider how realistic it is to ride out the ups and downs of the market over the long-run. What will you do when the economic downturn comes, for example? Will you sell your stocks to fulfill the gap made by a potential job loss? Some life events could make it difficult for some of you to stay invested. But if you have a trading plan and stick to it, everything is easier. So, stocks are risky investment is another lie from the corpus of lies about stock investing and trading. The stock market is volatile, also, it is a lie because that risk is part of your plan and you’re counting on that when trading or investing.

    In the stock market, you’ll lose all your money

    This is one of the biggest lies about stock investing and trading. Behind this lie stand incredible lack of knowledge and misunderstanding of where the money is going. The stock market is a zero-sum game. The total amount of money invested is what you have there. If you want to profit, someone else has to lose. That’s the whole wisdom. The truth is that you’re not going to lose your money there. Yes, from time to time the price of your stocks will change in value. The prices will go up and down, that’s the way the stock market operates based on supply and demand. 

    Also, the truth is that stocks can be a good way to earn an investment return over a longer time. If you take a look at historical data you’ll find that, for example, that market indexes, for instance, the S&P 500 have been better than average. When you look at long periods, there were fewer negative years than positive. 

    What investors have to do is to find a balance. This means understanding how the risk of investment works and how much risk you’re willing to take to earn a satisfying return.

    It’s difficult to invest

    This is also, one of the lies about stocks investing and trading. This is a story about Average Joe. Well, Average Joe is completely capable of managing his investment, and, for him, it isn’t difficult to invest. Moreover, he has done decent research and trade according to them. In the stock investing, you could have a lazy portfolio or any other that will never confuse you. But let’s go back to the first among many other lies about stock investing and trading. When you hear someone claiming that it is hard to invest in stocks, just recall the first lie mentioned above – beating the market. It’s hard to beat the market constantly if not impossible. But in a long-term investing or active trading you can easily cover your losses

    Yes, you can find some surveys out there that show the average investor has underperformed the market during the past two decades. But the point is that you can’t be a professional trader if you spend a few hours per week analyzing the market and stock performances. You’ll need more time to dedicate to it. You’ll have to be fully focused on your investments. 

    But you don’t need to beat the market. Keep in mind data. Data shows that the most successful investors are not right all the time, they are right below the 60% of the time. Isn’t it interesting when you know that Warren Buffet is wrong 40% of the time? So, why should you be right all the time and beat the market constantly? To be honest, it’s impossible. 

    Investing requires a lot of time – No!

    This is completely one of the greatest lies about stock investing and trading. This particular lie can be true if you look at professional traders, people whose job is to trade stocks every day. For the average investor as the majority is, one hour per week to start investing in the stock market is quite enough. Don’t even think that you don’t have that time. If anybody thinks that investing requires a lot of time it is due to a lack of knowledge about how the stock market works.  

    Yes, investing means engagement but your effort will be prized by profits. Actually, investing is a much better way to earn than savings. That was good news. The bad news is that you can’t learn to invest while sitting in the pub and drinking beer, for example. But here’s another good news. To learn how to trade or invest all you need is a little bit of time, basically, the rest is so simple. And the most important, investing could make you rich. Are you ready to drop it? 

    Did you ever catch yourself thinking:
    “I’m too old to learn new things.”
    “I’ll never reach my goals.”
    “I was born this way, I’ll never change?”

    The thing is, many people believe that once we hit a certain education, our personality becomes so rigid that it’s hard for us to grow and learn more. But this is nothing but a lie! When it comes to investing in stocks all you need is a bit of time and willingness. Investing doesn’t require a lot of time. Face these lies about investing.

    The biggest lie about stock investing and trading

    Maybe the biggest lie is that you have to know a lot about investing. Having in mind the way of investing today, you have to know nothing about it. Nothing at all. What you must have is an investing goal. The investing itself is actually automatic, you can find so many investment services available online. For example, start with some robo-advisor. You’ll pay the fee but not too much. Also, one of the lies about stock investing is that you need a lot of money to start. The truth is that today you can easily find a trustworthy investment platform that will allow you to start investing with a little money, for example, $100.

    Don’t let these lies about stock investing keep you from investing. The consequences of not investing are bigger.

  • Inverted Hammer Candlestick Pattern

    Inverted Hammer Candlestick Pattern

    (Updated October 2021)

    Inverted Hammer Candlestick Pattern
    Inverted Hammer candlestick pattern occurs essentially at the bottom of the downtrend and can warn of a possible reversal upward

    Inverted Hammer candlestick pattern is visible on a chart during the higher pressure from buyers to push a stock price up. It is a bullish reversal pattern. This pattern is identified by a long upper shadow and a small real body. They usually appear following the real longer black body. It’s pretty similar to the Shooting star candlestick pattern. Inverted Hammer occurs in a downtrend. In trading charts, you’ll notice a long black candle visible on the first day of appearance. On the next day, you can see how a small real body develops. It will occur at the lower end of the range. The candle for the second day will have an upper shadow, two times longer than the real body, and will not have a lower shadow. Don’t pay attention to the color of the real body. It isn’t important at this moment.

    What does the Inverted Hammer candlestick pattern tell us? 

    The long upper shadow indicates the buying pressure after the opening price. It is followed by significant selling pressure but insufficient to bring the price down, below the open. However, we’ll need bullish confirmation that may come as a long empty candlestick or a gap up, but followed by a heavy trading volume. 

    Inverted Hammer candlestick pattern tells us that bullish traders raise their confidence. The top of the candle is made when bulls push the price up the farthest they can. The bottom of the candle shows the bears attempting to resist that higher price. Bears are short-sellers. Still, the bullish trend is extremely strong, and the market is settled at a higher price. 

    Also, an inverted hammer candlestick pattern tells us that there could be a price reversal as a result of a bearish trend. Keep in mind, never observe the inverted hammer candlestick pattern solely. You’ll need confirmation of other technical indicators. Ultimately, check your trading plan before trading the inverted hammer. 

    What is the Hammer candlestick pattern?

    A hammer pattern in candlestick charting is a price pattern. It happens when an asset trades lower than its opening price, but the rally is formed inside the given period, for example, one trading day, to close near the opening price. The pattern looks like a hammer. The lower shadow is a minimum twice the size of the real body. The body of the candlestick signifies the difference in the opening and closing prices and the shadow tells about the high and low prices for that period.

    A hammer occurs after the price of security declines. That is the sign the market is trying to define a bottom. Hammer will appear when the sellers miss forming the bottom and push the price to rise and reverse. In short, the price drops after the open but later, closes near the bottom after regrouping. 

    A hammer candlestick doesn’t show a price reversal to the upside,  it has to be confirmed. Confirmation means the next candle that follows the hammer, closes higher up to the closing price. On such occasions, traders usually enter the long position or exit their short positions. Traders that are taking long positions it is recommended to set a stop-loss below the low of the shadow.

    The meaning of Inverted hammer pattern

    It is important to understand that all inverted patterns imply that the price will change soon. It will not reveal a particular trend but it will warn you that the market will change its momentum.

    Speaking about an inverted hammer pattern, its appearance shows the market is going up with buyers that are taking control. So, the price will go higher. Also, momentum changes, so the sellers are taking the price back to the level of the opening price. The pattern can send out many buys and sells signals in various cases. 

    Inverted Hammer is a trend reversal pattern, and it’s opposite to the hammer pattern. As a signal of bearish reversal, it comes after the stock price falls and symbolizes the strength. What does it look like? Let’s say the stock price tries to move up but the current downtrend blocks it. The bears push it down and form the top tail of the inverted hammer. At first glance, it may look like the trend is continuing since it arrives near a support zone and indicates the bullishness of the stock.  And the war can start. The bulls against the bears, where the bulls are trying to launch the stock up to new higher levels.

    How much the color is important?

    It’s time to explain the color of the body of the inverted candlestick. It could be dark or light. The light body reveals that a stock closes higher and is more powerful than its peers.

    When the uptrend is out of the scene the pattern is ready for the trend reversal. The stock price will go back to the opening price and probably stay around that price until the end of the trading day. You should wait for the next day and the new opening price.  You’ll know if the stock goes down further or the buyers will give it another chance and take the stock to a better position.

    The Inverted Hammer candlestick pattern is maybe one of the main reversal signals in stock trading. You must consider confirmation criteria before trading with this signal. The upper side has to be twice longer than the length of the body, while the lower shadow is very small or there is no, it’s invisible. You must be sure you have the right picture. Let’s say this way, the length of the upper shadow is directly proportional to the possibility of a reversal.

    Also, if there is a gap down in comparison to the close of the prior day, it could be the base for strong reversal. Start trade the Inverted Hammer candlestick pattern the day after the appearance of the signal because in that period the stock will open higher. Consider one aspect more, it’s the level of the trading volume on the day when the inverted hammer signal appears. High volume will increase the odds of blow-off.

    The logic behind this pattern

    First of all, the market condition is bearish as a reply to a downtrend. The stock could start to trade higher, so the bulls will not have the necessary strength. Hence, we have sellers on the scene that are pushing the price down to the lower trading range. Generally speaking, the bears will dominate the market all trading day in such a case.

    The bulls will attempt to recover power the next day causing the price jumps because the bears aren’t able to exercise the needed resistance. If the price sustains its strength even on the next day, you can be sure that you have the confirmation for the inverted hammer pattern.

    If you want to trade an uptrend, you can “go long” which means you can buy. But if the signal isn’t strong enough and the downtrend will continue, so you can “go short” which means you can sell the stock or any other asset you hold.

    Bottom line

    Inverted Hammer candlestick pattern indicates a bullish reversal and it’s recognized in downtrends. Traders need this to decide on the next move. Keep in mind, this pattern isn’t the same as the shooting star pattern. There is a difference. Inverted Hammer candlestick patterns will never occur at the high of the trend line as the shooting star. Inverted hammer will always occur at the low of the trend but not as often as regular hammers. Sometimes, the signals that an inverted hammer may produce can be confusing. That’s the reason to double examine the length of the shadow. It is the most important. 

    Some experts will not recommend using this signal as a trigger for entry. Still, if you want to use it you’ll have an advantage if you wait for a bullish confirmation candlestick. This signal performs the best in time frames of four hours or one trading day. In longer time frames, use it as an entry signal to sell, but not to buy. Remember, the inverted hammer pattern must appear after a downtrend. The flat or sideways markets are something you will not like in trading this pattern.

  • Shooting Star Candlestick Pattern

    Shooting Star Candlestick Pattern

    Shooting Star Candlestick Pattern
    The shooting star pattern represents one of the most important candlesticks patterns in trading. It can decide the entries and exits of your trades.

    Shooting star candlestick pattern is a bearish reversal pattern that appears at the top of uptrends. How does this pattern appear? A Shooting star candlestick pattern is formed when the price of the open, low, and close is approximately the same.  

    A shooting star candlestick pattern is actually a bearish candlestick. It’s easy to notice it.  It has a long upper shadow, small lower shadow or there is no this shadow at all, but there is a small solid body close to the low of the given day. To make a long story short, a shooting star candlestick pattern appears when the security opens, develops notably, but again closes near the open. Traders-Paradise wrote a lot about how to trade patterns, but this one is extremely important.

    How to recognize the Shooting star candlestick pattern

    To be sure it is a shooting star pattern, some conditions have to be fulfilled.  Firstly, the configuration must be created while the price rises. The other condition is that the shooting star candlestick’s body has to be half the size of a distance between the highest price on the given day and its opening price is. And, the last condition, as we said, there shouldn’t be any shadow near the real body or it can be a bit, barely visible.

    The bearish Shooting star candlestick pattern is created only if the low and the close are around the same. Traders recognize this pattern as very strong. When we notice this pattern in the charts it is confirmation that the bears were strong enough to defeat the bulls. Also, it is a confirmation that the bears closed the price below the opening price which means they pushed the price more. The Shooting star candlestick pattern isn’t a hundred percent bearish pattern, but nonetheless it is bearish when the open and low are approximately the same. Remember, they had to close the price BELOW the open. This means the bears were strong enough to halt the bulls but were not capable of sending the price back to what it was worth at the open. 

    When this pattern may occur?

    A shooting star candlestick pattern occurs when the market price is pushed up pretty notably, but then rejects and closes near the open price. This creates a long upper candle, a small lower candle, and a small body.

    Why is the shooting star candlestick pattern often seen as a possible signal of bearish reversal? Because the uptrend might not continue, meaning the price may fall. Don’t confuse the shooting star with the inverted hammer candlestick pattern.  Yes, both have a longer upper candle and small body. The inverted hammer flags bullish which is opposed to bearish reversal, and it is visible at the bottom of a downtrend, not on the top of an uptrend.

    What does the Shooting star candlestick pattern reveal?

    A Shooting star candlestick pattern indicates a possible price top and reversal. It is an extremely powerful signal when it occurs after a group of three or more continuous rising candles with higher highs. However, this pattern may happen during a phase of rising prices, even if a few candles were bearish.

    When the price advances strong to the top, a shooting star opens and continues to rise greatly over the day. This is a result of strong buying pressure during several periods. What is possible to happen? The sellers will come up to the scene in an attempt to push the price back down, close to the open price, and delete all gains for that day. If they succeed that will mean the buyers don’t have control anymore by the close of the day, and it’s possible the sellers will take over.

    In trading charts, the buyers are visible as a long upper shadow.

    They are buying during the day but it looks they are losing their positions since the price drops back to the open.
    After the shooting star, the candle forms. That is the confirmation of the shooting star candle. If you take a look at the chart you’ll notice the next candle’s high is under the high of the shooting star. Also, you’ll see how the price moves down and close near the close of the shooting star. On heavy volume, the first candle after the shooting star will be lower or will open around the previous close after which it will move lower.  That could indicate the price could go down further. In such circumstances, the traders may look for a short sell.

    In case the price increases after a shooting star, the price span could serve as resistance. For instance, if the price consolidates in the zone of the shooting star. If the price eventually remains to rise, the uptrend stays unreached, the traders should choose the long positions overselling or shorting.

    How to trade the Shooting star candlestick pattern?

    For example, the stock is growing in an overall uptrend. The uptrend becomes faster just before the appearance of a shooting star. The shooting star displays the price opened and pushed higher. In charts, it will be visible as an upper shadow, then closed near the open. The next day the price may close lower, which is a confirmation of a possibility for the price to move even lower. If the high of the shooting star wasn’t passed, the price could move in a downtrend for the next few weeks. When trading this pattern, it is a smart decision to sell long positions after the confirmation candle becomes visible.

    Let’s say you’re following the Tesla Inc. stock price and it opens the trading day at $990. Well, the price starts going down at $970 but suddenly good news generates the stock price to rise quickly, and it reaches a high of $1.020. Finally, it closes at $1.000. These changes create a shooting star candlestick.

    If you want to trade the shooting star candlestick pattern keep in mind that it could indicate a negative reversal, also. In short, market prices may go down.

    Limitations of this pattern

    Just one candle isn’t important in a major uptrend. Prices are changing. If in one short period the sellers are taking control, it could be irrelevant. That’s why traders need confirmation. They have to sell just after the shooting star, but even with confirmation, they have no guarantees the price will continue to drop. Not even how long. One of the possible scenarios is the price could increase after some short drop and continue to rise in a long-term uptrend.

    When trading this pattern you have to use stop-loss orders if you want to reduce the risk. One of the smart decisions is to use this candlestick pattern in combination with other methods of analysis.

    Bottom line

    The Shooting star candlestick pattern can indicate the end of an uptrend, so traders may decide to reduce the long positions or exit the trades. It is smart to use some other indicators with this pattern to determine potential sell signals. For example, you could wait a day to test if prices will proceed to fall. Also, you can use the break of an upward trendline. More aggressive traders can use the Shooting star candlestick pattern as a sell signal.
    The bullish version of the Shooting star pattern is the Inverted hammer pattern. Stay tuned, that’s the next.

  • Moving Averages As Support and Resistance Levels

    Moving Averages As Support and Resistance Levels

    Moving Averages As Support and Resistance
    Finding the key support and resistance levels is a crucial component of trading. Moving averages can help.

    By Guy Avtalyon

    Is it possible to use moving averages as support and resistance? How can they help us in trading? Is there any trick on how to use them? We know from the previous article that moving averages are an average of closing prices during the recent days. How much info we can use in the meaning of moving averages as support and resistance levels?
    If you take a look at any chart with moving averages and trend lines that are formed you’ll understand why this is the subject. Moreover, this understanding may have a great impact on your profit.

    Moving averages as support and resistance are extremely powerful and we’ll show you why and how.

    What are the moving averages as support and resistance?

    First of all, these levels are not just like conventional support and resistance. Conventional, traditional levels are visible as horizontal lines in your charts but these provided by moving averages are dynamic. They are changing according to the recent changes in price.

    Dynamic support and resistance levels are zones where the market could pull back into and get support requiring to be at horizontal support or resistance levels. Why is it dynamic? Because it measures resistance and support using moving averages that are changing as market changes.

    You can find many forex traders that use moving averages as support and resistance levels. For example, it is common among them to sell when the price increases and reaches the moving average and tests it. As a forex trader, you cannot ignore when the price often checks out the moving averages before it bounces back. You must understand that something is happening when the price reaches these levels. 

    What happens is the market is developing, evolving. So you can’t always buy or sell at previously outlined levels. Also, trends’ momentum is dynamic too due to the order flows. Momentum can often be the primary forcing power of trends or movements.

    But to sum what we had here. So-called static support and resistance levels are horizontal and can’t move. On the other hand, dynamic support and resistance levels are moving and they are not horizontal. 

    What causes support and resistance?

    When a price goes up and down, it faces obstacles on the way. If obstacles act in a way to prevent the price to drop lower, we are talking about – support. Hence, when it stops the up progress, it is resistance.

    Support is formed when more traders are selling than buying. Sellers will usually cover their short positions and take the profit. The price will go lower and lower. As it happens, buyers will start to buy at that lower price and many of them will enter the new long positions. If the number of buyers is bigger than the sellers, they will create a support level eventually. But if the price moves up that means the more traders are buying and if the number of sellers is bigger than the number of buyers it is so-called resistance.

    How moving averages help to find support and resistance levels

    The question is how do we estimate the strength of the signal we’re seeing. Is it breakout or bounce? There are moving averages as support and resistance levels on the scene to help us. One of the benefits of using moving averages for this purpose is their ability to be handy even when the market price is going through a hidden area in our charts.

    Have you ever had trouble finding key support and resistance levels when looking at the charts? Of course, you had. It is pretty much usual that when looking at charts and notice a price action, you see the price is pulling back but you cannot find support or resistance levels in that zone. But if you try to reveal how the market is valuing dynamic levels, your charts will be more clear. Moreover, you’ll find some trading opportunities you were missing before. That’s kind of an “angle-changer”. You have one perspective more to judge your trade.

    One of the best ways to estimate the ability of support or resistance levels is to watch price action around them. It isn’t hard to read price action. For example, on candlestick charts it’s easy. 

    For example, if you use the 15-minute chart and the price rises to the 50 EMA. That could be a really good dynamic support or resistance level. You’ll notice that every time the price touches 50 EMA and tests it, you’ll see a bounce back down because the price uses this moving average as resistance. Try it, it’s simply amazing. But the price will not always perfectly bounce back from the moving average. Sometimes it will go a bit above before it starts going back in trend direction.

    Sometimes the price will simply explode through it all together. Some forex traders usually leap on two moving averages and buy or sell when the price is in the middle of the zone between the two moving averages.

    Does this really work?

    The logic behind why moving averages as support and resistance work are very similar to why price moves. Let’s say that the majority of traders use 10-days, 20-days. 50-days, 100-days or 200-days moving averages. So, what do you think, what can happen when almost 90% of them use all these five? Nothin special. But if they choose to use only one of them in expectation for it to operate as support or resistance? Yes, you’re right. The price will respect that. When more traders expect something to happen and they have a common goal, it will happen.
    Let’s examine this in the case of 10 and 20 EMAs that are providing support and resistance. What can you see?

    Can you see how the 10 and 20 EMAs are providing support and resistance?  These moving averages can be a powerful help but only if used with the right assembly factors. Let’s look at a setup where they unite several other factors.

    Can you see how the pin bar marked in the red circle rejected the 10 EMA and a key price action level both? We have a clear uptrend without resistance beyond this key level. This was an example of a great setup. Feel free to test it.
    The price will rarely bounce exactly, again, and again from the same moving average. Instead, it’s more efficient to form a support or resistance zone between two moving averages.
    When the price moves into the zone between the 20 MA and 50 MA, we should ask if a reversal is going to happen. That could be a danger zone, so it may be smart to hedge the position.

    How to use moving averages to lock in profit

    If you want to lock in profit, move up your stop level in your trend-following trade only if you have a clear signal of bounce from moving averages you use as support or resistance. That is one of the tricks for using moving averages as support and resistance. But you have to keep in mind that moving averages as support and resistance levels are just saying to us what’s going on at these levels. We still have to look out for additional signals and find them. 

    The truth is that if you add MAs you’ll have additional in-trade information that may help you to maximize your trades. But like everything in Forex, you’ll have no guarantees. Consider these averages as a tool in your trading toolkit that you can adopt and use to increase your trading success.

  • How To Use Moving Averages In Trading Stocks?

    How To Use Moving Averages In Trading Stocks?

    How To Use Moving Averages In Trading Stocks?
    Many traders tried to use the SMA to predict the sell or buy options on a chart. You can pull this off by using various averages for triggers.

    By Guy Avtalyon

    Moving averages are one of the most popular trading tools, so let’s see how to use moving averages in trading stocks. Some traders have great knowledge about it but some still make it wrong. The latter might have an extremely great influence on trading success and traders’ confidence in this strategy. But actually it’s a great strategy if you know how to use moving averages in trading stocks.

    Our aim is to show you exactly that and how to avoid mistakes. We’ll show you how to choose the type and length of the moving average. Also, we’ll show you how to use moving averages in trading stocks and how they can help you to make trading decisions.

    Which moving average to choose? 

    Not a small number of traders will ask what moving average to choose, EMA or SMA. To evoke. EMA is an exponential moving average while SMA is the simple moving average. There are not too many differences between these two but if you choose one or other that can make a difference in your trading result.

    The main difference between EMA and SMA is speed. Moving average EMA will always move much faster and thus will change the direction before than SMA. Hence, EMA is capable of faster recognizing the stock price change. On the other hand, SMA would take much more time to turn when the stock price changes.

    But you cannot conclude which is better based on their speed. How is that? EMA acts quickly when the stock price changes direction, which means it’s more sensitive. When something is sensitive it’s at the same time more vulnerable. That’s the reason why EMA could send a wrong trading signal. Simply, it reacts too soon.

    For example, if the stock price starts to go down, the EMA will begin turning down promptly and it will indicate a change in the direction too early. What if it is a short-term living change? What if it is a false signal? So, we’ll need to watch the SMA. It moves slower thus it provides a more accurate signal

    Well, it will be nice if so simple but it isn’t.  If you trade according to EMA only, you’ll be at risk to enter a trade too early. Also, if you use SMA only there is another problem because you might enter the trade too late. There is an additional benefit to using SMA. During the volatile markets, its signal is less wrong.

    How to trade with the SMA?

    SMA is a generally accepted technical indicator, as we said. Do you remember how we use it in school? It’s similar.
    By using SMA you’ll be able to recognize the strategy that will work for you. In the beginning, here is the formula and later we’ll show you how to use moving averages in trading stocks.

    The SMA formula is the average closing price of a stock over the given periods. So, add all closing prices on the particular stock during the week, for example, and divide the result by the number of days (a trading week is 5 days long). This may look like this for 5 days:

    (19 + 20 + 22 + 18 + 21) / 5 = 100 / 5 = 20

    You can calculate SMA for 10 days, 15 days, 50 days, etc. It’s simple math. Well. all indicators are based on math.

    With SMA, you cannot do whatever you want. It is important to use the most practiced SMAs, not some unnatural 33-days, for example. That cannot beat the market. Traders use 10, 15, 20, 50, 100, or 200 SMAs every day. And you have to know what is interesting for other traders, what they are looking for.
    The point is, the shorter the SMA, the more signals you will get. For instance, if you use 5-days SMA use it along with a longer SMA because you’ll need a proper trigger for your trade, not an indicators’ noise. Short-term traders will use SMAs for up to 20-days. 

    How to use moving averages

    The right question is how to make money with SMA. Find stocks that are breaking out or down but it has to be done strongly. Use SMAs, test them all, to recognize which setting carries the best price. Now, when this is done, let the price test a particular SMA, if done successfully you’ll have a confirmation of the trend. Enter the trade on the first following bar.

    Also, you can use two SMA to fade the primary trend. You’ll have to be positive that the stock price didn’t touch 5-days or 10-days SMAs in the latest 10 bars. The price should close below or above both SMAs but in the opposite direction of the primary trend in the same bar. Enter the trade on the first following bar.

    These are two approaches: with the trend or fade the trend when trading with SMA.

    How to use moving averages EMA?

    The EMA is maybe the oldest indicator of technical analysis. The EMA strategy is helpful to identify the prevailing trend in the stock market. When executing your trades, EMA will provide support and resistance level to do that. The exponential moving average strategy works in all markets and in any time frame, actually. It is a line on the price chart that uses a math formula to help you smooth out the price performance. The EMA formula pays more attention to the recent stock prices. As we said above, it’s faster.
    The EMA helps to reduce the noise of daily price action and shows the trend but also,  perfect in determining future changes in the market price.

    How to calculate the EMA?

    Use the SMA as the start-point for the EMA value. Let’s assume we want to observe 20-days. So, we’ll need to calculate the SMA for 20 days. On the first next day, the 21st day, we have to use SMA from the prior day as the first EMA.

    The calculation for the SMA is simple since it is the sum of the closing prices during a chosen period, and divided by the number of results obtained for that period. For instance, a 20-day SMA is the sum of the 20 closing prices for the last 20 days and divided by 20. Further, you must calculate the multiplier for weighting the EMA. Here is the formula

    (2 / (number of results + 1)). 

    In the example of the 20-day average, it looks like this:

    2/(20+1) = 2/21 = 0,0952

    Let’s calculate the current EMA.

    EMA = closing price x multiplier + EMA (prior day) x (1-multiplier)

    The EMA puts a higher weight to recent prices, while the SMA gives equal weight to all values. The weighting is higher for a short-period EMA than for a long-period EMA. 

    EMA strategy

    Use one moving average with a long period and one with a short period to remove subjectivity from the trading.

    Draw on your chart 20 and 50 EMAs. Do it precisely to be able to identify crossover when it occurs and wait for the price to trade above 20 and 50 EMA. The area between 20 and 50 EMA should be retested twice or more times. If two tests are successful and successive that means the market has sufficient time to develop a trend.

    We hope you can now understand how to use moving averages in trading stocks. They are fundamental for strategies based on technical analysis. If you use moving averages in combination, you’ll be able to predict both short-term and long-term stock price movements.
    How to use moving averages in trading stock more? Use them to define levels of support and resistance.
    Stay tuned, that will be the next topic.

  • Stop-loss First, Then Consider The Entry

    Stop-loss First, Then Consider The Entry

    Stop-loss First, Then Consider The Entry
    In stock trading, the essential part is to move quickly in and out of the position to profit more.

    Guy Avtalyon

    Everyone who even thinks about trading must understand the importance of stop-loss and why the Traders-Paradise team likes to say stop-loss first. 

    The stop-loss is one of the simplest tools from any trader’s toolkit. This order is connected to the stock’s movement, no matter if the fundamentals for the company have changed. The stop-loss first,  because if you use it you’ll have a greater chance to outperform the market. Let’s explain this. When the price of the stock goes down, the stock becomes more volatile, which means more risk. 

    Correlations between stocks and the market increase more when markets are dropping than when they are growing. So, the portfolio risk rises, and therefore diversification impact reduces. Increased volatility and higher risk, can expose stop-loss order as extremely important in risk exposure control. The gain could be potentially made by reducing the risk and getting a higher risk-adjusted return.
    Using stop-loss strategies you can reduce your emotional reactions while trading, and overcome the volatile market. So, the saying “stop-loss first” covers many situations when it is beneficial and we’ll show you some of them.

    Why stop-loss is the first consideration

    Stop-loss is the primary guarantee for profiting in the stock market. When you set your stop-loss order you’ll avoid risk, protect your principal, and survive the market volatility. It’s like the insurance premium.
    Risk control is the most important. For example, you just learned to ride a motorbike. What you have to know as a must?  You’ll have to know how to control the speed of falling. You’ll be safer.
    But when it comes to stop-loss orders, not every trader is confident where to set this order. Some even avoid thinking about it. Let us explain something. The stock market is a risky one, while you have one winning trade you might have up to ten losing trades. Don’t worry, that’s normal. But you cannot depend on good luck or count on it. What do you need? Skills and capacity to profit consistently. Otherwise, the stock market will dump you out. 

    Why is stop-loss important?

    One of the reasons to use stop-loss is because you trade with limited capital. That’s the rule, no matter if you are the richest trader in the world. Limited capital is required due to the necessity to protect your whole capital from losses. It is possible only if you use a stop-loss order. In other words, you must know what the maximum losses you can take per trade, per day, week, or month. That is trading discipline. You can maintain it only if you set a stop-loss order for each of your trades.

    Moreover, if you consider a stop-loss first, before your entry point, you’ll be able to profit faster and reach your financial goals. In stock trading, you don’t want to hold stock for a long time, and you’ll want to sell them. But if the desired price isn’t reached,  you’ll need to close the losing position as fast as possible and move onto another trade. Of course, you’ll have to compensate for your losing trade elsewhere. That to be said, in stock trading the essential part is to move quickly in and out of the position to profit more. Move your money quickly and with profit, that’s the point. But if you do it randomly you’ll be faced with losses. You have to ensure your trades. How to do that? By using stop-loss first, then you can think about new entries. Also, the bounce backs will be easier in case you have losses. The math can confirm that.

    For example, it is easier for $1000 to fall to $800, but a lot more difficult for $800 to bounce back to $1000. This is a loss of 20%. To compensate for this loss you’ll need about 25% appreciation and come back to the initial capital. But even after a 100% bounce, the stock will be back to its buying price. That’s why you need to use stop-loss orders. If you wait there is a chance for momentum to go more against you.

    What does stop-loss determine 

    In trading, using a stop-loss order is important to overcome the imperfection of indicators. You have to exit a trade if it goes against you. If you’re a buyer, your stop-loss order will be a sell order. Consequently, if you’re a seller your stop-loss order will be a buy order.
    If you’re a buyer, the stop-loss order is a sell order. And vice versa, if you’re a seller, it’s a buy order. For example, if you set your stop-loss order at 3%, you’re actually setting the amount of money you’re prepared to lose per trade.
    Stop-loss relates to indicators, money, or time.  It’s up to you to choose what type of stops you want to use. For instance, you’re buying a stock at $50 because the indicators you use are showing that for this particular stock potential gain could be $100. This means the stock price could reach $150. Your initial stop could be at $25 which is 50% of your initial capital and to get a chance to make $100. Here we come to the risk-reward ratio. In this case, it would be 100:25 which is 4:1. 

    In short, it determines how big a position to take.

    Why to use stop-loss first?

    To avoid the concentration of positions

    As a trader, you’ll run the risk if you extend your exposure excessively. For example, if you keep holding onto positions or average them, then the concentration can occur in your picked stocks.
    For example, you bought a stock at $50 and if it goes down to $45, you might want to average your position. You’ll want that to reduce the cost of holding, for instance. But if the stock price continues to drop, you might be motivated to average your position again. So what could happen? You’ll fall into the loop. You’ll repeat this mistake, and repeat again and again in an attempt to reduce the cost of holding. The better choice would be to use a stop-loss order at the level of the first decline and cut your position. Why would you like to keep a few positions and end up overexposed to their cumulative risks?

    Getting higher leverage  

    In stock, trading leverage is important because it provides you to trade with margin. For example, you put in a margin of $100.000 into your trading account. But you want to trade a stock whose current price is $1.800. So, you could buy about 55 shares. But your broker allows you 4 times more leverage because the company is highly liquid and you now can open positions up to $400.000. Instead of 55 shares, you can buy 220 because it’s the cover order. Let’s assume that the support level for this stock is at $1.750 and you set your stop-loss at $1.700. Let’s calculate your trading risk.

    220 x (1.750 – 1.700) = $11.000

    Since you have a margin of $100.000 in your account, the cover order reduces the risk. Yes, but only if you plan a stop-loss first.

    Advantages of this order

    If you count a stop-loss first, you’ll be able to cut your losses and you’ll be able to protect your trades against bigger losses when the stock price drops sharply. Further, the stop-loss will be automatically triggered if the stock price moves to a certain price. Moreover, you can maintain the risk-reward ratio. For example, you are willing to take a 3% or 5% or 10% risk to get a particular profit. A stop-loss order will help you to achieve that. One of the advantages is that you’ll be able to make trading decisions without emotions and despite the market noise. Also, the stop-loss will help you to execute your trades based on your trading strategy and to stick with it. 

    Disadvantages of using a stop-loss 

    Nothing is 100% sure in the stock trading so even the stop-loss has some drawbacks. For example, you set a limit order and also, you set a stop-loss order, to buy a stock on a particular date. What if your stock opens at a lower price (gap-down) during the pre-opening session? Well, your stop loss will never be triggered. You will end up with losses. Here is a possible scenario. You set a stop-loss at $25, but the stock opens on a gap-down at $23. The stock price didn’t reach your stop-loss so your sell order will not be achieved. 

    Also, a stop-loss can be triggered by short-term fluctuations. For example, the stock price first fell to $24 but then bounced and Increased to $35. But you set the stop-loss at $25 and your holdings will be traded automatically as that price is reached.
    When you calculate where to place a stop-loss order examine what was the range of the historical fluctuation for that stock. For example, you will not place a stop-loss at 3% for the stock with a daily fluctuation of 6%.

    If you want to be a profitable trader, you’ll need to plan every single action. Just like you know the buying price, you must know where to set a stop-loss first and take a profit level. If you don’t do this well, the whole process might end up in big losses. Also, poor stop-loss orders can cause them. The stock trading history is full of both great and ugly stories, so many ups and downs, winning trades and failures.
    Learn stop-loss first, then consider your entry! That’s the whole wisdom.