Head and shoulders pattern occurs on all time frames. It can be detected visually. The complete pattern gives entries, stops, and profit targets, so traders can easily execute a trading strategy.
A valid head and shoulders pattern occurs very rarely. But when it appears, traders recognize it as an indicator that a significant trend reversal has occurred. A usual head and shoulders pattern is held as a bearish setup while an inverse head and shoulders pattern is held as a bullish setup.
But let’s start from the shape of this kind of triangle pattern.
As you can see, the head and shoulders pattern is a chart formation that follows a baseline with three peaks. The outside two, on the left and right side, are similar in height but the middle is highest. This pattern is used mostly in technical analysis because it is broadly accepted that this pattern is a strong trend reversal indicator. One of the greatest advantages of head and shoulders pattern is its accuracy that shows that an upward trend is approaching its end.
But let’s start from the shape of this kind of triangle pattern.
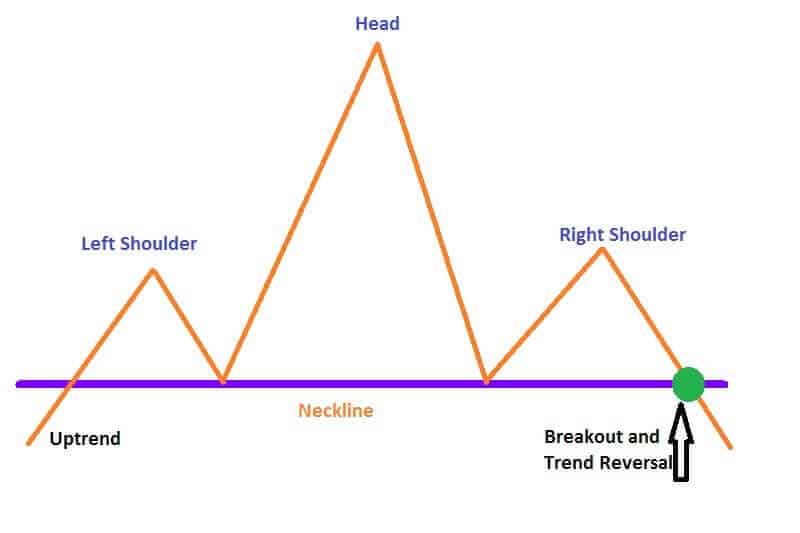
In the image above you can see a large peak in the middle and smaller peaks from both sides, left and right from it. This pattern is extremely useful for traders because of its ability to predict reversal, from a bullish to bearish.
And as you can see, the first and third peaks are smaller than the middle one. The horizontal line is known as neckline and all peaks will fall back to this line which represents the level of support. When the third peak falls to the neckline traders believe that a breakout occurred and the bearish downtrend started.
In our image, you can see a bearish reversal. But if all these peaks are formed under the neckline it would be a bullish reversal.
How to trade the head and shoulders pattern?
It’s crucial in trading this pattern that traders wait for the pattern to form. Why is this important? Sometimes the pattern will not develop completely or maybe it will not develop at all. If the pattern isn’t developed completely, meaning it is almost or close to be, don’t trade. Just wait until the pattern breaks the neckline.
When you trade a head and shoulders pattern it is crucial to wait for the price move to go below the neckline after the peak of the right shoulder. So the regular pattern has one smaller peak, one fall, second higher peak, second fall, third smaller peak, and third fall to the neckline. Wait for the price action to break the neckline and then trade. When you have an inverse head and shoulders pattern, you should wait until the price action goes above the neckline, once when the right shoulder is formed.
Open a trade only when the pattern is complete.
It is very important for any trader to have a plan before entering the position. For example, the best way is to write down your entry point, stop-loss, and profit targets. Also, do the same with variables that might alter your stop or profit target.
For the head and shoulders pattern, development time isn’t a crucial element since it can develop over any period of time. Yet, traders believe that pattern that takes a longer time to form is more significant. Meaning, the probability to identify a significant price reversal is greater.
How the head and shoulders top pattern shapes
The head and shoulders pattern appears in the precise order and we’ll describe it. Keep in mind that we have only one variable here. It is how long it will take to finish each step in the sequence.
As we said, in trading the head and shoulders pattern, we have to wait until the price moves a bit under the neckline after it reaches the peak of the right shoulder. For the inverse, wait for the price action over the neckline.
Once the pattern is complete, we can initiate the trade. Traders usually enter the trade when a neckline is broken. But this is not the only entry point. The other method demands more patience since it’s based on the possibility that the movement may be missed completely. For this entry point, we have to wait for a pullback to the neckline after a breakout has already happened. This is a more conservative method. The point is to be sure if the pullback will stop or continue the original breakout. This is important because if the price continues to move in the breakout direction, we will have a missed trade.
How to place the stops?
In the conventional head and shoulders pattern, traders commonly place the stops above the right shoulder, just after the neckline is broken. The other way to set stops is to use the head of the pattern as a stop. This approach is risky and your risk-reward ratio can be reduced.
When we have the inverse pattern, set the stop a bit below the right shoulder. Also, as previously explained, you can place the stop at the of the head and shoulders pattern, but you’ll be at exceptional risk once the trade is taken.
How to set the profit targets?
First, we have to explain that the profit target in this pattern is the difference in price between the head and low point of any shoulder. When you find out that difference, just subtract it from the neckline breakout price. It is important to provide a price target to the downside for a market top, right?
For the market bottom, the difference should be added to the neckline breakout price to provide a price target to the upside.
Here is an example.
Let’s say that $100 is high after the left shoulder and $90 is the low of the head, so the difference is $10. And let’s say the breakout is $100,50. What you have to do is to add the difference to the breakout price, which is $110,50. That is giving us a target price of the same amount.
In the case of the regular head and shoulder pattern, you should subtract this difference from the breakout price.
We already mentioned a timeframe. Sometimes traders will wait more than several months until they reach the perfect profit target after noticing the breakout. That is the reason to monitor the trades in real-time.
Head and shoulders pattern really serves
It is impossible to find an ideal pattern that will work in any circumstances and all the time. But we’ll point out several reasons why this pattern works.
Firstly, when the price drops from the market high (which is the head in the patter), sellers would enter the market and there will be less aggressive purchasing. Further, when the neckline is met, traders who purchased in the last wave higher or on the rally in the right shoulder of the pattern, are confirmed wrong and thus facing large losses. They will exit their positions, which will drive the price to the profit target.
The importance of stops
Setting the stop above the right shoulder is reasonable because the trend can move downwards if the right shoulder is lower than the head. So, there is a little chance for the right shoulder to be broken until an uptrend continues. The profit target reveals that traders who made wrong trades will exit their positions, which will create a reversal. The neckline is a painful point for many traders. Many of them will decide to exit the positions, which will drive the price to move closer to the price target.
Also, you can examine the volume from this pattern. When the inverse head and shoulders pattern occurs it would be ideally the volume to grow as a breakout happens. This presents a rising buying interest. It is very important because it provides the price to move closer to the target. When the volume is decreasing, that means that the traders’ interest in the upside move is lower.
The traps of trading head and shoulders pattern
Nothing is perfect and this pattern also. You can be faced with some problems when trading this pattern.
First of all, this pattern isn’t easy to spot. More harder is to wait until it develops and completes. Sometimes you’ll have to wait very long. The other problem that may occur is stop-levels. It is hard to set the proper stop level. Also, the profit target couldn’t be easily reached every time. Sometimes, you’ll need more detailed data to uncover how the market condition may influence your exit from the trade.
One of the widely spread beliefs is that this pattern could be traded always. It isn’t true.
For example, when you notice a massive decrease in one of the shoulders caused by some event, your calculated price targets will not be reached. Also, not all traders are able to notice this pattern. Some will do it without a problem but the others will never notice one.
Bottom line
We hope you have a better understanding of the head and shoulders pattern now. If yes, put it to work. Try to recognize both the head and shoulders and inverse head and shoulders patterns. When you recognize them, just monitor the development. This pattern can help you to find trends ahead and establish fair targets. Also, you’ll be better prepared to enter the trade when the time is right.