Author: Editor

  • How to Use Technical Indicators to Analyze Stocks?

    How to Use Technical Indicators to Analyze Stocks?

    How to Use Technical Indicators to Analyze Stocks?
    Trading indicators are a component of every technical trading strategy. They help traders to get full insight into price trends.

    After you learn the basics of technical analysis, it’s time to learn how to use technical indicators to analyze stocks. This will be something very concrete because we’ll discuss their real implementation. After we debunk all myths about technical analysis it’s time to go forward. Everyone who wants to trade stocks should know how to use technical indicators to analyze stocks. 

    Traders use technical analysis to examine past market data in the hope to determine future price movements. They use indicators, charts, and other tools to recognize price patterns and trends for that purpose. Future performance of the stock price is maybe the biggest mystery in the stock market, and there is no such a trader or investor that wouldn’t like to unveil where the price will go. By using tools, the chances are bigger, without them we are just guessing, and instead of trading, we are simply betting. So it is very important to know how to use technical indicators to analyze stocks.

    Technical analysis is based on the belief that price movement would repeat, so the patterns can be recognized and used to determine a market’s trend.

    Technical analysis of stocks

    To put it simply, when analyzing stocks you have to look for patterns that appear in the chart. Patterns could be similar or exact as some previous one and based on this similarity you might have some clues of how the stock’s price will act in the future. But to have a clear picture of that you’ll need to use qualitative and quantitative techniques commonly named as technical indicators. Both techniques or types of indicators have their specific purposes. You’ll use qualitative indicators to find support and resistance levels, changes in polarity, or chart patterns but quantitative indicators will tell you if the stock is in an upward or downward trend. Quantitative indicators which are market trends, moving averages, and momentum indicators will show you the pattern in stock price actions. Based on this info you’ll decide if you will buy the stock. 

    Let’s break down each of these techniques separately.

    How to use qualitative indicators

    Important qualitative indicators are 

    Support and Resistance

    The technical analysis method assumes that stock charts will show you the bottom and top levels. In most cases, the stock price is moving between these two levels. We said “in most cases” because when there is a breakout the price could break one of these levels.

    The resistance level is also seen as a ceiling. When this level is reached the stock will not rise further, and you should consider selling the stock you own and to do so as soon as possible. You will not get a better price for it. So, that is the highest price, and you’ll profit.

    The support level represents the lowest price. To explain this, when the stock price is going down, demand for the stock will increase and form the support line below which the stock price will not fall. This means the stock will bounce back and rise in price after this level is reached. That is a great time to buy a stock at that lower price.

    This is how to use technical indicators when you want to buy or sell the stock you own. To tell that briefly, buy the stock when it is near to its support level and sell when it is nearing its resistance level.

    But there is one thing you have to keep in mind. 

    These levels are not fixed. 

    They are changing during the long term. These levels can be higher or lower. That depends on how investors look at the stock. If they think the stock is a great player they will massively buy it but if they think the stock isn’t good they’ll start to sell it. 

    You should find support and resistance levels in the stock chart. Also, an important point is where prices have paused or reversed after rising or falling. That might show you what will happen in the future, once when these price points are touched.

    When a zone of support or resistance is known, use those levels as potential entry or exit points. That could be a smart decision. When the price hits one of those levels it has only two possibilities – to bounce back from the levels or to break the levels and proceed in its direction. If that direction isn’t in your favor you can close your position with a minimum loss, of course, if you do it immediately.

    Change in the polarity principle

    So, what happens when the price breaks support and resistance? Investors are very active at these levels. But a break indicates that they are not interested in buying and selling stock further. That causes the price to move violently to find new support and resistance levels. 

    When the support level is broken, the stock could enter a freefall area and form new support. It is the same when the resistance level is broken, the stock will increase in price and find a new resistance level.

    The polarity principle means that whenever the stock price breaks through the support level that point becomes new resistance.

    Hence, the resistance is broken, it becomes a support level. 

    It is very important to know how to use technical indicators and notice when the price is near support or resistance levels. That will give you a chance to react in your favor to protect your investment.

    How to use patterns as technical indicators?

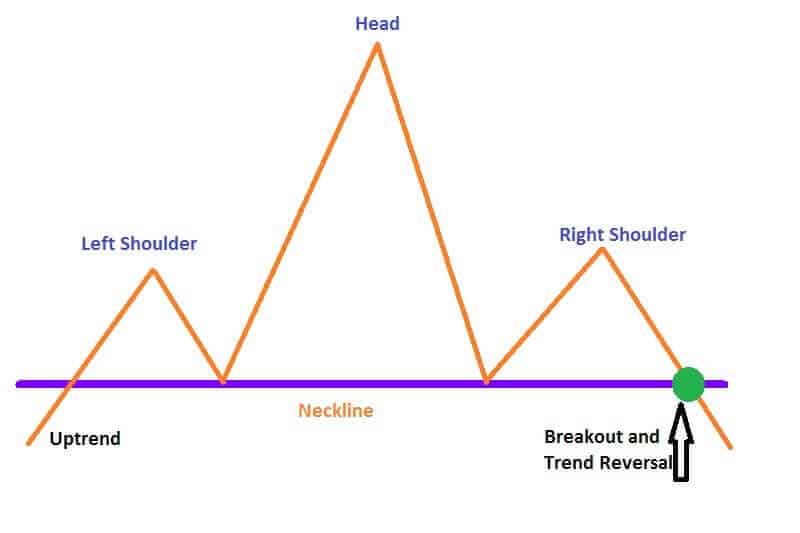
    You have to watch out the other relevant chart patterns that show where the stock price will go next. These chart patterns are grouped as reversal and continuation patterns. Reversal patterns show that a trend that was leading the stock price has expired. The stock will run in the opposite direction. This means if the stock was greatly valued, it would drop. If the stocks were undervalued, they would rise in price.

    Major reversal patterns are head and shoulders, inverse head and shoulders and, double bottoms and double tops.

    Continuation patterns represent confirmation that the current trend will stay. So, the suggestion is to hold your stock if the price is rising, or to sell it if the price is dropping.

    Significant continuation patterns are rectangle pattern and flags, triangle pattern, and pennants.

    How to use quantitative indicators

    Quantitative indicators are used in combination with other indicators for predicting the stock price movements. They can be trend-following indicators, for example, moving average will give you an insight into the current trend by smoothing out price movement.

    The other quantitative indicator is the oscillator as a momentum indicator. It measures the speed of how the stock price is changing. The oscillator will signal you when the stock is overbought or oversold. Overbought stock means that the stock price is probably dropping, and oversold means that the stock price is low. 

    How to use technical indicators – Moving averages

    Moving averages are a popular indicator, especially simple moving average or SMA and exponential moving average or EMA. Calculating SMA is quite simple but the calculation is more complicated. If you draft a 50-day SMA and a 50-day EMA on the same chart, you’ll see that the EMA acts promptly to price changes than the SMA does. But there is no need to calculate them manually since you can find charting software or trading platforms that can do that for you.

    How to use technical indicators – Oscillators

    Oscillators are extremely helpful when the stock is overbought or oversold.

    When using oscillators you can see when the stock is going upside. That is the level at which the stock turns into the overbought status. This indicates that the buying volume has been decreasing and traders will begin to sell their stocks. And vice versa, when the stock is oversold that means a great number of traders are selling their stocks consistently.

    Use oscillators when your charts are not displaying a clear trend no matter in which direction.

    Bottom line

    The way of how to use technical indicators to analyze stocks and predict market trends could determine how successful an investor you are. Technical indicators will help you to decide when is the right time to buy or sell the stocks you hold. Some will aid traders to identify and confirm a trend direction. For example, trend lines are helpful to predict support and resistance levels. Oscillators will measure the strength and speed of a price movement and help you to recognize overbought or oversold zones, potential entry, and exit points. 

    By knowing how to use technical indicators you’ll be able to make more profits and reduce your losses.

  • What Is Momentum Trading and How To Start?

    What Is Momentum Trading and How To Start?

    What Is Momentum Trading and How To Start?
    Momentum trading is particularly successful in volatile markets. The main rule is “buy high and sell higher.” 

    To understand what is momentum trading you’ll need to know that this strategy is based on the recent strength of stock price. Traders that practice this trading strategy believe the price of an asset will continue to move in the same direction if there is enough force to push it higher.

    Momentum trading is an aggressive approach to trading. You have to know that before even trying to fully understand what momentum trading is.

    The simple answer to the question: What is momentum trading also can be: It is a simple buying and selling of stocks, for example, based on the recent strength of price trends. We mentioned the force behind the stock price, so let’s explain it more detailed. 

    When the stock goes up and as it reaches the higher price, more and more traders are interested to buy. Their interest is driving the stock price higher and higher. That is the so-called relation between demand and supply. As the number of stocks is the same, meaning the supply is the same, the contest among the traders will increase the stock price. And this price growth will continue with the increasing number of buying in the market. But at some point, some of them will start to evaluate if the stock is worth enough to be sold. If there are enough sellers of that stock, the momentum will change the direction and the stock will go down in price. 

    What is the momentum trading here?

    Momentum trading occurs when traders open their positions after they notice there is a strong trend in stock price. They will close their positions when the trend begins to lose strength. Momentum traders don’t need to wait until the trend hits the top or bottom. Their focus is usually the middle range of the price move which presents the main action in the stock price. This range shows the strong buyers sentiment, everyone would like to buy such a stock that has an upward trend. So, what momentum traders do? They are starting to sell the stock at a higher price.

    In other words, momentum traders will attempt to recognize how strong the trend is in a particular direction. Then, they will open their positions to take benefit of the predicted trend development while the stock price is low enough and close their positions when the trend begins to lose strength but the price is high enough to provide them a profit. Momentum traders intend to use the tendency of other traders to follow the majority and profit from that.

    The principle behind momentum trading is “buy high, sell higher.” So momentum traders will keep winning players among bought stocks but they will sell the stocks that are not. The money earned will be used to buy more stocks that were doing well.

    The essence of momentum trading is to sell the stocks that are dropping but not too much. Previously, the traders must have a confirmation that the change in stock price is real and that will continue in the direction. So the trend must be confirmed. 

    What is momentum trading else? It is an excellent strategy with great results in volatile markets where quick access is important. When it is done correctly, momentum trading could provide potentially large profits. This trading strategy requires an outstanding and quick process of decision making and that’s why this approach can provide traders more profits than some other strategy for the same time spent.

    Risks of this trading strategy

    Momentum trading is risky without a doubt and this can be one of the answers on the question of what is momentum trading. But if traders are careful and monitor the market and trends closely, they’ll be ready to buy and sell the stocks on time. It is very important to notice the main change in trend. If the traders miss them, they may suffer big losses. Entry points and exit points or profit targets are extremely important.

    Momentum traders have to recognize the point when to enter and close their trades, the level where to exit the trade. It is also important to recognize the proper time when to take any action. For example, if the trader closes the declining stock sales in time such will end up with the profit. But if the trader fails to close the sale quickly such a trader will end up in great losses caused by the stock’s decline in value.

    It is very important to notice the stock’s sharp drop in price, sell the stock on time, and avoid a dangerous influence on capital involved in the trade. So, the timing is extremely important in momentum trading. The trader has to be absolutely sure that stock is starting to decline and enter the position promptly to sell it. Otherwise, it can be almost impossible to sell it.

    And to answer the question of what is momentum trading. Momentum trading is set to be a remarkably prosperous strategy but has to be performed perfectly.

    How to start momentum trading?

    Identify the stock you are interested in, choose your momentum trading strategy, but first test it on some demo account. But keep in mind several things.

    As we mentioned above, the volume is crucial to momentum traders, because they have to enter and exit positions promptly. That means there are enough sellers and buyers in the market and the good volume shows the stock market is liquid. Volume is the number of stocks traded in the market, it isn’t the number of all transactions.

    Momentum traders seek volatility because the high volatility provides big swings in stock prices. That is an advantage for momentum traders, these short-term increases and decreases in stock’s value give the traders a chance to profit. Of course, only if they have a good risk management strategy as protection. That means they have to set stop-loss and limit orders.

    As we said, time is important. This strategy is adjusted for short-term market movements, but if the trend keeps its strength longer this strategy is useful for position trading too.

    Momentum trading in the stock markets

    To be successful in momentum trading in stocks you’ll have to follow some rules. You’ll need the protection against big losses. So, you’ll need to trail the stop-loss, that will provide you to ride the trend. Set your rules for classifying the stocks to know which stocks to buy. Buy stocks on the uptrend market. 

    For example, if some stock reaches a 50-week high you should go long. If there are many stocks of that kind, make a selection of best 15 or 20 with the biggest raise during the last 50 weeks. Set a trailing stop-loss at a minimum of 20%. Never trade more than 20 stocks at the same time and distribute 5% of capital to each of them. The saying “never put all eggs in the one basket” is relevant to the momentum trading also.

    Momentum traders are focused on price action and rely on technical analysis and indicators because they need to decide when to enter and exit each trade, as we described above. Favorite momentum indicators among traders are RSI (the relative strength index), the stochastic oscillator, moving average. Of course, you can use any other technical indicator but these are the most popular.

    Bottom line

    To be able to understand what is momentum trading you’ll need to have severe risk management. The stock market is volatile and momentum traders need to notice price fluctuations and price pitfalls in the market.
    Don’t neglect the basic elements that could lead to price changes. Sometimes it is better not to think about the next big rally. Think about profit. It might come even if there is no big rally.
    Carefully pick the stocks to trade, set stop-loss levels, place your entry at the right time, systematically monitor the market to notice possible changes, plan, and set your exits.
    Use protective rules for every trade. Momentum traders will set stop losses to protect their trades from unexpected price reversals. There is no other way to be a successful momentum trader. We hope you have a more clear picture of what is momentum trading.

  • Technical Analysis Myths Demystified Completely

    Technical Analysis Myths Demystified Completely

    Technical Analysis Myths Demystified Completely
    There are a lot of great tools and methods that can improve your trading. But first, you’ll need to clear away some myths about technical analysis.

    By Guy Avtalyon

    What do you think, do technical analysis myths exist? 

    Some traders and investors criticize technical analysis as a “shallow” reading charts and patterns without any precise, final, or useful effects. Others think it is a Holy Grail of investing. Their misconception is that once learned will provide them constant profits. These conflicting aspects have led to the wrong using technical analysis.  

    In the world of stock trading, technical analysis is a controversial system. Many traders claim that there is no value, it is inefficacy. But on the other hand, many traders are strong supporters. Common misunderstandings come from traders that only use fundamental analysis, for example. Such will be cautious with technical analysis. However, a great number of traders across the world use technical analysis to make profits. 

    But put all these disagreements aside, and let’s take a look at the myths which come along with this.

    The technical analysis myths: TA will provide you a profit

    This myth comes along with technical analysis courses. All of them are promising great success, high profits, excellent gains. Moreover, many claims that just one indicator is quite good enough to enter the trade and profit a lot. That simply isn’t the truth. To be able to use technical analysis you’ll need to learn a lot, you’ll need practice, discipline, and risk management. To become a successful trader you’ll need time, experience, and dedication. Technical analysis is just one part of it, just one tool. But you’ll need more. TA used as only one method doesn’t have super-power. It cannot provide you easy money. All the hard work you have to do, the analysis will never do it for you. 

    Technical analysis myths are that this method singly can give you a deeper insight into trends or patterns and provide you gains. You’ll need more tools and analysis to make profits. 

    That is one of the technical analysis myths. 

    It’s a rookie illusion to believe that anyone can enter the trade armed with one method. This myth can catch everyone especially if you’re a novice. They use the lovely KISS rule extremely to explain the technical analysis. But this will never lead you to be profitable. Technical analysis will show you what has happened and what is happening. This analysis will never tell what will happen in the future.

    Real knowledge requires time to build.

    Is technical analysis simply a reading charts 

    It would be nice if true, but it isn’t. Actually, this is an idiotic opinion. Charts are useful tools but you cannot find in them everything you need to be a successful trader. The point is that you cannot step into the trading field with several simple setups or indicators and make a profit. This is one of the biggest technical analysis myths. But that’s nonsense! 

    Technical analysis is helpful to understand the market’s behavior in a simple way. It is crucial for understanding market psychology. Based on TA you can make informed assumptions about future price movements. However, just a few lines in the chart aren’t sufficient. 

    The truth is that you’ll need time to build competence in trading. You’ll make a lot of mistakes, you’ll have losses, and stress before you understand how to make decisions based on knowledge, math, and logic. Keep in mind, all that line you can see on your charts are worthless without context. 

    For example, the signals have the same value but have one big difference – the context. That’s why it is important to recognize the context in which signals appear. To repeat, the signal without the context is worthless. 

    You have to understand this character of technical analysis to be able to make recognize the way in which signals turn into results. For example, some signals acted fantastic several weeks ago but today could fail. Yes, the past performances do repeat, but never exactly. So, why is that? The answer is simple – the context is changed. Hence, the result couldn’t be identical. 

    Can you understand how dangerous this kind of technical analysis myths is? If you rely on the charts only you’ll ruin your portfolio.

    Can technical analysis give valid price predictions?

    This is also one of several technical analysis myths. Of course, never expect that all clues could be 100% accurate. That is the wrong expectation, especially rookies use to have it. If you see the exact future stock price in some predictions, go away. Don’t read it anymore. Real and qualified technical analysts normally avoid quoting prices so precisely. They will give a predictive range “from” and “to” which isn’t the exact number. 

    Technical analysis is all about probability and possibilities. There are no guarantees. When you put your money following some of the technical recommendations, understand them as the range of stock price. Keep in mind, if some stock works better more often than not that still doesn’t mean it will work all the time. But yet, that stock can generate profit more often than some other.

    The winning rate is higher when using it

    Really? The truth is that you don’t need a high percentage of winning trades for profitability. That’s the myth.

    Let’s assume you made 3 winning trades out of 4, while your friend makes one winning trade out of 4. Who is more profitable? Don’t say that you are because it isn’t quite correct until you have more info to show us. Hence, we have to know what your win-rate and risk-reward ratios are. For example, you made $40 on your winning trades but you lost $120 on your losing trade. What is your profit? Zero! Your friend had one winning trade and made $100 on his win and lost $80 on losing trades, so his profit is $20. Who is a more profitable trader now?

    The winning rate in the technical analysis is higher is also one of the common technical analysis myths. You can be profitable even with fewer wins.

    Technical analysis software can make you rich

    Maybe we should ask some successful traders this. What do you think, what has made you rich? Which software do you use? The answer will probably be: Are you kidding me? 

    No such software could be effective if you aren’t a good trader. Unfortunately, that is also a technical analysis myth. Also, misunderstanding of trading software. The internet is overflowed with a lot of software, they are cheap or expensive but all will promise you that it will perform all necessary analysis for your profitable trades. They will guarantee a profit. Just be smart, technical analysis software will provide you data about trends and patterns, but couldn’t guarantee profits.

    It’s up to you to properly evaluate trends and all other data.

    You can hear very often that technical analysis is suitable for short-term traders. That is also one of the technical analysis myths. Moreover, you’ll find it is useful for algo-trading, or high-frequency trading. It simply isn’t the truth. The truth is that technical analysis advanced along with the development of technology but traders used technical analysis much before computers appeared. Traders monitored trends by using moving averages 20-day, or 50-day, and some still do the same. 

    Technical analysis works based on the theory that past tradings and stock price changes can be worthy indicators of future price movements. But only if used along with relevant trading rules. Use technical analysis in combination with other methods of research. Also, you shouldn’t limit your research to fundamental or technical analysis when you have plenty of others. The main goal is profit. Remember it.

  • Good Reasons to Take a Loan – Make a Difference

    Good Reasons to Take a Loan – Make a Difference

    Good Reasons to Take a Loan
    Everyone can find good reasons to take a personal loan, but keep in mind that no matter the situation, it must be paid back finally. 

    By Guy Avtalyon

    The personal loan is borrowed money but what are good reasons to take a loan? Where are you gonna spend that money? Would you like to make some large purchases, ease financial difficulties, or to remodel your home?

    You have to pay back this loan in monthly portions typically for the next two to six years. Yes, typically, but it might require more time to pay back it all. It depends on your financial situation and how careful you are with that financial obligation.

    Maybe it may look silly to take out a personal loan for, for instance, personal reasons, but it can be very useful in some cases. Of course, when used and paid back on time.

    Good reasons to take a loan are numerous, but it isn’t a solution for every financial situation. Usually, people take out a loan to solve improper money management. 

    One of the good reasons to take a loan can be if you have credit card debt with high-interest rates. That can be a difficult and very serious problem. The more interest you owe, your payments will be higher, and you’ll need more time to be debt-free.

    The variety of good reasons to take a loan

    As we said, if you have credit card debt and the interest rate is high it is smart to take a loan, of course, if you are qualified, so you could pay off your debt faster since the personal loan is with a lower interest rate. Hence, you’ll spend less money on that obligation. For example, a bad reason to take out a loan is to invest in the stock market. If you want to do that it is smarter to save and then invest.

    If you think that good reasons to take a loan can be your vacation or wedding, we are so sorry but you couldn’t be more wrong. 

    To consolidate debt it is a smart decision

    Actually, it is one of the most common good reasons to take a loan. For example, if you have various loans or credit cards and they all have different interest rates and balances. It might look like open doors to the trouble. To cover them all or a bigger part of them could be one of the good reasons to take a loan.

    When you take a loan and if you use it for debt consolidation, you’ll connect all of those balances into just one monthly payment. By this, the connecting of all debts will make it easier to pay off and you’ll avoid getting overwhelmed.

    A personal loan is at lower interest rates which will reduce the amount of interest you pay and the time to pay off your debt. Consolidation allows you to pay off credit cards with a clear end and shorter time frame.

    If you need money for moving expenses 

    That is one of the good reasons to take a loan if you have to relocate over a long-distance move. Costs could be very expensive on such an occasion. Yes, expensive enough to take a loan.

    A loan can help you move your furniture or other household things. But also, it can help you to buy new furniture for your new home, to pay for the service to transfer your car to another country or something similar. But before even asking for a loan, think will your income be able to cover the pay off your loan balance. This estimation will help you bypass the added burden of paying off your loan when starting a new life in a new place.

    When you have to remodel your home

    Home remodeling is also one of the good reasons to take a loan. Doesn’t matter if you need a new roof, solar panels, a new kitchen, or a swimming pool, it is smarter to take a loan for that to finish. Especially if you don’t have ownership of your home or you want to avoid a mortgage on the home you own. 

    When taking a loan for home remodeling there is no limitation on what you’ll spend the fund on. You can spend on landscaping or hardscaping, hot tub, new windows, paint the whole house, install the new heat infrastructure. There are no limitations. A personal loan is great to help in such situations when you don’t have the cash on hand right now but you’re in need.

    Instead of a payday loan

    If you’re suffering financial difficulties, you may be motivated to take out a payday loan. Be careful, payday loans are expensive and can put you in much worse situations than you were before. Therefore, a personal loan is a better solution.

    Payday loans are easy to get, but they have big risks. For example, interest rates are enormously high,  some lenders will charge you more than 500% in APR.

    Most US states have usury regulations, for instance, that limit the lenders to charge the interest of over 35%. But, payday lenders are allowed to charge their high-interest rates. Regulations on this kind of loan are controlled by the states and some states even forbid any kind of payday loans.

    For example, in California, a payday lender is allowed to charge a 14-day APR of 459% for a loan of $100. Fees on these loans are also high, they can range up to almost $18 per each $100 of loan. So, the better choice is to take a personal loan instead of this costly one.

    Good reasons to take a loan are unplanned emergency expenses

    For example, to finance funeral expenses. This isn’t a pleasant issue and the majority of people avoid discussing it. The truth is that funeral expenses can be very costly. If your family doesn’t already own you’ll have to buy a burial plot, to pay funeral home services, a coffin, and you’ll have to pay some other things which, in total, may cost you up to thousands of dollars. Remember, death is costly besides it is a sad event.

    A loan can be a crucial source to cover all costs when a family member dies. In such a situation everyone needs money quickly and if the deceased person’s savings cannot cover the expenses of the funeral some family members have the opportunity to apply for a personal loan, also such it is the ethical obligation to cover the deceased’s last costs.

    Paying medical bills is another reason to take a personal loan. The loan can be used for corrective surgery, dental intervention, fertility treatments, etc. Each of them can cost over $5.000. Added costs can be medications, aftercare, or medical travel expenses. All of them are possible, and sometimes necessary, to finance by a loan. 

    Good reasons to take a loan: you need to make a large purchases 

    Household accidents can come suddenly. If you quickly need to buy a new fridge, dryer, washer, the new computer for a job but don’t have the money on hand, a personal loan is the first aid. 

    Of course, there are so many expensive things you would like to have in your home such as entertainment things. However, it isn’t a smart decision to take a loan to buy them. Take a loan only for the things you really need for a normal life. Use it to buy the new oven, to remodel and equip the bathroom, for something that is undoubtedly necessary. For example, electronics! You’ll need months of savings to be able to buy them. Instead of waiting, you can take a personal loan and purchase them immediately. 

    Also, if you don’t have tens of thousands of dollars at disposal, you’ll take a loan to buy a new car, recreational vehicle, or boat, for example. 

    Who are lenders?

    Online lenders are set to make borrowing as easy as possible. They will tell you immediately all about your approval, if your application is approved or not, how much you can borrow, and many other things.  This kind of lender will offer lower interest rates and lower fees if they have any. Also, your approval chances are better with online lenders especially if your credit score isn’t great.

    Don’t worry, in most cases online loans are unsecured. That means you don’t need the collateral to get approved. That makes them safer. If you miss paying the loan, your credit score will fall, but your washer will stay at your home and you won’t suffer foreclosure.

  • Head and Shoulders Pattern  – How To Trade

    Head and Shoulders Pattern – How To Trade

    Head and Shoulders Pattern - How To Trade

    Head and shoulders pattern occurs on all time frames. It can be detected visually. The complete pattern gives entries, stops, and profit targets, so traders can easily execute a trading strategy. 

    A valid head and shoulders pattern occurs very rarely. But when it appears, traders recognize it as an indicator that a significant trend reversal has occurred. A usual head and shoulders pattern is held as a bearish setup while an inverse head and shoulders pattern is held as a bullish setup. 

    But let’s start from the shape of this kind of triangle pattern.

    As you can see, the head and shoulders pattern is a chart formation that follows a baseline with three peaks. The outside two, on the left and right side, are similar in height but the middle is highest. This pattern is used mostly in technical analysis because it is broadly accepted that this pattern is a strong trend reversal indicator. One of the greatest advantages of head and shoulders pattern is its accuracy that shows that an upward trend is approaching its end.

    But let’s start from the shape of this kind of triangle pattern.

    Head and Shoulders Pattern - How To Trade

    In the image above you can see a large peak in the middle and smaller peaks from both sides, left and right from it. This pattern is extremely useful for traders because of its ability to predict reversal, from a bullish to bearish.

    And as you can see, the first and third peaks are smaller than the middle one. The horizontal line is known as neckline and all peaks will fall back to this line which represents the level of support. When the third peak falls to the neckline traders believe that a breakout occurred and the bearish downtrend started.

    In our image, you can see a bearish reversal. But if all these peaks are formed under the neckline it would be a bullish reversal.

    How to trade the head and shoulders pattern?

    It’s crucial in trading this pattern that traders wait for the pattern to form. Why is this important? Sometimes the pattern will not develop completely or maybe it will not develop at all. If the pattern isn’t developed completely, meaning it is almost or close to be, don’t trade. Just wait until the pattern breaks the neckline.  

    When you trade a head and shoulders pattern it is crucial to wait for the price move to go below the neckline after the peak of the right shoulder. So the regular pattern has one smaller peak, one fall, second higher peak, second fall, third smaller peak, and third fall to the neckline. Wait for the price action to break the neckline and then trade. When you have an inverse head and shoulders pattern, you should wait until the price action goes above the neckline, once when the right shoulder is formed.

    Open a trade only when the pattern is complete. 

    It is very important for any trader to have a plan before entering the position. For example, the best way is to write down your entry point, stop-loss, and profit targets. Also, do the same with variables that might alter your stop or profit target.

    For the head and shoulders pattern, development time isn’t a crucial element since it can develop over any period of time. Yet, traders believe that pattern that takes a longer time to form is more significant. Meaning, the probability to identify a significant price reversal is greater.

    How the head and shoulders top pattern shapes

    The head and shoulders pattern appears in the precise order and we’ll describe it. Keep in mind that we have only one variable here. It is how long it will take to finish each step in the sequence.

    As we said, in trading the head and shoulders pattern, we have to wait until the price moves a bit under the neckline after it reaches the peak of the right shoulder. For the inverse, wait for the price action over the neckline.

    Once the pattern is complete, we can initiate the trade. Traders usually enter the trade when a neckline is broken. But this is not the only entry point. The other method demands more patience since it’s based on the possibility that the movement may be missed completely. For this entry point, we have to wait for a pullback to the neckline after a breakout has already happened. This is a more conservative method. The point is to be sure if the pullback will stop or continue the original breakout. This is important because if the price continues to move in the breakout direction, we will have a missed trade.

    How to place the stops?

    In the conventional head and shoulders pattern, traders commonly place the stops above the right shoulder, just after the neckline is broken. The other way to set stops is to use the head of the pattern as a stop. This approach is risky and your risk-reward ratio can be reduced.

    When we have the inverse pattern, set the stop a bit below the right shoulder. Also, as previously explained, you can place the stop at the of the head and shoulders pattern, but you’ll be at exceptional risk once the trade is taken.

    How to set the profit targets?

    First, we have to explain that the profit target in this pattern is the difference in price between the head and low point of any shoulder. When you find out that difference, just subtract it from the neckline breakout price. It is important to provide a price target to the downside for a market top, right?

    For the market bottom, the difference should be added to the neckline breakout price to provide a price target to the upside.

    Here is an example.

    Let’s say that $100 is high after the left shoulder and $90 is the low of the head, so the difference is $10. And let’s say the breakout is $100,50. What you have to do is to add the difference to the breakout price, which is $110,50. That is giving us a target price of the same amount. 

    In the case of the regular head and shoulder pattern, you should subtract this difference from the breakout price.

    We already mentioned a timeframe. Sometimes traders will wait more than several months until they reach the perfect profit target after noticing the breakout. That is the reason to monitor the trades in real-time.

    Head and shoulders pattern really serves

    It is impossible to find an ideal pattern that will work in any circumstances and all the time. But we’ll point out several reasons why this pattern works.

    Firstly, when the price drops from the market high (which is the head in the patter), sellers would enter the market and there will be less aggressive purchasing. Further, when the neckline is met, traders who purchased in the last wave higher or on the rally in the right shoulder of the pattern, are confirmed wrong and thus facing large losses. They will exit their positions, which will drive the price to the profit target.

    The importance of stops

    Setting the stop above the right shoulder is reasonable because the trend can move downwards if the right shoulder is lower than the head. So, there is a little chance for the right shoulder to be broken until an uptrend continues. The profit target reveals that traders who made wrong trades will exit their positions, which will create a reversal. The neckline is a painful point for many traders. Many of them will decide to exit the positions, which will drive the price to move closer to the price target.

    Also, you can examine the volume from this pattern. When the inverse head and shoulders pattern occurs it would be ideally the volume to grow as a breakout happens. This presents a rising buying interest. It is very important because it provides the price to move closer to the target. When the volume is decreasing, that means that the traders’ interest in the upside move is lower.

    The traps of trading head and shoulders pattern

    Nothing is perfect and this pattern also. You can be faced with some problems when trading this pattern.

    First of all, this pattern isn’t easy to spot. More harder is to wait until it develops and completes. Sometimes you’ll have to wait very long. The other problem that may occur is stop-levels. It is hard to set the proper stop level. Also, the profit target couldn’t be easily reached every time. Sometimes, you’ll need more detailed data to uncover how the market condition may influence your exit from the trade.

    One of the widely spread beliefs is that this pattern could be traded always. It isn’t true. 

    For example, when you notice a massive decrease in one of the shoulders caused by some event, your calculated price targets will not be reached. Also, not all traders are able to notice this pattern. Some will do it without a problem but the others will never notice one.

    Bottom line

    We hope you have a better understanding of the head and shoulders pattern now. If yes, put it to work. Try to recognize both the head and shoulders and inverse head and shoulders patterns. When you recognize them, just monitor the development. This pattern can help you to find trends ahead and establish fair targets. Also, you’ll be better prepared to enter the trade when the time is right.

  • Metrics For Short Selling Stocks

    Metrics For Short Selling Stocks

    Metrics For Short Selling Stocks
    Different traders can adopt different metrics for short selling stocks but these few can point out the current market positioning and traders’ sentiment.

    Metrics for short selling stocks are used to uncover the potential short-sell candidates and to track the activity on stocks. There isn’t a formal method but, in short, different traders use different metrics for different purposes. The common thing for all of them is to recognize the best candidates for short-selling and to track them.

    Of course, each trader is unique in style, appearance, or goal and the same comes when deciding what metrics for short selling stocks they use.

    Some traders would add many variables to take into account everything that possible can influence a company’s earnings. For example, they will examine all factors that might cause the earning to go lower which would show a great opportunity for short-selling the company’s stock.

    However, other traders will look at a few important metrics for short selling stocks in several main variables but they will examine them in-depth.

    But both types of traders would like to gather as much as possible data, so it isn’t unusual that there is no clear separation on categories. So, metrics for short selling a stock can be divided into several different methods of measuring. We will present to you several metrics that we found to be important.

    SIR as one of the metrics for short selling a stock

    Short interest ratio or SIR, basically tells traders the number of shares available for short selling. If this SIR ratio is high that means that there is higher attention on that stock because short-sellers are expecting the stock price to fall very soon. That also means that traders believe that the stock is currently overvalued and they assume the stock will fall in price.

    For traders, this is a bearish indicator, meaning the market is pessimistic on that stock since it has a high short interest ratio. Should traders get into stock with a high short interest ratio? That depends. If high SIR is caused due to mispricing there are a lot of chances to go short with it. But SIR can be high due to the fact that the stock is simply bad. The ability to make a distinction why the SIR is high makes the difference between winning and losing trades. 

    As you know, short-sellers have to buy back their position if they want to profit and that might cause increasing interest and the stock could increase in price. This uptrend may occur very fast if too many short-sellers would like to cover fast in a short time frame. This situation is described as a short-squeeze. The consequence is that traders will not profit from this trade.

    Nevertheless, the SIR is one of the metrics for short selling stocks and can be calculated to get a quick tip if the stock is massively shorted or not, compared to its daily trading volume.

    SIR is easy to calculate, the total shares held short should be divided by the average daily trading volume of the particular stock. 

    SIR = Short Interest / Average Daily Trading Volume

    The short interest ratio

    You can find more than one definition for the short interest and several ways to calculate this ratio. The short interest ratio could mean the same as the days to cover or the short interest as a percentage of float.

    But the principle is the same: a stock with a high short interest ratio has a high number of shares sold short or, in other words, a low number possible to trade. 

    The short-interest ratio is simple to calculate. Take the number of currently short sold shares and divide that number by the average daily trading volume for the particular company. For example, if traders have shorted 6 million shares of that company and its average daily volume is 2 million shares then the days to cover is 3 days. Hence, if all of the short-sellers want to close their positions at the same time, it would take around three days for them to do so.

    The ‘days to cover’ expresses the total amount of time for all short sellers participating in the market with particular stock to buy back the shares that the broker borrowed them.

    Short Interest To Volume Ratio = Current Short Interest / Average Daily Share Volume

    “Days to cover” is a useful ratio for traders. 

    High value to this ratio is a bearish indicator. It might be a signal that everything is not great with company performance.

    It can be a sign of how bearish or bullish traders are about some company. Also, traders could get the idea of potential future buying pressure thanks to this ratio. The short-sellers don’t have too much time to buy back stocks and to get out of the position. Hence, this is one of the possibly most important metrics for short selling a stock. Naturally, they want to buy the shares back at the lowest price possible. Hence this need to get out of their positions could force prices to move higher. The longer the buybacks take, the longer the price rally will continue. A high “days to cover” ratio can be a signal of a short squeeze.

    Short interest ratio expressed in percentages of float

    The other way to calculate the short-interest ratio is by dividing the number of shares sold short by the total number of shares available for shorting. But expressed in percentages.

    For example, the company has 20.000 shares but 5000 shares are locked-in and cannot be sold because the company gave them to the management. So, the company has a so-called public float of 15.000. Let’s say that another 5.000 are sold short. So we have to calculate the short-interest ratio.

    (5.000/15.000) x 100 = 0,33 x 100 =  33

    This gives us a short interest ratio of approximately 0,33 or 33%.

    Short interest of float above 50% means that short-sellers wouldn’t have an easy covering of their positions if the price turns to rise.

    How to trade by using metrics for short selling stocks?

    The same as we use metrics to evaluate the stock, these metrics can be interpreted in several ways.

    For example, when we have many short-sellers on one stock, it may be because the company isn’t successful. There are numerous reasons why the company isn’t profitable. Sometimes it can be due to the market shifts and the company’s business model that became unprofitable. Also, maybe the officers of the company are connected to some gossip about possible nefarious actions.

    Or the other example, a high short interest ratio could be a signal that the stock is a bargain. When some company is developing a new product, reports in its early stage might indicate the product could be risky. What is possible to happen? Short-sellers will open their positions driving the short interest above, for example, 20%. But later, when the product appears as very useful and popular, short-sellers are forced to cover their positions because short interest is high. This could cause the stock price to rise, and there will be a strong rally. 

    This potential for unexpected rallies in stock with a high short interest ratio, causes many experienced traders to see this metric as a bullish indicator.

    Bottom line

    Different metrics can be used to classify short-sell candidates. But these metrics are worthless if you never compare SIR and current short interest with previous levels and recognize possible overexpanded levels of stock. Compare the current metrics for the same company’s performances over time. Metrics for short selling stocks are worthless if you don’t do that. Your plan to become a short-seller will probably fail, and you would end up empty-handed.

  • Short Selling Stocks Carries Big Risks and Profits

    Short Selling Stocks Carries Big Risks and Profits

    Short Selling Stocks Carries Big Risks
    Many investors made money by “short selling.” How did they manage that? Short selling strategies offer high risk but high rewards.

    By Guy Avtalyon

    Short selling stocks carry big risks, but when this trading technique is done properly, it might provide huge returns as much as big losses if it isn’t done properly.

    In short selling stocks, traders are placed to profit when and if the stock price goes down. This strategy isn’t suitable for long-term investors with the maxim “buy low, sell high.” The point with short selling stocks is to sell high and buy low. For example, when investors believe that the company is overvalued they will sell its stock short.

    The strategy is criticized and from time to time meets aversion from company managers, policymakers, and in the public. 

    Is this strategy legal? Of course, it is absolutely legal. 

    What is short selling a stock?

    Shorting a stock happens when a trader borrows the shares from the broker but under specific conditions. The trader is obliged to return the shares later. The stock can be sold immediately. Short-sellers are betting that the stock price will fall further. If the stock price drops, the trader is in a beneficial position because the trader can repurchase the shares at a lower price and return them to the broker. The difference between these two prices is the trader’s profit.

    That’s the beneficial part but there is a risky part too. The problem with short selling stocks may arise when the price rises and continue that because the upward trend increases. That may force short sellers to get out of the trade. It could cause the so-called short squeeze.

    If more short-sellers cover their position by buying the stock, the expanded volume can launch the stock price much higher. So, short-sellers will have big losses. 

    The risk of loss on a short sale is endless because the price of stocks or any other asset can grow to space.  

    Is Short selling stocks risky

    Short selling stocks can be a very helpful and profitable technique for traders but some circumstances have to be met. Also, it carries big risks. To make this clear, when you buy stocks, in the worst possible scenario, if everything is against you your potential loss cannot go over 100% of your total investment. But your gains are potentially unlimited. On the other side, when shorting stocks your potential losses could be unlimited, but your gains couldn’t go over 100%.

    Another warning comes due to the increased costs that you don’t have when buying regular stocks. The first notable cost comes from your broker. So, you’ll have, as a short seller, to pay for borrowing stocks. Your broker will charge you that. That could be extremely expensive. Sometimes, borrowing costs could be bigger than the value of trade, for example, you want to borrow some stock that is especially difficult to borrow.

    The other risk comes from the side of a specific account you’ll need to execute the trade. Short selling can be done in margin accounts only, so you’ll need to pay margin interest on your position. 

    Further, you’ll be a short seller obliged to pay dividends on the borrowed stock. This financial obligation can take a big portion of your gains.

    Additional risk comes when you borrow heavily shorted stocks. They are very often subject to buy-in. That appears when the broker covers a short position at the market price but has no obligation to warn you. This situation can happen when the lender, stock owner from whom the stock was borrowed, demands from the broker to return the stock. In this situation, without warning you, the broker will cover your short position at market price even if it is the worst time for you.

    How to short a stock?

    Of course, we’ll give you a powerful example of how short selling works. 

    For example, you borrow 100 shares of ABC company that’s trading for $20 per share. That shares are sold very quickly for $2.000 in total.

    After, in our example, the stock price drops to $15 per share. Now, you can buy that 100 shares for $1.500 and return them to the lender. Your profit will be $500 minus fees. 

    As a short seller, you borrow stock from the broker. The broker is one who holds stocks for investors who own a great number of shares. But stocks for short selling aren’t always available because all of them are already borrowed and sold. 

    On the other hand, some brokers don’t like short selling and rather will stay away from that. They will not participate in it.

    How short selling stocks can be a bad thing?

    Short-sellers are actually betting that a stock’s price is going to fall soon. But instead of buying, they are borrowing the shares. We explained the whole process above.

    Short selling is actually a bet against a stock, but it is not the only way for short selling. For example, if a seller believes the price of a stock will fall, the seller can buy a “put.” That means the seller will by the right, but not the obligation, to sell the stock at a predetermined price at a specific date in the future. 

    If the price drops below the price accepted in the “put,” the buyer has the right to buy that “put” at this lower price and sell at the “put” price. In this way, the buyer would make a profit. There will be no sales if the price doesn’t drop below the”put” price. The trader who bought this “put” can lose only the amount paid for that, so the whole risk goes to the seller.

    Some other bad things related to short selling are not in connection to stocks but maybe, this is the right place to mention them. For example, a trader can buy a “credit default swap.” If the price of the security falls or failure which is possible with bonds, for instance, the buyer of the swap will get the amount equal to the par value of the security. That’s how the short-seller will profit on security drops and, what is more interesting, the short-seller doesn’t need to buy the security, such can buy the “swap” only. 

    Betting against security in this way is a bit like buying fire insurance on the apartment of a friend but a trader knows that the building is old and not built from a solid material and, also, his friend doesn’t pay too much attention to safety. 

    Some people don’t like short-sellers because they think that this kind of trading is immoral.

    Critics of short-selling  

    Critics of a short-selling claim that it generates unwanted and extreme ups and downs in the stock market which may have a bad influence on the wider economy. 

    The significant short-selling on the stock of some company has the same impact on the company because it might cause drops of stock’s value and price will drop.

    Some investors who started to learn about short-selling probably think the short-sellers know some unusual techniques if they want to make success. So they greatly sell their shares, and what happens? Does the stock price drop? Of course, and the short-sellers are the winners. 

    Proponents of short selling 

    They think it is a valuable practice, a technique to force companies to work productively. And it is obvious how they do that. For example, if some company doesn’t work well, the short-sellers will bet against it. Defenders think that short-selling can be stimulative to the companies because it can force the companies to be responsible for their failures. 

    That’s the exact meaning of the stock market, someone will lose, the others will win. 

    Short selling can be a true problem when used as “short and distort.” For example, a hedge fund can short the stock of a company and then begin to discredit the performance of the company. If such a campaign causes a decline in the price of the stock, the hedge fund wins but that gain doesn’t come because the company was really weak. This is an example of manipulation. 

    Short selling stocks is one of the most effective ways to make money when the market is in an extended downtrend. But you must have a deeper knowledge, deeper than it is necessary when buying stocks.  

    You have to know how to handle risk and keep the chance in your favor. Even before you start shorting stocks. That’s why only really experienced traders can follow this trading technique with success.

  • Trading Mistakes and How to Avoid Them

    Trading Mistakes and How to Avoid Them

    Trading Mistakes and How to Avoid Them
    If you have losing trades it is possible you have too many trading mistakes. Recognizing mistakes is half of the battle. The other half is how to avoid them. 

    Trading mistakes are common both for traders and investors, for the novice and experienced traders. Even though traders and investors practice different styles of trading, they often make the same trading mistakes. Some of the mistakes are more costly for investors, some for traders. For both kinds of market participants, it is essential to understand these common trading mistakes and avoid them. Think about bad trades as a process of learning and after you collect a significant number of them you’ll be more experienced and able to perform better trades. But this process can be shorter if you have an upfront understanding of where trading mistakes could arise. 

    That could give you a chance to react correctly and quickly enough to protect your investment portfolio. 

    Here are some trading mistakes that happen to both experienced and novice traders. These suggestions could help you to recognize them and give you a chance to avoid or correct them. So you should be able to gather the profits!

    Trading mistakes that traders shouldn’t do when trading

    Never risk a huge amount of your capital or going all-in. We all have a great expectation to earn a huge amount of money but one of the trading mistakes is putting all capital into a single trade and expect that could provide you great profits. How is that possible if every single trader, when asked, knows about the 1% rule. That means you should never put more than 1% of your capital into one trade. This is one of the common trading mistakes because traders constantly try to gain it all back. Mostly without a risk management trading plan. But even if you have a trading plan, sometimes you’ll be pushed to ignore it. You could be motivated to take a large trade which usually you wouldn’t. Don’t do that, try to resist. Stay stick to your risk management trading plan. The temptation can be a very bad companion in stock trading.

    Even if you think you are ready for a big portion in a single trade. Trust us, you don’t want to jump into the deep end. Especially if you are not skilled enough. Going all-in may cause unpredictable damages, financial and emotional, so great that you may decide to give up the stock trading forever. 

    The much better approach is to trade gradually at regular intervals and slowly increasing the amount per trade. In this kind of approach, you have two benefits: you won’t put all investment capital at risk and you’ll remove emotions when deciding when to buy a stock. 

    Not having a trading plan is a great mistake in trading stocks

    Among trading mistakes, this particular is maybe the most dangerous. If you don’t have a trading plan how will you know when to enter the trade or exit the trade. Skilled traders get into a trade with an outlined plan. They know their precise entry and exit points, how much capital to invest in the single trade, and what is the highest loss they want to take.

    Novice traders usually don’t have a trading plan before they start trading. Even if they have a trading plan, beginners could be more apt to turn out of the plan and take more risks and reverse the course totally.

    For example, they enter the trade with the belief that the stock price will rise shortly after they enter the position. That isn’t going to happen! But this fact is known to experienced traders, beginners don’t know that. And what happens the next is the trade is going against them. But most of them will not exit the position, they will hold in the hope that the price will go up. And the price continues to fall more and more but they don’t want to sell the stock, they don’t want to take the loss and end up losing everything. That is one of the most dangerous trading mistakes. 

    Further, even if they found a great entry point and the price starts to rise. Honestly, it could be a matter of luck, not knowledge. What do beginners do? They become greedy. Instead of selling stock and taking a profit, they hold the position. Very soon, the trade turns against them, and a winning trade shifts into a losing trade.

    Shorting stocks too early 

    If you short the stock too early it is more likely you’ll be destroyed on your shorts. Everything that flew always landed. This is especially true of stock trading and pumps and dumps. 

    For example, you notice a stock in the early stage of a pump. You are happy to buy and drive along as it increases. But at some point, it starts to drop, and you may profit by selling short. But when is that moment? When you have to go short? The timing is extremely important. What if you sell too soon? How to recognize that exact moment for short selling? First, you have to find the top on the stock. That means you have to recognize the resistance level. That is the point where buyers are leaving, but also the point where the sellers appear and begin to take over the stock.

    Short selling is dangerous anyway and only experienced trades should use it. If you practice this strategy or want to, be careful. Without proper knowledge and experience, you’ll jump into one of the biggest trading mistakes.

    Use stop-loss orders to avoid trading mistakes

    Cutting losses is a very serious issue. If you don’t cut your losses quickly you could lose everything. This mistake apparently takes most of the money. Avoiding to admit that we’re sometimes wrong, we are actually admitting we’re human beings. Nothing is wrong with that. People are doing that all the time. Sometimes it can be good. But not in trading stocks. 

    The main problem with trading and you cannot find many people that would like to admit that, is that there is no possibility to be correct on your trades 100%. The best traders are correct under 80%. How do they manage to not blow up their accounts? Simply, they know when they are wrong, they recognize that and admit that. When wrong trade occurs just get out fast. Why will you wait? To make more losses? No one would like that. Just admit you are wrong and exit the trade while you still have a chance to reduce losses. 

    But you must decide about your risk before you enter a trade. You have to know your risk to reward ratio and how much you are comfortable to risk.

    When you identify what you’re ready to risk, enter the trade. But that is not the end. 

    Set a stop-loss order 

    You have to set the stop loss. For some traders, it sounds unnatural to enter the winning trade and promptly set stop-loss order. We have one question for them. Is it natural to lose all capital invested? And, yes, there is a possibility to lose everything without setting a stop loss. In this way, you’ll avoid making huge losses to your account. 

    Never neglect stop-loss orders. That will prevent you from extreme losses and lock in profit when you have winners. You have to set a stop loss for every single trade.

    You might think you don’t need this order while you are sitting in front of your computer all the time. But you don’t have that single one trade to monitor, sooner or later you’ll have more of them. It’s almost impossible to monitor several trades at the same time. Changes are speedy and it could happen that you don’t notice the stock is losing support. In that situation, everyone would like to get out as fast as possible. The stock price could fall a lot faster than you are able to set your sell order in. And what did happen? All your profits are wiped in a second. By setting stop-loss orders at the moment when the trade is filled. 

    Bottom line

    Trading stocks is not an easy job. It takes discipline, time, and knowledge. Some traders can’t handle it and gave up. Also, there is one thing you must know before entering this marvelous world, the most important part of trading is preparation to execute it.

    You cannot find a lot of people out there to help you figure out what trading mistakes to avoid. We pointed several but there is much more. To be prepared to avoid them, you have to learn and not be greedy. 

    As we said, trading isn’t easy but can be very profitable if performed properly. It’s okay to be wrong from time to time, but if you are wrong all the time you’ll never become a successful trader. Just admit your trading mistakes, examine what went wrong, and continue with success. While trading, your emotions must be under control. Okay, some level of fear is favorable, it can protect you from meaningless and harmful moves. But you have to be honest with yourselves and admit when you made mistakes. To remember them better, write it down in the trading journal. That will make things easier in the future.

  • Apply For a Personal Loan – Step by Step Guide

    Apply For a Personal Loan – Step by Step Guide

    Apply For a Personal Loan - Step by Step Guide
    Before you apply for a personal loan it’s important to consider why you need the money. Depending on that, you will choose the loan that’s most suitable for your financial circumstances.

    By Guy Avtalyon

    A personal loan is a convenient vehicle to cover a large expense if you have them but many people are confused with it and don’t understand how to apply for a personal loan. The problem is that many of them have not so good credit scores but there are some possibilities to increase their chances of approval during the process. 

    Before you apply for a personal loan you’ll have to define what type of loan you want to take out. There are several types and you have to know each of them before you start the process. 

    Personal loans can be an unsecured, secured, variable-rate or fixed-rate loan, debt consolidation, co-sign, a personal line of credit, and many other types but these are the main. A personal loan is frequently unsecured. That means it uses your credit as a gauge. To take out this type of personal loan the lender will not ask you for assurance in some other asset, for example, house.

    The second checkpoint in your deciding process before you apply for a personal loan is how much money you need.

    That amount should be suitable to cover your expenses but also, your income has to be suitable to cover the monthly charge you’ll be obliged to pay over the life of the loan. Your personal loan should be less than your maximum monthly expense but also not too small. 

    If you take out a too big loan that surpasses your income per month, you’ll jump into big financial problems. So, when deciding to apply for a personal loan you have to plan based on current income, not upon the expected. Also, applying for a personal loan that is too small will not be sufficient to cover your financial needs. So, you should carefully measure the debt you can handle, and before you apply for a personal loan.

    Select the right type of lender

    Think about what is most important for you: support or speed. You might choose banks or credit unions that are both experienced and if you are already a customer of some you might have some benefits, for example, discounted rates. The problem with these traditional lenders is that the application process may take too much time. They always require a lot of papers and that may eat your time. If you are in a rush maybe online lenders are better for your needs.

    If you choose some online lender it is probably because you need cash fast. We hope you compared various lenders before you apply for a personal loan. It is extremely important, you could find some with the lowest rate. Anyway, if you pick an online lender, you’ll have a lower rate, much lower than it is the case with banks and credit unions. Moreover, they’ll give you an opportunity to see the rate before you apply for a personal loan. In many senses online loans are unique. 

    You can compare rates by pre-qualifying, there is no need to go anywhere instead you can apply for a personal loan on a website, and what is most important for those who are in a rush, you’ll get approval in a few minutes and after a day or two, your loan will be funded.

    By selecting the right type of lender can save you money.

    Check your credit score before you apply for a personal loan

    Your credit score determines how much you qualify to borrow or you are not at all. Your chances of getting a loan will increase with a better credit score. Also, your credit score will determine the rate.

    Where to check credit score?

    Find some credit scoring service. For example, we suggest you use FICO. FICO score is a measure of consumer credit risk. It is a standard of lending in the US.

    A FICO score is expressed as a number, and it will determine your creditworthiness. That is your credit score. FICO scores are in the range from 300 to 850, where the higher the number represents a better credit score. 

    The credit score of 740 and over is excellent. Between 670 and 739 is considered as good, between 580 and 699 is rated as fair, and everything below 579 is ranked as poor credit score.

    The lenders will expect good credit and you’ll need one year of credit before they approve you an unsecured personal loan. It is smart to check your credit score before you apply for a personal loan. 

    Check the lender’s demands  

    This sounds logical but many people unveil the lender’s eligibility requirements after they apply for the loan. Don’t waste your time. If you don’t meet its requirements you’ll be rejected promptly. Apply only if you are eligible for.

    Typical demands include a good credit score where the lowest average is 640, also your annual income is one of the lenders’ requirements and you’ll need to have above $25.000. They will also ask you for your credit history of at least 3 years to qualify. The lenders will estimate your debt-to-income ratio or DTI. Lower than 43% is better.

    Before you apply for a personal loan you’ll need to have a good DTI because it has a great influence on your interest rate or loan terms.

    A debt-to-income ratio shows the debt payments you have every month divided by your total income per month. Lenders estimate your DTI to be sure that you can afford to pay a new loan. Usually, the lenders will calculate your DTI themselves but it is much better if you know your DTI before applying. For example, if you find out your DTI is high, think about paying off your other debts. Otherwise, the lender will offer you too high rates or reject your application.

    Examine lenders

    Examine everything, interest rates, fees, terms, payment options, fine print, literally everything before you sign papers, and fill out your application. Why is this important? First of all, you have to be sure how safe you are. For example, you can find in the lender’s fine print a note about prepayment penalties or late fees. That could be a great problem if there are any and you didn’t know before you signed the documents. Check your lender, ask, examine. 

    When it comes to online lenders you should be especially cautious. Choose the lender who is registered and has all information available. If some info is missing, check the lender’s credibility, it could easily be a scam and you’ll end up giving your personal and banking details to a scammer.

    Collect your documents before you apply for a personal loan

    It is always better to have all documents on hand. In that way, your applying will go faster and you’ll receive approval sooner.

    The lender in the US will tell you which documents it demands, but it will frequently be some ID, passport, driver license, or similar. Also, the lender will ask for your proof of employment. You can show your pay stubs for the last three months or a W-2 form. You have to have a bank statement also to provide to the lender information about your total income. To be able to check your credit score, the lender will ask your social security number. 

    Some lenders or online applications will require your current company’s contact info but some will ask you about previous employers.

    So, prepare all these documents to get your loan as soon as possible.

    Consider rate and fees

    The main considerations when looking for a loan should be its rate, fees, and terms. Will you choose an online lender or a bank branch is less important.  Always apply for pre-approval. Online lenders, banks, or credit unions will give you this opportunity. Based on the data you submit, you’ll know some important things such as the rate (maybe not precise but very close) or loan duration and other conditions.

    Some of the best-known national banks don’t have unsecured personal loans in offers. They have some other credit products, for example, mortgages, credit cards, etc. Credit unions are good for borrowers with a bad credit score. But to apply for a personal loan, you need to be their member first.

  • Sell in May and Go Away Strategy – Repeated Every Year

    Sell in May and Go Away Strategy – Repeated Every Year

    Sell in May and Go Away Strategy
    April is the past, and May is here. “Sell in May and go away” is an old saying that investors repeat every year without giving any actual belief to. Should they?

    “Sell in May and go away” is a popular maxim in the market. Investors noticed that some stocks are underperforming over the summer when they compare their performances to the winter period. The stock market summer-period starts in May and finishes at the end of October. The six-months period from November to the end of April is known as the winter period in the market.

    Sell in May and go away is a strategy which investors use to sell their holdings in May and come back again in November to invest. They usually sell their holdings in late spring, sellings are not in May exactly.  But nevermind. We have “Sell in May and go away” as a well-known saying in the market.

    A lot of investors find this strategy is more comfortable than staying in the markets over the whole year. They believe that when warm weather occurs, volumes are lower and the number of market participants is also lower. Investors hold that vacations may cause trading to become riskier and, at least a lifeless period in the market.

    Where the saying “Sell in May and Go Away” came from

    The old custom among English aristocrats was to leave the city of London and spend their vacations in the countryside and come back to London in early autumn when St. Leger’s day is. So the full phrase is: Sell in May and go away, and come back on St. Leger’s Day which is in September. For British aristocrats, it was a very important day because it was a race day for pureblooded horses as a final part of the British Triple Crown competition.

    Later, traders from America adopted the habit of going on long vacations after Labor Day. Moreover, they adopted this phrase as an investing saying. What is really interesting, all data from almost the whole of the past century confirmed the theory behind this strategy.

    For example, in the span of 60 years, DJIA reported average returns of 0,3% during the period from May to October. In contrast, in the same span of 60 years, the average return was 7,5% from November to April.

    But despite the historical background of this seasonal trading pattern in disparity in performance during summers and winters, it looks that it isn’t relevant in modern times. In recent years, some excellent runs occurred during the summers, the stock markets were very dynamic and generated lucrative gains to the investors who stayed in the market. 

    Some markets closed higher in May and rose in June giving an increase of over 50% from the end of June until the end of January. So, the phrase “Sell in May and Go Away” isn’t correct anymore.

    “Sell in May and go away” strategy 

    Some investors use this phrase as a strategy to manage a portfolio over the summers based on the perception that markets underperform during summer. They believe that lower trading volumes from May till October can boost share price volatility and weigh on stocks also. Selling off in May is a method to react to the slowdown. Our suggestion is to look at facts before you adopt this strategy.

    The strategy requires the stock allocation before and throughout the summer months to protect your portfolio against seasonal changes in trading. That means you would sell off stocks you own in May, then stay out of the market for the summer. When the autumn comes you would buy stocks back.

    In an academic study of the saying “Sell in May and go away,” we found that from 1998 to 2012 the returns from November to April surpassed the returns generated from  May to October by nearly 10%.

    Maybe this strategy is good because you’ll be out of volatility that might occur during summer, so you would be able to protect your portfolio from losses caused by volatility. Also, when you reinvest in autumn and do it just before stock’s upward trend you’ll probably generate better returns. The problem might occur when to seek what stock to buy and when to do that. In other words, timing the market is the key question.  

    That can be a critical part because timing the market isn’t a precise science. Actually, it is difficult for even the most skilled investors.

    The other benefit is that you would have a chance to re-evaluate your portfolio and remove losing players. But for this to do, you must have a great understanding of the market subtleties. For example, how a particular stock acts during different periods of the year. 

    For long-term investors, this strategy might be irrelevant but investors with a shorter horizon or for active traders it can be very profitable since they have a more active approach to investing.

    Drawbacks of this strategy

    Sitting out the stock market during the summer and having a long, long vacation might seem attractive, but you have to be cautious. What if there is the potential to miss out on great opportunities? The 

    This strategy is based on past trends. But here is the key problem. Not all investments or stocks will act according to this date-based investing, that to say.

    The “Sell in May and go away” strategy neglects the performance of particular assets or prevailing market or economic circumstances, changes in interest rates, or inflation, for example. Also, as you already know, everything and literally anything may influence the stock market. It might be the political atmosphere, natural disasters, change tariffs, etc. For instance, you sold your stocks in May but they hold strong during the summer. What the consequence can be? It will cost you your gains. No one has the ability to predict what the market will do during a few months.

    The impact on your portfolio is very important also when we talk about the “Sell in May and go away” strategy. It is very important, even if your stocks hold steady, to invest constantly, which means, you shouldn’t avoid summer investing. Otherwise, your portfolio could be hurt. 

    Time is probably the most influential tool you have as an investor. This is all about compounding interest and how long you are invested. That is the power of the time. If you go in and out of the market you will lessen the chance for your portfolio to grow. Also, to compound.

    The “Sell in May and go away” strategy can cause increased trading costs. Yes, online brokerages offer commission-free trading, but not all of them. Also, free trades could be set for stocks or ETFs but what if you sell options in May?  When you buy them back later, the fees could be higher which could lead to lower returns.

    Maybe the most important drawback of this strategy is that it could go against you. For example, the volatility is increasing in May and you decide to get out of the market because you’re panicked. Well, in June, for example, stock rebound, the prices increase. What do you have? You’ve missed the opportunity to get the returns.

    Bottom line

    Instead of “Sell in May and go away” strategy, sometimes rotation is a smarter move. This means, to not sell your investment and cash it out. It is better to diversify your portfolio to the assets that could be less influenced by the seasonal slow market growth. For example, the health or high-tech sector.

    For retail investors with a long-term objective, a buy-and-hold strategy continues as the best choice.