2 min read
(Updated Oct. 21)

by Gorica Gligorijevic
A golden cross is a technical indicator appears when a faster-moving average crosses a slower moving average. That is the simpler explanation. More important are the moving averages which create the cross.
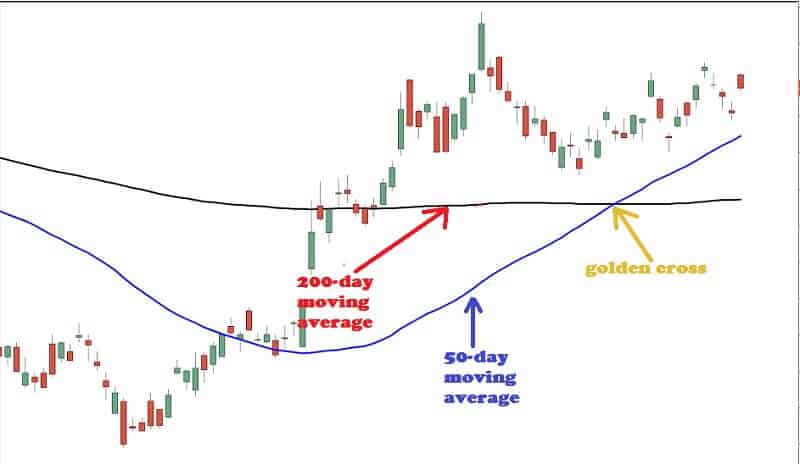
To find this pattern you have to observe the 50-day and 200-day. Only these two periods are valid in forming this pattern. When you notice a golden cross happen you will something like this

This pattern is an extremely powerful sign of a strong bull market. It is an uptrend and traders like when seeing this on the daily charts.
On the chart above you can see the point where the lines of 50-day and 200-day periods touch each other and make a cross.
Traders always see the golden cross as a Sangraal pattern. Their opinion is that the golden cross pattern is one of the final signs of a bull market. That is a definite buy signal.
Traders-Paradise wrote about Bitcoin golden cross. But it occurs in stock trading too. For example, last time when this pattern was seen in the S&P 500 Index, the index has risen by more than 50%.
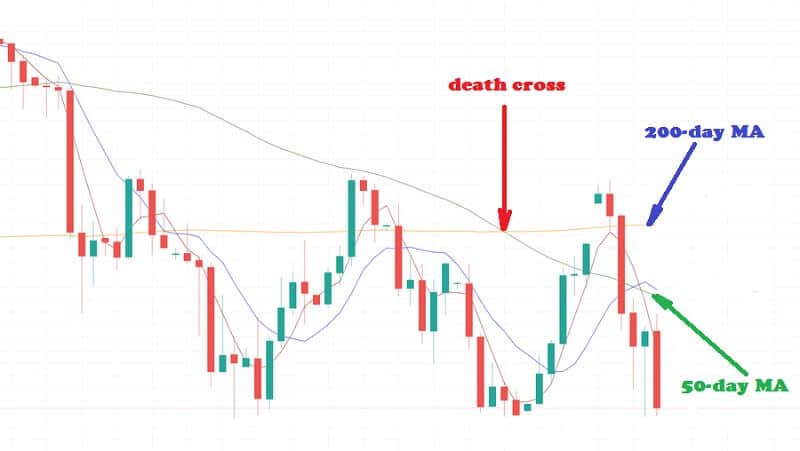
The opposite indicator is the death cross. The death cross happens when a 50-day moving average crosses from above to under its 200-day moving average. The death cross shows a bear market going ahead. When death cross appears you will see this pattern on your charts.

But our topic is a golden cross.
This cross pattern has three explicit stages. The first stage is the point where a downtrend is but you can see it is on its last legs. Why is that? The selling interest is defeated by a stronger buying interest. More traders are willing to buy.
The second stage includes the development of a new uptrend. The breakout of that uptrend is noted when the short-term MA crosses from below to above the long-term MA. And you can see the point of the golden cross.
The third stage is when the new uptrend is extended, and more gains verify a bull market. During the third stage, the golden cross’ two MA acts as support levels when occurring corrective downside retracements. The bull market is intact while the price and 50-day MA stay above the 200-day MA.
How to use the pattern
The golden cross is useful to discover the right time to enter or exit the market. This indicator is a good tool that can help you to know when it is reasonable to sell and when it is better to buy and hold.
When you are looking to buy an asset, it can happen to enter the market when the asset’s price increases above the 200-day moving average. Sometimes it is better than waiting for the 50-day MA to secure the crossover. How this can be better, you may ask?
The pattern is usually a lagging indicator. What does it mean? This means it may not happen until the market has already changed from bearish to bullish. It may be used as a sign that the bear market is finished. So, it is time to exit your positions.
The golden cross is used to trading individual assets as well as market indexes, for example, the Dow Jones Industrial Average. Also, you can use different MAs to notice a golden cross. For instance, you may use the 100-day MA instead of the 200-day. This pattern can also be viewed for an hourly chart, for example.
The bottom line
Some traders and market analysts don’t think the golden cross, also the death cross, are strong trading signals. The cross pattern is usually a very lagging sign, as we mentioned. The Cross pattern has short predictive importance but it is more relevant as proof of an uptrend.


Leave a Reply