Tag: crypto market

  • A chaotic December in equity markets

    A chaotic December in equity markets

    2 min read

    A chaotic December in equity markets 1Image from shutterstock.com

    What caused a chaotic December? A chaotic December in equity markets is closing. But, at the end of the year, these were not usual circumstances.

    It’s “completely bizarre,” says Stephen Innes, head of trading for the Asia Pacific at Oanda Corp. “It’s incredible just how harmful markets veer when sentiment slides.”

    Innes mostly is keeping his money on the sidelines. But he has been taking profit on some winning investments. And, also, from blue-chip stocks whose valuations have dropped in the December sell-off.

    Like many other traders in Asia, he’s been watching events play out in the U.S. from a distance, astonished at what he sees.
    So, what he did see?
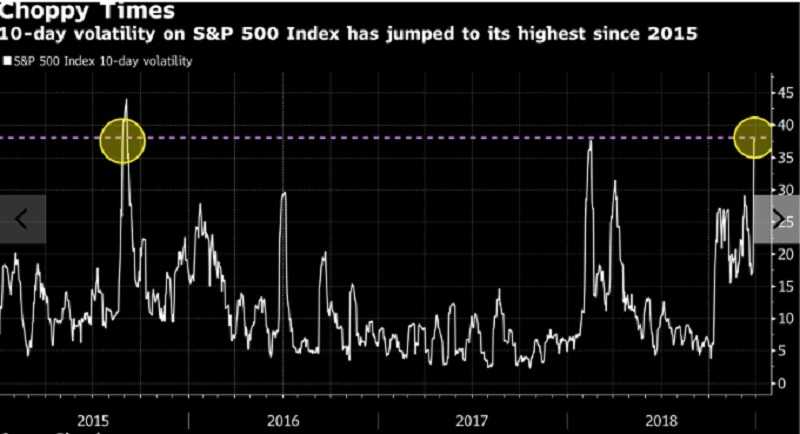
    A chaotic December in equity marketsSource: Bloomberg

    The S&P 500 Index posted its biggest upward reversal since 2010 on Thursday. Just a day after the largest advance since 2009. Despite this two-day gain, the measure is still down almost 10 percent in December alone.

    That’s the largest drop for each key market barometer since 1931, according to data from LPL Research. But those Depression-era losses were much bigger: the S&P 500 plunged 14.5% while the Dow plunged 17%.

    Two golden rules have been broken.

    First, since 1945, December has produced the highest average gains of any month. But December is the worst month of the year. Second, since the 1970s, the S&P 500 has never slumped when earnings growth was more than 10 percent.

    Mark Matthews, head of Asia research at Bank Julius Baer & Co. in Singapore, is planning to ride it out. “I remain invested through good times and bad,” he says. “Not being invested, over the long term, is like betting against the house in a casino.” He is a long-only investor.

    The December 2018 chaos is making investors nervous.

    This chaotic December in 2018 could have an impact in the future. The investors are worried that the economy could slow in 2019 because of continued trade tensions with China and rate hikes by the Federal Reserve.

    The Dow and S&P 500 are both in the red for the year, their worst annual loss since the 2008 Great Recession, and first annual loss since 2015. Last year, the S&P 500 returned 22%.

    For the past, eight to nine years never happened the U.S. market dropping at this magnitude and speed.

    Maybe the solution is to go overweight cash for the time being. The volatility will continue until year-end until investors get a clearer picture from the holiday earnings season, say experts.

    But longer-term, it is unknown if this will prove a “healthy correction”. The investors may find the S&P 500’s low valuations are attractive and earnings come in above expectations. Or it will mark the end of the bull run. Either way, one thing’s for certain, this movement is definitely unusual.

    This market turbulence isn’t normal.

    Maybe investors should keep away from new trades and tend to the existing investments. Anyway, investors opinion is very bad.

    Yes, most of them don’t think that this huge volatility will continue. But also, they are thinking that it is not a quite good idea to trade stock while the market is like this.

    The investors can’t hope that the markets will turn around in the year’s final days. They are here and it is obvious that nothing will change.

    In the past years, December was usually a very solid month for the market. Professional money managers used to buy top-performing stocks. That made their portfolios look good. This phenomenon is known as window dressing.

    There was also the somewhat mysterious Santa Claus rally effect. The market was very well in the final week of the years.
    There was some chalk up to light trading volume with so many people off for the Christmas holiday.

    But volatility remained this year. Stocks are down.

    It is, as we can see, unusual for this time of year. But the people take holidays. They have hope that the U.S. economy is robust and the sell-off will bottom out.

    For this time of year, some people are probably a little more focused on the market.

    But trying to explain short-term movements in the markets is an exercise in futility because generally, it is pretty random.

    Not only stocks, but Bitcoin has also had a brutal 2018.

    This chaotic December in 2018 had an impact on cryptos too.

    The world’s largest cryptocurrency by market cap is nearly 84% since its meteoric rise topped out at an all-time high of $19,870 in December 2017.

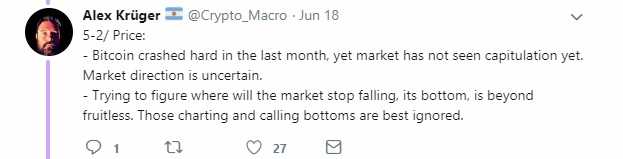
    But just after bitcoin (BTC-USD) peaked, technical trader Peter Brandt made a fantastically prescient call. This has recently resurfaced in crypto circles. In January, he called for an 80% retrace of bitcoin’s parabolic advance, predicting a $3,933 price target. Bitcoin is currently trading around $3,600. It was very close.

    But as ever, there were different opinions.
    A chaotic December in equity markets 3
    The dominant Bitcoin price prediction was that Bitcoin would reach the $14,000 mark by the end of 2018.

    However, that prediction is blown out.

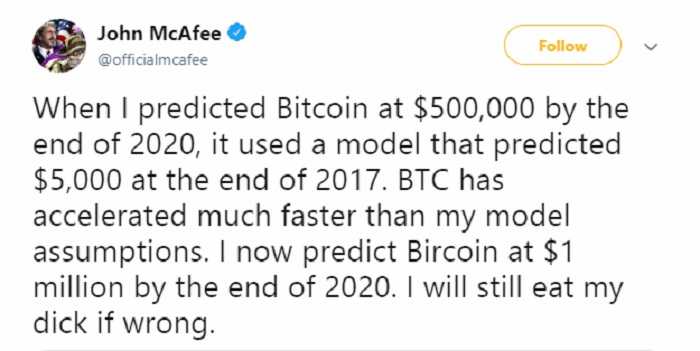
    Despite some optimists who were hoping that Bitcoin will break through the $100,000 barrier till the end of this year. In fact, Jim Cramer was predicting that Bitcoin will go as far as shattering the million dollar threshold one day.

    To do so, market capitalization should surpass 1 trillion USD just on BTC to reach $66,000 per coin, a 10x increase. Well, the entire market cap is at $212 billion. The BTC market cap was $170 billion almost a year ago. Now it is $115 billion and it was at $800 billion in January 2018.

    So, who knows what can happen.

    Today’s price of BTC you can see here

    One thing is certain. After this chaotic December in 2018, next year will be difficult and uncertain. Markets will be full of volatility. Permanent ups and downs.

    Anyway, it will be interesting.

    Risk Disclosure (read carefully!)

  • Capitulation of Bitcoin?

    Capitulation of Bitcoin?

    2 min read

    BITCOIN MINING EXPLAINED: HOW IT WORKS, HOW MUCH ENERGY IT USES AND WHAT NEEDS TO BE FIXED
    The bear market has seen the price of bitcoin decline more than 75% from all-time highs set in January. It is defined as a period of depressed activity and sentiment. A total of $60 billion has been erased from the value of all cryptocurrencies over the last week. That’s why many are wondering if the ongoing bear market for the asset class has finally come to an end.

    Bitcoin makes up more than 50% of the entire cryptocurrencies market, in terms of total capitalization. Our prediction is that the bear market may end when bitcoin bulls refuse to cede more ground.

    In the same period, traditional assets were down too. DOW had worst Thanksgiving week since 2011, oil is down 30% in 7 weeks, FAANGs (Facebook, Apple, Amazon, Netflix, and Google) is down almost 40%.

    But somehow, for many people, FAANGs get more attractive as they fall and Bitcoin gets less.

    Markets reverse

    Markets can be reversed in three ways: by the following capitulation, by following a strong trend-setting upwards break, by slowly rolling over reversal which is the hardest.

    Alex KrĂźger, economist and trader tweeted:

    ”Bitcoin crashed hard in the last month, yet the market has not seen capitulation yet. Market direction is uncertain.

    Trying to figure where will the market stops falling, its bottom, is beyond fruitless. Those charting and calling bottoms are best ignored.

    Capitulation of Bitcoin?
    BTC has extremely well-defined resistance areas.

    Books are so empty and volume so low that a whale can make a >5% pop/drop within a few hours.

    I’d expect more 2-way action now and still lower lows eventually.

    Wouldn’t be surprised to see 8200 within weeks.

    A $BTC ETF will launch, making crypto go viral again.

    Security tokens will go mainstream.”

    What is capitulation in the market?

    Capitulation is marked by extreme panic selling, consisting of extreme selling over a short time period. It is backed by high volume that builds momentum until an eventual “bottom” is found. The bottom is a price level where the asset looks too cheap or undervalued to investors for them to allow it to fall any further. In order for a true bottom to be found, many claim a capitulation needs to take the place because it is traditionally the last stage of a prolonged bear market. It’s difficult to consider something to have officially capitulated until after it has occurred. By looking at previous capitulation stages and market bottoms for bitcoin, there are a few similar signs traders and investors can watch out for. That may refer to an official market bottom. 

    Market conditions aren’t the same as they have been in past years. Bitcoin’s 2017 boom has brought new attention. Traders and investors who are left wondering if the asset can ever return to its former glory.

    Such an event can be measured and understood in real-time. But in order to predict bitcoin’s future, taking a look at its price history is perhaps the best place to start.

    It’s not an exact science, and there’s no guaranty history will ever repeat. That said, observing the bitcoin’s past price action yields three possibilities for potential market reversal worth of being discussed and considered.

    If there’s no bitcoin ETF approval, one could argue there’s no reason for bitcoin to resume its bullish uptrend until a market bottom occurs like it did in 2014-2015.

    Bitcoin falls under $4,000

    After days of stagnating at the $4,200 price level, on Saturday afternoon (EST), Bitcoin (BTC) suddenly fell under $4,000, a highly-touted level of support for the cryosphere’s foremost asset. It wasn’t clear why this bout of selling pressure occurred.  But within minutes, sell-side orders pushed BTC (on Coinbase) under $4,200, then $4,100, then $4,000, all the way to $3,800, where the digital asset is situated at the time of writing. Of course, this is worrying. It seems that a temporary floor has been found at $3,800. Crypto traders mentioned this key level before. It is unclear whether there was a catalyst that triggered this sudden loss of support, sending BTC plummeting into its third freefall in a week’s time.

    This rapid 10% loss can be caused by a number of supposed catalysts: the aftermath of the Bitcoin Cash’s November 15th fork, an influx of institutional selling orders, the Bakkt Bitcoin futures vehicle delay, regulatory measures from the SEC, and, arguably the most convincing, the final bout of capitulation from crypto’s “weak hands”.

    Many traders exclaimed that they didn’t expect to see BTC foray under $4,000 ever again.

    The fact of this most recent move downward is that many believe crypto’s bear market isn’t done yet. At least not until a bottom of $3,000 is reached, which is claimed by many traders, including Tone Vays, Anthony Pompliano, and other lesser-known yet knowledgeable industry analysts. That could mean that the $3,000 zone would be a good time to start accumulating.

    The bottom line

    If the current ascending trend line breaks, the price may not find its “bottom” until reaching the high of the prior “mega” bull run, which in this case lies in the $1,200 area. If prices fall to this level, the last hope will be to find new rising support for the entire “bull cycle” to repeat.

    Risk Disclosure (read carefully!)