Tag: trading patterns

  • Morning Star Pattern How To Trade It?

    Morning Star Pattern How To Trade It?

    Morning Star Pattern How To Trade It?
    How to identify the Morning Star pattern, how to trade it? Is it bullish or bearish? Is the Morning Star pattern good or bad when seen in the chart?

    To know how to trade this pattern we have to know what the Morning Star pattern is. First of all, you have to look at three candles and are near the support level. If yes, to have the Morning Star pattern, the first candle has to be bearish, the second has to be doji, and, finally, the third has to be a bullish candlestick. This third candlestick is important because it creates a bullish reversal pattern. So, logically, the Morning Star pattern is a bullish reversal pattern. At first glance, it may not look as bullish but we’ll explain to you how to recognize this pattern when it appears. Also, Traders-Paradise will introduce you to some trading techniques related to the Morning Star pattern. 

    This pattern will always tell you that something good is on its way. Bullish traders will always look for this pattern because a great reversal may occur. 

    The advantage of Japanese candlestick patterns is that even one candle has the whole story but when they are arranged together, you’ll have the novel. In terms of trading stocks, you’ll have the pattern that will tell you when your stock is going to breakout or breakdown. What is more important, when using the Morning Star pattern, you’ll know everything about the emotions of traders. For example, if you see long-legged candlestick, you’ll know that there was a hard battle among bulls and bears but without progress or change. At the end of the trading day, they are both pushed to the starting levels. 

    Therefore, understanding of candlesticks and their purposes is essential.

    What is a Morning Star pattern?

    We’ll need three trading days to be sure the Morning Star pattern appears. As we said earlier, this pattern is bullish but the first candlestick is large and bearish. That is due to the current trend and the first candle is in harmony with the trend. The second candle you’ll recognize when you see a small real body. It is a doji. This doji reveals hesitation and it’s followed by the third candlestick which is bullish. This third candle should be a large bullish one (the charts aren’t perfect, so how big is this third one, doesn’t really matter at this moment), so it tells us the bulls are coming back. They want to take over.

    So, the first day the bears have absolute control. The candlestick from the next day will tell us that there was a battle between bears and bulls and one of them is in control but yet it isn’t known which one. That’s something that doji tells. Still, we don’t know who is the winner so we have to look on the second day as on the day of indecision. We’ll understand who has a control on the third day when the bulls actually are knocking down the bears and winning the battle. So, the new direction on the stock price is starting. The price reversal is here.

    How strong is the reversal? 

    Well, we have to consider several signs to be able to conclude that.

    The longer the candles, the higher reversal. Further, the reversal will be higher if there is any gap on both sides of the middle candlestick of the Morning Star pattern. 

    To make this clearer, the second candle is the star. It has a short real body, separated from the real body of the first candlestick. The gap between the real bodies of the two candles separates a star from a doji or a spinning top. The star may appear in the shadow of the first candle, it isn’t necessary to form below the low of the first candle.

    The appearance of the start is the first sign of bears’ weakness. They are not strong enough to push the price lower than the closing price on the prior day. The third candle will confirm their weakness. This third candle has to be lighter in color. Actually, the middle candle can be red or green or black or white because the bulls and bears are going to balance out across the session.) in the charts and pierces into the body of the candle from the first day. 

    Also, if there is a gap between the first and second days. Here we came to the size of the third candle. If this candle is higher than the candle from the first day, that means the greater the bullish takeover. 

    How to trade Morning Star Pattern?

    We already said the Morning star pattern is a sign for the start of a trend reversal. From bearish to bullish. Well, you have technical indicators on disposal that may help you to unveil the Morning Star is going to form. For example, when the price is nearing a support zone. The other indicator could be when RSI confirms that the stock is oversold.

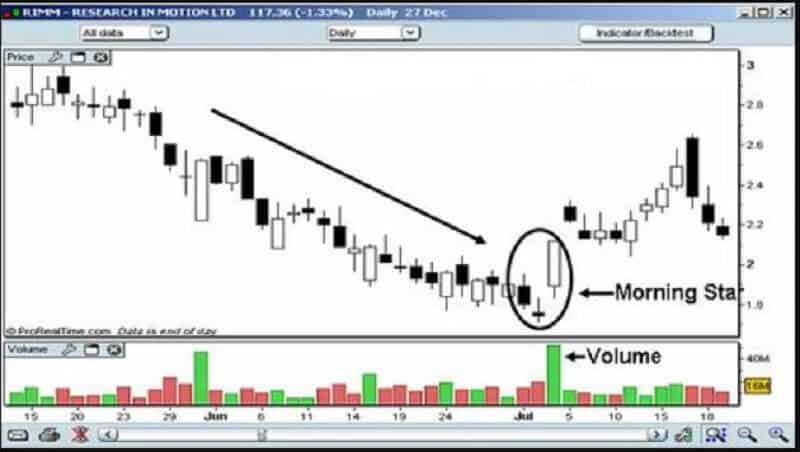
    Also, pay attention to the volume. It can be a great contributor to the forming of this pattern. When the volume increases during the three trading days and on the third day it’s the highest that’s the confirmation of the Morning Star pattern followed by the reversal.

    You should take up a bullish position in the stock when the Morning Star forms. Then, ride the uptrend until there is an indication of an added reversal. So, it’s important to notice when the first falling bearish candlestick is going to form. Further, monitor for the second smaller candlestick which is spinning top or doji, as we explained above. Plan your stop now. When the third candlestick is formed it is a bullish one, wait until it breaks above the third and take a long position. If you go long, set your stop below the bottom of the last candlestick. Some traders would wait until the price drops below the third candlestick and then enter a short position and set a stop above that candle. 

    Bottom line

    This pattern is a bullish reversal pattern. That means that buyers (bulls) take control of the sellers (bears) and push the price in the opposite direction.
    Trading completely on visual patterns can be a risky plan. The Morning Star pattern is best when it is supported by volume and a support level, as the back indicators. It isn’t hard to notice this pattern. It will appear whenever a small candle occurs in a downtrend.
    Whatever the candlestick pattern you use, you have to understand that there are many variations of it and on it. But one thing is sure, the Morning Star is a bullish reversal pattern that tells us that some good things are going to come.

  • Inverted Hammer Candlestick Pattern

    Inverted Hammer Candlestick Pattern

    (Updated October 2021)

    Inverted Hammer Candlestick Pattern
    Inverted Hammer candlestick pattern occurs essentially at the bottom of the downtrend and can warn of a possible reversal upward

    Inverted Hammer candlestick pattern is visible on a chart during the higher pressure from buyers to push a stock price up. It is a bullish reversal pattern. This pattern is identified by a long upper shadow and a small real body. They usually appear following the real longer black body. It’s pretty similar to the Shooting star candlestick pattern. Inverted Hammer occurs in a downtrend. In trading charts, you’ll notice a long black candle visible on the first day of appearance. On the next day, you can see how a small real body develops. It will occur at the lower end of the range. The candle for the second day will have an upper shadow, two times longer than the real body, and will not have a lower shadow. Don’t pay attention to the color of the real body. It isn’t important at this moment.

    What does the Inverted Hammer candlestick pattern tell us? 

    The long upper shadow indicates the buying pressure after the opening price. It is followed by significant selling pressure but insufficient to bring the price down, below the open. However, we’ll need bullish confirmation that may come as a long empty candlestick or a gap up, but followed by a heavy trading volume. 

    Inverted Hammer candlestick pattern tells us that bullish traders raise their confidence. The top of the candle is made when bulls push the price up the farthest they can. The bottom of the candle shows the bears attempting to resist that higher price. Bears are short-sellers. Still, the bullish trend is extremely strong, and the market is settled at a higher price. 

    Also, an inverted hammer candlestick pattern tells us that there could be a price reversal as a result of a bearish trend. Keep in mind, never observe the inverted hammer candlestick pattern solely. You’ll need confirmation of other technical indicators. Ultimately, check your trading plan before trading the inverted hammer. 

    What is the Hammer candlestick pattern?

    A hammer pattern in candlestick charting is a price pattern. It happens when an asset trades lower than its opening price, but the rally is formed inside the given period, for example, one trading day, to close near the opening price. The pattern looks like a hammer. The lower shadow is a minimum twice the size of the real body. The body of the candlestick signifies the difference in the opening and closing prices and the shadow tells about the high and low prices for that period.

    A hammer occurs after the price of security declines. That is the sign the market is trying to define a bottom. Hammer will appear when the sellers miss forming the bottom and push the price to rise and reverse. In short, the price drops after the open but later, closes near the bottom after regrouping. 

    A hammer candlestick doesn’t show a price reversal to the upside,  it has to be confirmed. Confirmation means the next candle that follows the hammer, closes higher up to the closing price. On such occasions, traders usually enter the long position or exit their short positions. Traders that are taking long positions it is recommended to set a stop-loss below the low of the shadow.

    The meaning of Inverted hammer pattern

    It is important to understand that all inverted patterns imply that the price will change soon. It will not reveal a particular trend but it will warn you that the market will change its momentum.

    Speaking about an inverted hammer pattern, its appearance shows the market is going up with buyers that are taking control. So, the price will go higher. Also, momentum changes, so the sellers are taking the price back to the level of the opening price. The pattern can send out many buys and sells signals in various cases. 

    Inverted Hammer is a trend reversal pattern, and it’s opposite to the hammer pattern. As a signal of bearish reversal, it comes after the stock price falls and symbolizes the strength. What does it look like? Let’s say the stock price tries to move up but the current downtrend blocks it. The bears push it down and form the top tail of the inverted hammer. At first glance, it may look like the trend is continuing since it arrives near a support zone and indicates the bullishness of the stock.  And the war can start. The bulls against the bears, where the bulls are trying to launch the stock up to new higher levels.

    How much the color is important?

    It’s time to explain the color of the body of the inverted candlestick. It could be dark or light. The light body reveals that a stock closes higher and is more powerful than its peers.

    When the uptrend is out of the scene the pattern is ready for the trend reversal. The stock price will go back to the opening price and probably stay around that price until the end of the trading day. You should wait for the next day and the new opening price.  You’ll know if the stock goes down further or the buyers will give it another chance and take the stock to a better position.

    The Inverted Hammer candlestick pattern is maybe one of the main reversal signals in stock trading. You must consider confirmation criteria before trading with this signal. The upper side has to be twice longer than the length of the body, while the lower shadow is very small or there is no, it’s invisible. You must be sure you have the right picture. Let’s say this way, the length of the upper shadow is directly proportional to the possibility of a reversal.

    Also, if there is a gap down in comparison to the close of the prior day, it could be the base for strong reversal. Start trade the Inverted Hammer candlestick pattern the day after the appearance of the signal because in that period the stock will open higher. Consider one aspect more, it’s the level of the trading volume on the day when the inverted hammer signal appears. High volume will increase the odds of blow-off.

    The logic behind this pattern

    First of all, the market condition is bearish as a reply to a downtrend. The stock could start to trade higher, so the bulls will not have the necessary strength. Hence, we have sellers on the scene that are pushing the price down to the lower trading range. Generally speaking, the bears will dominate the market all trading day in such a case.

    The bulls will attempt to recover power the next day causing the price jumps because the bears aren’t able to exercise the needed resistance. If the price sustains its strength even on the next day, you can be sure that you have the confirmation for the inverted hammer pattern.

    If you want to trade an uptrend, you can “go long” which means you can buy. But if the signal isn’t strong enough and the downtrend will continue, so you can “go short” which means you can sell the stock or any other asset you hold.

    Bottom line

    Inverted Hammer candlestick pattern indicates a bullish reversal and it’s recognized in downtrends. Traders need this to decide on the next move. Keep in mind, this pattern isn’t the same as the shooting star pattern. There is a difference. Inverted Hammer candlestick patterns will never occur at the high of the trend line as the shooting star. Inverted hammer will always occur at the low of the trend but not as often as regular hammers. Sometimes, the signals that an inverted hammer may produce can be confusing. That’s the reason to double examine the length of the shadow. It is the most important. 

    Some experts will not recommend using this signal as a trigger for entry. Still, if you want to use it you’ll have an advantage if you wait for a bullish confirmation candlestick. This signal performs the best in time frames of four hours or one trading day. In longer time frames, use it as an entry signal to sell, but not to buy. Remember, the inverted hammer pattern must appear after a downtrend. The flat or sideways markets are something you will not like in trading this pattern.