Category:  Personal Finance


Personal finance covers managing your money. That can be saving and investing. Personal finance includes budgeting, investments, insurance, mortgages, retirement planning, banking, etc. In other words, it is an entire industry that provides financial services to people and advises them about financial and investment possibilities.

Traders-Paradise gives you comprehensive articles on all these matters. We’re covering all mentioned above but our team stepped forward. Here you can find very useful articles about loans, personal loans, pay-day loans, and why some are better than others.

Traders-Paradise provides you, our reader, full and detailed guides on how to apply for loans, how to improve your bad credit score, how to get out a loan even with a bad credit score.

Here you’ll find all about the process of applying, what documents are required, both for online lenders and traditional banks. So, you can be prepared in advance.

Tredares-Paradise team that has experts in different fields, will guide you, with their articles, trough the personal finance issues and help you to solve them.

We are giving you a key to keep your personal finances on the right track. You’ll learn how to obtain skills that can help you in your personal success or your business success. These articles are all about that but with a concrete explanation of personal money management. How to do that, why to do that, how beneficial it is.

  • When a company does a buyback, how long does it take for that to happen?

    The length of time it takes for a company to complete a buyback can vary depending on a few factors, such as the size of the buyback, the number of shares being repurchased, and the market conditions at the time.

    Typically, a company will announce a buyback program and indicate how long it expects the program to run. This can be a specific period of time or an open-ended program with no set end date. Once the company has announced the buyback, it may begin purchasing shares immediately or over the course of the program.

    The actual time it takes for the company to complete the buyback will depend on a few factors, such as how quickly the company can find willing sellers, the volume of shares being traded, and any market conditions that may affect the price of the shares.

    In general, it is difficult to predict exactly how long a buyback will take to complete. However, companies are required to disclose their progress on the buyback program in their quarterly and annual financial statements, so investors can monitor the company’s progress towards completing the buyback.


  • New trading ideas – 21, April 23

    New trading ideas – 21, April 23

    How to read this report

    Every report will start with a short “Market News” section. In this section, we scraped the latest financial news regarding the financial markets. This is a more macro vision of the market. Interest rates, unemployment reports, inflation, oil and energy, earning season, etc.

    After the news report section we head to the trading idea section. Every idea is divided into 4 important parts:

          1. The company and its sector and description
          2. Recent news about the company
          3. Chart and its boundary lines
          4. A table with the company peers and competitors, including their financial and fundamentals.

    A new report will be generated on a daily basis.

    Does it work?

    In short, yes.

    you can read here how we use these methods for our real life trades.

    Short declaimer

    This report, including all content, is made for educational purposes only. Use on your own risk!

    Market news today

    Most recent news about the financial markets

    • De-dolarization talks are rife amid increasing geopolitical tensions. 5 ETF strategies to play de-dolarization
      Talks of de-dolarization are rife amid increasing geopolitical tensions, the chances of slower Fed rate hikes this year and the rise of cryptocurrencies. Play Talks of De-Dollarization With 5 ETF Strategies. For more information, visit 5ETFstrategies.com.
    • This fund has an allocation strategy that can work to its advantage.
      Using a real-assets strategy for some of your money can provide all-weather protection through inflation cycles and protect your spending power. This fund has an allocation strategy that can work to your advantage. It has an all-time allocation strategy for real assets.
    • S&P 500 has been trading in a narrow range for most of the year.
      4200. Decline below 3950 would be negative and probably bring in some serious selling, writes Lawrence McMillan on S&P 500 at 4200 at 4,200. 4,000 at 4.200 at 3950 at 4100. 4200, 4200 and below 4200 soon.
    • S&P 500 ETF has seen its worst week since March. QQQ has seen its worst week since March outflows
      Investors withdrew over $2 billion from the main U.S. equities ETFs SPY, QQQ and Nasdaq 100 this week. This is the worst week in terms of flows since the Silicon Valley Bank’s collapse in March. Year to date, SPY has seen cumulative outflows of $7.8 billion.
    • All images are copyrighted.
      The Bulls are in trouble and have nowhere left to run. The Bulls are trapped and have no more options but to keep running. The Bulls have no other choice but to continue to play catch-up. They are trapped in a quagmire.
    • Initial jobless claims rise for second week in a row. Four-week moving average declines slightly
      The number of Americans applying for unemployment benefits rose by 5,000 to 245,000 in the week ending April 15. The figure came in higher than the projected 240,000. Seasonally unadjusted claims fell by 7,021 or 3% from the previous week to 228,216. The four-week moving average declined marginally to 239,750.
    • How we’ll protect and grow our 8% dividends for the rest of 2023.
      The company plans to protect and grow its 8% dividend for the rest of 2023. It will pay a minimum of 8% for the next 20 years. The company will not pay more than 8% per year from 2018 to 2023, if necessary.
    • Regional banks have seen their share of troubles in recent years.
      Regional Banks Make a Comeback: Is There More Room to Run? is published by Simon Tisdall at $1.99 per share. It’s also published by Piatkus at $2.50 per share, and it’s published by KPMG at $3.50.

    Trading ideas for today


    #1 Trading idea on ECL


    Company Name: Ecolab Inc.
    Symbol: ECL
    Sector: Consumer Goods

    Company Description: Ecolab is an American corporation that develops and offers services, technology and systems that specialize in water treatment, purification, cleaning and hygiene in a wide variety of applications. It helps organizations both private market and public treat their water, not only for drinking directly, but also for use in food, healthcare, hospitality related safety and industry.

    NEWS THAT MIGHT INLUENCE STOCK PRICE:

    • News story for ECL — 7 analysts have a positive view on the stock.
      7 analysts have an average price target of $169.86 for Ecolab (NYSE:ECL). The current share price is $163.27. The greater the number of bullish ratings, the more positive analysts are on the stock and the greater the upside potential.
    • News story for ECL — Investors continue to be optimistic about Ecolab
      Investors are optimistic about Ecolab (ECLc) owing to its strong business. ECL has 3 reasons to keep the stock in your portfolio. ELCL has a good chance to grow due to its good business prospects.

    TECHNICAL ANALYSIS

    ECL stock trading idea

    PEERS AND FUNDAMENTALS

    ECL stock peers and fundamentals


    #2 Trading idea on GPN


    Company Name: Global Payments Inc.
    Symbol: GPN
    Sector: Services

    Company Description: Global Payments Inc. is an American company providing financial technology services globally headquartered in Atlanta, Georgia. Global Payments is a provider of payment technology services. . for more information, visit globalpaymentsinc.com or call 1-800-273-8255.

    NEWS THAT MIGHT INLUENCE STOCK PRICE:

    TECHNICAL ANALYSIS

    GPN stock trading idea

    PEERS AND FUNDAMENTALS

    GPN stock peers and fundamentals


    #3 Trading idea on KO


    Company Name: Coca-Cola Co
    Symbol: KO
    Sector: Industrial Goods

    Company Description: The Coca-Cola Company is an American multinational beverage corporation incorporated under Delaware’s General Corporation Law and headquartered in Atlanta, Georgia. It has interests in the manufacturing, retailing, and marketing of nonalcoholic beverage concentrates and syrups, and in the production of sodas.

    NEWS THAT MIGHT INLUENCE STOCK PRICE:

    • News story for KO — Issuance of dividends has been on the rise in recent years.
      Both companies enjoy the status that goes along with being a Dividend King and can help you make money. Â i.e. to earn a higher income. i.a.g. Passive Income Stocks that Can Help Make You Richer.
    • News story for KO — 76% of Warren Buffett’s $344 billion portfolio is invested in 5 stocks.
      76% of Warren Buffett’s $344 billion portfolio is invested in these 5 stocks. The portfolio concentration is a big reason for Berkshire Hathaway’s long-term success, as it’s a big part of the company’s success and success.
    • News story for KO — Portfolio Monthly Income allows investors to get paid monthly.
      Most stocks pay quarterly dividends, but investors can still construct a portfolio that allows them to get paid monthly. This Portfolio Provides Monthly Income is one of the best options for investors who like to receive monthly income. Â i

    TECHNICAL ANALYSIS

    KO stock trading idea

    PEERS AND FUNDAMENTALS

    Sorry, no table at the moment.


    #4 Trading idea on PEG


    Company Name: Public Service Enterprise Group Inc.
    Symbol: PEG
    Sector: Utilities

    Company Description: The Public Service Enterprise Group (PSEG) is a publicly traded diversified energy company headquartered in Newark, New Jersey. PSEG has a diversified portfolio of assets, including renewable energy resources, natural gas, electricity, and water. Â

    NEWS THAT MIGHT INLUENCE STOCK PRICE:

    • News story for PEG — Public Service Enterprise (PEG) has a consensus outperform rating.
      In the last 3 months, 8 analysts have offered 12-month price targets for Public Service Enterprise. The company has an average price target of $64.31 with a high of $70.00 and a low of $60.00. The greater the rating from the analysts, the higher the price target.
    • News story for PEG — Public Public Service Enterprise Group (PEG) is down 6% since last earnings report.
      SEPG (PEG) reported earnings 30 days ago. The stock is down 6% since then. PSEG’s earnings are expected to be down 6%. PEG’s stock is expected to rise 6% after the next earnings report. PEG is down 7% since the last report.

    TECHNICAL ANALYSIS

    PEG stock trading idea

    PEERS AND FUNDAMENTALS

    PEG stock peers and fundamentals


    #5 Trading idea on CME


    Company Name: CME Group Inc.
    Symbol: CME
    Sector: Financial

    Company Description: CME Group Inc. is an American global markets company. It is the world’s largest financial derivatives exchange. It trades in asset classes that include agricultural products, currencies, energy, interest rates, metals, stock indexes and cryptocurrencies futures. It also operates Chicago Mercantile Exchange, Chicago Board of Trade, New York Mercantil Exchange and The Commodity Exchange.

    NEWS THAT MIGHT INLUENCE STOCK PRICE:

    • News story for CME — Shares of CME Group have more than doubled in 10 years.
      A $1000 investment in CME Group 10 years ago would be worth $1000 today. Investing in certain stocks can pay off in the long run if you hold on for a decade or more. CME is one of the most valuable stocks in the world today.
    • News story for CME — Revenues increase Y/Y on organic growth, solid segment performance.
      Nasdaq’s (NDAQ) first-quarter 2023 results reflect organic growth and solid segmental performance. Nasdaq’s Q1 Earnings Top Estimates, Revenues Increase Y/Y. nDAQ.com/q1.
    • News story for CME — Earnings are expected to grow, revenue to grow.
      CME’s earnings are expected to grow next week. CME possesses the right combination of the two key ingredients for a likely earnings beat in its upcoming report. Get prepared with the key expectations ahead of CME’s next week’s release and follow the links below to learn more.

    TECHNICAL ANALYSIS

    CME stock trading idea

    PEERS AND FUNDAMENTALS

    CME stock peers and fundamentals


    #6 Trading idea on PEP


    Company Name: Pepsico, Inc.
    Symbol: PEP
    Sector: Consumer Goods

    Company Description: PepsiCo, Inc. is an American based multinational food, snack, and beverage corporation headquartered in Harrison, New York, in the hamlet of Purchase. It oversees the manufacturing, distribution, and marketing of its products. Its business encompasses all aspects of the food and beverage market.

    NEWS THAT MIGHT INLUENCE STOCK PRICE:

    • News story for PEP — Only 20% of people eligible to collect in class-action suits join.
      Less than 20% of people eligible to collect in class-action suits join in, which means a lot of people leave money on the table. Here’s how to find other settlement opportunities that could put cash in your pocket. iReport.com:
    • News story for PEP — Keurig Dr Pepper, Inc reports next week.
      Keurig Dr Pepper, Inc (KDP) reports next week. The company doesn’t possess the right combination of the two key ingredients for a likely earnings beat in its upcoming report. Get prepared with the key expectations ahead of the report’s release.
    • News story for PEP — Coca-Cola FEMSA is at a 52-week high, but is there still room to run?
      Coca-Cola FEMSA (KOF) is at a 52-week high. Can investors hope for more gains in the future? We take a look at the company’s fundamentals to see if there is still room to run.

    TECHNICAL ANALYSIS

    PEP stock trading idea

    PEERS AND FUNDAMENTALS

    Sorry, no table at the moment.


    #7 Trading idea on ABT


    Company Name: Abbott Laboratories
    Symbol: ABT
    Sector: Healthcare

    Company Description: Abbott Laboratories was founded by Chicago physician Wallace Calvin Abbott in 1888. It sells medical devices, diagnostics, branded generic medicines and nutritional products. It split off its research-based pharmaceuticals business into AbbVie in 2013. It has its headquarters in Abbott Park, Illinois.

    NEWS THAT MIGHT INLUENCE STOCK PRICE:

    • News story for ABT — Morgan Stanley cuts Charter Communications price target, BMO Capital cuts Morgan Stanley.
      Charter Communications shares fell 1.6% to $338.33 on Thursday. Truist Securities raised the price target for Airbnb from $120 to $130. Argus Research cut U.S. Bancorp’s price target from $63 to $63.
    • News story for ABT — Abbott Laboratories, Netflix report better-than-expected results.
      The S&P 500 closed almost flat on Wednesday following the release of corporate earnings. Abbott Laboratories (NYSE: ABT) shares gained 7.8% on Wednesday after the company reported better-than-expected Q1 results and issued guidance. Netflix (NASDAQ: NFLX) shares dropped after they reported mixed Q1 financial results. Western Alliance Bancorporation shares jumped over 24%.
    • News story for ABT — Shares of the company rose more than 4% on Tuesday.
      Medtronic stock is up more than 4%. It did well on a good day for stocks in the device maker’s industry. Medtronic is a medical device maker. Its stock rose on a very good day in the industry. It’s up 4% today.

    TECHNICAL ANALYSIS

    ABT stock trading idea

    PEERS AND FUNDAMENTALS

    ABT stock peers and fundamentals


    #8 Trading idea on LUV


    Company Name: Southwest Airlines Co.
    Symbol: LUV
    Sector: Services

    Company Description: Southwest Airlines is one of the major airlines of the United States and the world’s largest low-cost carrier airline. It is headquartered in Dallas, Texas. It’s also known as Southwest Airlines Co., typically referred to as Southwest Airline Co., or simply Southwest.

    NEWS THAT MIGHT INLUENCE STOCK PRICE:

    • News story for LUV — Analysts are expecting lower-than-expected earnings.
      Southwest Airlines (LUV) is expected to report negative earnings next week. Get prepared with the key expectations for the upcoming report. For confidential support call the National Suicide Prevention Lifeline at 1-800-273-8255 or visit http://www.suicidepreventionlifeline.org/.
    • News story for LUV — Shares of Southwest Airlines closed at $32.45 in recent trading session
      . Southwest Airlines (LUV) closed the most recent trading day at $32.45, moving +1.22% from the previous trading session. LUV shares are up 1.22%. LUV is down 1.3%. LVI shares are down 2.5%.
    • News story for LUV — Earnings and revenue missed estimates by a whisker.
      United Airlines (UAL) delivered earnings and revenue surprises of 13.70% and 0.07% for the quarter ended March 2023. United Airlines reports Q1 Loss, Tops Revenue Estimates. UAL shares are up 1.7%.

    TECHNICAL ANALYSIS

    LUV stock trading idea

    PEERS AND FUNDAMENTALS

    LUV stock peers and fundamentals


    #9 Trading idea on D


    Company Name: Dominion Resources, Inc.
    Symbol: D
    Sector: Utilities

    Company Description: Dominion Energy supplies electricity in Virginia, North Carolina, and South Carolina and natural gas to parts of Utah, West Virginia, Ohio, Pennsylvania and North Carolina. Dominion also has generation facilities in Indiana, Illinois, Connecticut and Rhode Island. Dominion Energy is headquartered in Richmond, Virginia.

    NEWS THAT MIGHT INLUENCE STOCK PRICE:

    • News story for D — Shares of Dominion Energy closed at $57.43 in recent trading session
      the previous day. Dominion Energy (D) closed at $57.43, marking a +0.12% move from the previous trading session, and +1.3% gain from previous day, and -1.5% gain on previous trading day.
    • News story for D — Wall Street’s most accurate analysts rate these stocks.
      Dominion Energy, Dominion Energy and Dominion Resources are high-yielding utilities stocks with over 4% dividend yields. The most accurate Wall Street analysts recommend them to investors. Benzinga readers can review the latest analyst takes on their favorite stocks by visiting the Analyst Stock Ratings page.
    • News story for D — 14 analysts have a positive view on the stock.
      14 analysts have an average price target of $63.07 for Dominion Energy. The current price of Dominion Energy is $57.905. The greater the number of bullish ratings, the more positive analysts are on the stock and the greater the upside potential of the stock.

    TECHNICAL ANALYSIS

    D stock trading idea

    PEERS AND FUNDAMENTALS

    D stock peers and fundamentals


    #10 Trading idea on AEE


    Company Name: Ameren Corporation
    Symbol: AEE
    Sector: Utilities

    Company Description: Ameren Corporation was created December 31, 1997 by the merger of Union Electric Company and Central Illinois Public Service Company. Ameren is now a holding company for several power companies and energy companies in the U.S. and is based in St. Louis, Missouri.

    NEWS THAT MIGHT INLUENCE STOCK PRICE:

    • News story for AEE — PG&E has achieved a 24% reduction in gas emissions from its pipeline system.
      PG&E Corp. secures a 24% reduction in emissions from its natural gas pipeline system, thanks to the attainment of a reduction of 24% from its previous estimate. – PCG is a subsidiary of PG&E Inc. (PCG).
    • News story for AEE — Memorandum of Understanding signed to develop green energy projects.
      AVANGRID and NTUA sign a Memorandum of understanding to develop green energy projects in the Navajo Tribal Utility Authority (NTUA) territory. NTUA is a government agency of the Navajo tribe. AVANGRid (AGR) is a subsidiary of the AGR.
    • News story for AEE — Approval for two dozen new solar and energy storage projects.
      Dominion Energy (D) gets approval for two dozen new solar and energy storage projects in Virginia. Dominion Energy gets approval to produce 800 MW of clean energy from solar and storage projects. for the Virginia State Corporation Commission for the projects. For more information, visit Dominion Energy’s website.

    TECHNICAL ANALYSIS

    AEE stock trading idea

    PEERS AND FUNDAMENTALS

    AEE stock peers and fundamentals


    #11 Trading idea on MDT


    Company Name: Medtronic, Inc.
    Symbol: MDT
    Sector: Healthcare

    Company Description: Medtronic plc is an American-Irish registered medical device company that operates in the United States. Medtronic has an operational and executive headquarters in Fridley, Minnesota in the US and is headquartered in Dublin, Ireland. It has an annual revenue of $20 billion.

    NEWS THAT MIGHT INLUENCE STOCK PRICE:

    • News story for MDT — Two stocks to buy and hold for the long term.
      These companies could deliver solid results for as long as people need healthcare services. If you have $5,000, these are the two stocks to buy and hold forever. For confidential support call the Samaritans on 08457 90 90 90 or visit a local Samaritans branch or click here.
    • News story for MDT — Shares of the company rose more than 4% on Tuesday.
      Medtronic stock is up more than 4%. It did well on a good day for stocks in the device maker’s industry. Medtronic is a medical device maker. Its stock rose on a very good day in the industry. It’s up 4% today.
    • News story for MDT — Shares of Medtronic closed at $81.65 in recent trading session
      (MDT) closed at $81.65, marking a -0.57% move from the previous day. Medtronic stock is down 0.57%. The market is up 0.5%. . , by the way.

    TECHNICAL ANALYSIS

    MDT stock trading idea

    PEERS AND FUNDAMENTALS

    MDT stock peers and fundamentals


    #12 Trading idea on PARA


    Company Name: Paramount Global
    Symbol: PARA
    Sector: Technology

    Company Description: Paramount Global is a global media and entertainment company. It is headquartered in New York, New York and has a global network of offices. It has more than 100,000 employees. It’s one of the world’s biggest media companies, with a turnover of over $20 billion.

    NEWS THAT MIGHT INLUENCE STOCK PRICE:

    • News story for PARA — Paramount Global-B (PARA) closed with move of -1.82%InterContinental Hotels Group
      Paramount Global-B (PARA) closed at $22.15 in the latest trading session, marking a -1.82% move from the previous day. Broader Markets (BME) closed the day at $23.15. BME is up 1.2% this week.
    • News story for PARA — Most accurate Wall Street analysts have a buy rating on Paramount Global.
      Wall Street’s most accurate analysts say buy these 3 Tech and Telecom Stocks delivering high-Dividend Yields. Benzinga readers can review the latest analyst takes on their favorite stocks by visiting our Analyst Stock Ratings page. The most recent high-yield dividend stock ratings come from the most accurate Wall Street analysts.
    • News story for PARA — Shares of the streaming video giant are up over 20% this year.
      Netflix’s growth is finally stabilizing. Netflix stock is expected to rise in the next one year. Netflix is a streaming video giant that provides content for a number of different platforms. Netflix’s stock is valued at about $50 billion. Netflix shares rose 1% today.

    TECHNICAL ANALYSIS

    PARA stock trading idea

    PEERS AND FUNDAMENTALS

    PARA stock peers and fundamentals


    #13 Trading idea on STX


    Company Name: Seagate Technology Public Limited Company
    Symbol: STX
    Sector: Technology

    Company Description: Seagate Technology Holdings plc is an Irish public limited company. Seagate is an American data storage company. It is based in the U.S. and is owned by American companies. Seagate is a data storage firm based in Silicon Valley.

    NEWS THAT MIGHT INLUENCE STOCK PRICE:

    • News story for STX — Tesla, Seagate reported mixed earnings results.
      U.S stocks closed lower on Thursday following mixed bag of earnings results. Tesla shares dropped around 9.8% on Thursday after the company reported a decrease in operating margins. Seagate Technology Holdings plc shares dipped more than 9%. The Dow Jones closed lower.
    • News story for STX — Third-quarter revenues decline Y/Y on elongated customer inventory correction.
      Seagate’s third-quarter fiscal 2023 performance hit by elongated customer inventory correction. Revenues declined Y/Y in the third quarter due to this correction. Seagate lost a loss in Q3. Â

    TECHNICAL ANALYSIS

    STX stock trading idea

    PEERS AND FUNDAMENTALS

    STX stock peers and fundamentals


    #14 Trading idea on TDOC


    Company Name: Teladoc Health Inc
    Symbol: TDOC
    Sector: Healthcare

    Company Description: Teladoc Health provides business-to-business virtual health care services in the United States and internationally. The company is headquartered in Purchase, New York and provides services in both the U.S. and abroad. Teladoc is a privately-owned company.

    NEWS THAT MIGHT INLUENCE STOCK PRICE:

    • News story for TDOC — Analysts are expecting lower earnings than last year.
      Pediatrix Medical Group (MD) is expected to report a decline in earnings. The company doesn’t possess the right combination of the two key ingredients for a likely earnings beat in its upcoming report. Get prepared with the key expectations and stay tuned for the company’s earnings report.
    • News story for TDOC — Analysts are still uncertain about the near-term prospects for the company.
      Teladoc (TDOC) saw a 5.7% jump in share price last session on above-average trading volume. The latest trend in earnings estimate revisions for the stock doesn’t suggest further strength down the road, however, as it doesn’t support further growth.
    • News story for TDOC — Analysts expect Teladoc to report a decline in earnings.
      Teladoc (TDOC) is expected to report a decline in earnings. The company doesn’t possess the right combination of the two key ingredients for a likely earnings beat in its upcoming report. Get prepared with the key expectations for Teladoc’s upcoming earnings report.

    TECHNICAL ANALYSIS

    TDOC stock trading idea

    PEERS AND FUNDAMENTALS

    TDOC stock peers and fundamentals


    #15 Trading idea on RNG


    Company Name: RingCentral Inc
    Symbol: RNG
    Sector: Technology

    Company Description: RingCentral, Inc. offers software-as-a-service solutions that enable businesses to communicate, collaborate and connect in North America. The company is headquartered in Belmont, California and offers its services in English and in Spanish. for more information, visit ringcentral.com.

    NEWS THAT MIGHT INLUENCE STOCK PRICE:

    • News story for RNG — Bullish Somewhat Bullish Indifferent Somewhat Bearish Total Ratings 5 2 3 0 0 Last 30D 1 0 0 0 1M Ago 1 0 0
      In the last 3 months, 10 analysts have offered 12-month price targets for RingCentral. The company has an average price target of $46.9 with a high of $62.00 and a low of $35.00. The greater the number of bullish ratings, the more positive analysts are on the stock.
    • News story for RNG — RNG has posted better-than-expected results in three of the last four quarters.
      RingCentral (RNGR) has an impressive earnings surprise history. RingCentral’s next quarterly report is expected to beat estimates again. RNGR currently possesses the right combination of the two key ingredients for a likely beat in its next quarterly earnings report.
    • News story for RNG — Surge in AI hiring is a ‘beacon of light’ for tech world.
      AI has been a ‘beacon of light for the tech world’ after months of layoffs, high interest rates and the collapse of Silicon Valley Bank, says one tech exec. Startups are hiring for the next big thing and AI is a good fit.

    TECHNICAL ANALYSIS

    RNG stock trading idea

    PEERS AND FUNDAMENTALS

    RNG stock peers and fundamentals


    #16 Trading idea on UI, might be reaching some kind of top


    Company Name: Ubiquiti Inc
    Symbol: UI
    Sector: Industrial Goods

    Company Description: Ubiquiti develops network technology for service providers, businesses and consumers. The company is headquartered in New York, New York and develops technology for the service providers and the consumer market. . for more information, visit: www.ubiquiti.com.

    NEWS THAT MIGHT INLUENCE STOCK PRICE:

    • News story for UI — Urbanimmersive announces workforce reduction and review of strategic alternatives.
      Urbanimmersive Inc. announces a workforce reduction and a review of its strategic alternatives available. The company is listed on the TSX Venture Exchange and on the OTCQB Exchange. For more information, visit the company’s website at: http://www.urbanimmersive.com/.
    • News story for UI — U.S.-based Urbanimmersive to hold annual meeting of shareholders in June.
      Urbanimmersive Inc. annonce une réduction de ses effectifs and un examen des alternatives stratégiques disponibles for the Compagnie. The company is a member of the Toronto Venture Exchange (TSX: UI) and the UBMRF.
    • News story for UI — .
      The 10-Year 10-Baggers are looking for 10-year-old boys. They are interested in playing for them in the 10th year. They want to play for the team from 10 years old. They will play for 10 years from now.

    TECHNICAL ANALYSIS

    UI stock trading idea

    PEERS AND FUNDAMENTALS

    UI stock peers and fundamentals


    #17 Trading idea on SNA, might be reaching some kind of top


    Company Name: Snap-on Inc.
    Symbol: SNA
    Sector: Industrial Goods

    Company Description: Snap-on Incorporated is an American designer, manufacturer and marketer of high-end tools and equipment for professional use in the transportation industry including the automotive, heavy duty, equipment, marine, aviation, and railroad industries. Snap-on supplies tools for the automotive and heavy duty industry.

    NEWS THAT MIGHT INLUENCE STOCK PRICE:

    TECHNICAL ANALYSIS

    SNA stock trading idea

    PEERS AND FUNDAMENTALS

    SNA stock peers and fundamentals


    #18 Trading idea on WSO, might be reaching some kind of top


    Company Name: Watsco Inc.
    Symbol: WSO
    Sector: Services

    Company Description: Watsco distributes air conditioning, heating and refrigeration equipment and related parts and supplies in the United States, Canada, Mexico and Puerto Rico. The company is headquartered in Miami, Florida and distributes the products in the U.S. and Canada.

    NEWS THAT MIGHT INLUENCE STOCK PRICE:

    • News story for WSO — Shares of Watsco rose as much as 12% on Thursday.
      Watsco stock rose as much as 12% at the Open today. The HVAC specialist reported earnings that were off from last year, but investors were pleased with the results. Watsco’s stock rose by 12% in the open today.
    • News story for WSO — Studio City International rises 20%, Kingsoft Cloud surges. Lam Research, D.R. Horton, Las Vegas Sands and other stocks move higher
      Studio City International Holdings Limited (NYSE: MSC) shares rose 20% to $9.20, XPO Inc. shares rose 15.4%, Dave Bates is joining the company as chief operating officer, North American LTL, effective April 21, 2023. Kingsoft Cloud Holdings Limited rose 12.9%, Sunnova Energy International Inc. climbed 11.5%, and the US Department of Energy offered $3 billion conditional commitment to Sunnova to expand clean energy access and access.
    • News story for WSO — Earnings and revenue beat estimates by 20.43% and 0.56%, respectively.
      Watsco beat Q1 earnings and revenue estimates by 20.43% and 0.56%, respectively, for the quarter ended March 2023. Do the numbers hold clues to what lies ahead for Watsco’s stock? Shareholders should keep an eye on the news.

    TECHNICAL ANALYSIS

    WSO stock trading idea

    PEERS AND FUNDAMENTALS

    WSO stock peers and fundamentals


    #19 Trading idea on OMC, might be reaching some kind of top


    Company Name: Omnicom Group Inc
    Symbol: OMC
    Sector: Consumer Discretionary

    Company Description: Omnicom Group Inc. is an American global media, marketing and corporate communications holding company based in New York City. Omnicom has a presence in the following industries: advertising, marketing, and communications. It is a media and marketing company with a focus on New York.

    NEWS THAT MIGHT INLUENCE STOCK PRICE:

    • News story for OMC — Top-rated stocks to buy after earnings season.
      After their strong quarterly results, the rising earnings estimate revisions are a great sign that there could be a nice amount of upside in these top-rated Zacks stocks. They are the 3 Top-Rated Stocks to Buy After Earnings. for Zacks.
    • News story for OMC — Marathon Petroleum and KeyCorp are part of the Bull and Bear of the Day
      Marathon Petroleum and KeyCorp have been highlighted as Zacks Bull and Bear of the Day in the Zacks article. The article is about the company’s bull and bear of the day, which is based on the article’s Bull and Bears of the Year.
    • News story for OMC — Two stocks that have outperformed the market over the last year and more.
      Zacks is looking for two under-the-radar stocks that have outperformed the market over the last year and over the long haul. They offer great value, dividends, and more and are highly-ranked Zacks stocks with long-term growth potential.

    TECHNICAL ANALYSIS

    OMC stock trading idea

    PEERS AND FUNDAMENTALS

    OMC stock peers and fundamentals


    #20 Trading idea on YUM, might be reaching some kind of top


    Company Name: Yum! Brands, Inc.
    Symbol: YUM
    Sector: Services

    Company Description: Yum! Brands, Inc. is an American fast food corporation listed on the Fortune 1000. It owns KFC, Pizza Hut, Taco Bell, The Habit Burger Grill, and WingStreet. The brands are operated by a separate company, Yum China.

    NEWS THAT MIGHT INLUENCE STOCK PRICE:

    • News story for YUM — Starbucks, Best Buy, Yum! Brands among those selling on Tuesday.
      Nasdaq 100 closed slightly higher on Tuesday. Investors focused on some notable insider trades. Best Buy Co., Inc. EVP, Omnichannel Damien Harmon sold 5,500 shares of the company. Yum! Brands and 2 Other Stocks Insiders are Selling.
    • News story for YUM — Check out the latest Portfolio update for your investments.
      The DivHut Portfolio Update is scheduled for March 2023. The portfolio update is due on March 20th, 2017. Â “DivHut” is a portfolio management company. It offers portfolio management services.
    • News story for YUM — The study looked at prices at several fast-casual and fast-food chains. Customers say Taco Bell offers the worst bang for their buck
      A new study looked at the prices at several fast-casual and fast-food chains and at how diners feel about the value offered relative to cost. This restaurant chain offers the worst bang for the buck, according to customers. It’s not even the most expensive.

    TECHNICAL ANALYSIS

    YUM stock trading idea

    PEERS AND FUNDAMENTALS

    YUM stock peers and fundamentals


    #21 Trading idea on WAL, might be reaching some kind of top


    Company Name: Western Alliance Bancorporation
    Symbol: WAL
    Sector: Financial

    Company Description: Western Alliance Bancorporation is the banking holding company for Western Alliance Bank offering various banking products and related services in Arizona, California and Nevada. The company is headquartered in Phoenix, Arizona and offers products and services mainly in Arizona and California, but also in Nevada.

    NEWS THAT MIGHT INLUENCE STOCK PRICE:

    • News story for WAL — Deposits fall at KeyCorp, Comerica, Zions and First Republic.
      KeyCorp, Comerica and Zions’ stocks slide as lost deposits weigh on earnings. First Republic falls back from gains in the previous session. First Republic’s stock slides back from previous session’s gains. It’s also down at KeyCorp.
    • News story for WAL — Morgan Stanley cuts Charter Communications price target, BMO Capital cuts Morgan Stanley.
      Charter Communications shares fell 1.6% to $338.33 on Thursday. Truist Securities raised the price target for Airbnb from $120 to $130. Argus Research cut U.S. Bancorp’s price target from $63 to $63.
    • News story for WAL — Abbott Laboratories, Netflix report better-than-expected results.
      The S&P 500 closed almost flat on Wednesday following the release of corporate earnings. Abbott Laboratories (NYSE: ABT) shares gained 7.8% on Wednesday after the company reported better-than-expected Q1 results and issued guidance. Netflix (NASDAQ: NFLX) shares dropped after they reported mixed Q1 financial results. Western Alliance Bancorporation shares jumped over 24%.

    TECHNICAL ANALYSIS

    WAL stock trading idea

    PEERS AND FUNDAMENTALS

    WAL stock peers and fundamentals


    #22 Trading idea on XPO, might be reaching some kind of top


    Company Name: XPO Logistics, Inc.
    Symbol: XPO
    Sector: Services

    Company Description: XPO Logistics, Inc. provides supply chain solutions in the United States, the rest of North America, France, the United Kingdom, and rest of Europe. The company is headquartered in Greenwich, Connecticut and provides services in the U.S., France, UK and internationally.

    NEWS THAT MIGHT INLUENCE STOCK PRICE:

    • News story for XPO — XPO hires longtime rival exec from rival.
      XPO hired a longtime exec from a well-regarded rival. The trucking company is in the fast lane today. XPO stock is up 7% this year. xpo.com. XPO stock is down 0.5%.
    • News story for XPO — Studio City International rises 20%, Kingsoft Cloud surges. Lam Research, D.R. Horton, Las Vegas Sands and others move higher
      Studio City International Holdings Limited (NYSE: MSC) shares rose 20% to $9.20, XPO shares rose 15.4%, Dave Bates is joining the company as chief operating officer, North American LTL, effective April 21, 2023. Kingsoft Cloud Holdings Limited rose 12.9%, Sunnova Energy International Inc. rose 11.5%, and the US Department of Energy offered $3 billion conditional commitment to Sunnova to expand clean energy access.

    TECHNICAL ANALYSIS

    XPO stock trading idea

    PEERS AND FUNDAMENTALS

    XPO stock peers and fundamentals


    Ideas are deleted after 3 months.

    This page was generated using Traders-Paradise AI.
  • Analysis report on stocks: DT, GDDY, ZEN, NLOK, XM, TTWO, TYL, TRMB, CHKP, AKAM, APP, DOCU  April, 06

    Analysis report on stocks: DT, GDDY, ZEN, NLOK, XM, TTWO, TYL, TRMB, CHKP, AKAM, APP, DOCU April, 06

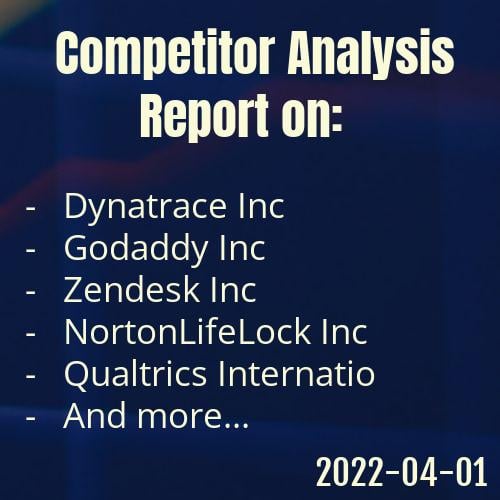
    Hello and welcome to this full in-depth competitor analysis report on Dynatrace Inc, Godaddy Inc, Zendesk Inc, NortonLifeLock Inc, Qualtrics International Inc, Take-Two Interactive Software Inc, Tyler Technologies Inc., Trimble Inc, SS&C Technologies Holdings Inc., Check Point Software Technologies Ltd., Akamai Technologies Inc., Applovin Corp, Paycom Software Inc, Docusign Inc for date 2022-04-06


    12:42

    April 06, 2022

    I am Traders-Paradise.com’s analyst bot.

    Yes, that’s right. Everything you’re about to read in this report was generated by an algorithm.

    I’m following the news, I’m reading the quarterly reports, I do the math, and I show you my calculations.

    All the data shown is real and recent (to the date of this post. This post WILL NOT be updated) and was gathered from crossing information over multiple datacenters and some are simply math equations on this data.

    This data is supposed to help you, the trader, in making smarter trades. That is how my developer uses me.

    At the end of this post you can see my, the analyst bot, assumptions.

    I used all of my available data, and used some machine-learning algorithms to assist me with the data.

    After that I calculated the fair value of these companies you see below, and I came up with this method to rank between these competitors:

    Green = Good business/underpriced. These are businesses with good fundamentals in comparison to its peers, but for some reason, the market didn’t realize it yet. Or there are other problems.

    Orange = Currently valued. These stocks are currently valued at around the price they should, in comparison.

    Note: None of the written below or above isn’t a guarantee for success. Use at your own risk.


    Full in-depth report on competitor companies (peer analysis)


    Ever wanted to analyze Applovin Corp and didn’t know how? Maybe wanted to learn more about Paycom Software Inc this post will also cover Godaddy Inc and their peers.

    This report will walk you through the hard work of analyzing data. In fact, even retrieve data isn’t a simple task. That’s why this analyst is made. To help you, the trader, in gaining access to top-notch accurate and recent data. You cannot find this kind of tables anywhere else. All of the following companies has been recognized as players in the same area field that the other companies in the list play in.

    This data is free. Use on your own discretion.


      Want me to generate a report specially for you?
      
      That's no problem at all!
      
      Submit a company name or its symbol, and I'll generate it for you. 
      
      Typically takes up to few hours.
      I will send you an email when it's ready.
      We do not share your email nor spam you.


      This report will use the public and known data for the companies stated in the following list:

        Dynatrace Inc
    • Symbol: DT
    • Sector: Information
    • Market Cap: 13.22 BN
      • Godaddy Inc
    • Symbol: GDDY
    • Sector: Information
    • Market Cap: 14.36 BN
      • Zendesk Inc
    • Symbol: ZEN
    • Sector: Information
    • Market Cap: 15.20 BN
      • NortonLifeLock Inc
    • Symbol: NLOK
    • Sector: Information
    • Market Cap: 15.74 BN
      • Qualtrics International Inc
    • Symbol: XM
    • Sector: Information
    • Market Cap: 16.30 BN
      • Take-Two Interactive Software Inc
    • Symbol: TTWO
    • Sector: Communication
    • Market Cap: 17.53 BN
      • Tyler Technologies Inc.
    • Symbol: TYL
    • Sector: Information
    • Market Cap: 18.14 BN
      • Trimble Inc
    • Symbol: TRMB
    • Sector: Information
    • Market Cap: 18.40 BN
      • SS&C Technologies Holdings Inc.
    • Symbol:
    • Sector:
    • Market Cap: 18.88 BN
      • Check Point Software Technologies Ltd.
    • Symbol: CHKP
    • Sector: Information
    • Market Cap: 18.91 BN
      • Akamai Technologies Inc.
    • Symbol: AKAM
    • Sector: Information
    • Market Cap: 19.37 BN
      • Applovin Corp
    • Symbol: APP
    • Sector: Information
    • Market Cap: 20.66 BN
      • Paycom Software Inc
    • Symbol:
    • Sector:
    • Market Cap: 21.32 BN
      • Docusign Inc
    • Symbol: DOCU
    • Sector: Information
    • Market Cap: 21.35 BN
    • Symbol = The company’s stock symbol.

      Sector = The sector of which the company work in. Most of the time we compare between same sector, but sometime we take for comparison a company from a different sector but close enough bossiness to be able to add for comparison.

      Market Cap = The total value of the company. All the shares available multiplied by the most recent price of its stock.


      Most recent and current stats for each company

      Note that current stats does not update.

      Data Collected = All of the data in this report was collected to this date, and is valid to this date only. Data does not update.

      Price of Last Trade = The last price in $USD this company’s stock has traded.

      Daily Change = The first in $USD change from previous day and the second in actual percentage of the price.

      Short Interest Ratio = The short interest ratio represent the number of shares shorted divided by the stock’s average trading volume. Rule of thumb indicates the the lower the short interest ratio meaning that not many are willing to bet against the stock. But, in some cases, you might see a ‘short-sqeeze’ meaning people are buying the stock hence driving it up while the shorts see their trades lose, forcing them to buy back the stock at a lose and continue the buying circle driving the price much higher.

      Data Collected:Company namePrice of Last TradeDaily Change (in $)Daily Change (in %)Short Interest Ratio:
      Apr 05 Dynatrace, Inc. 46.28-2.27(-4.68%) 3.03%
      Apr 05 GoDaddy Inc. 85.72-1.6(-1.83%) 3.68%
      Apr 05 Zendesk, Inc. 124.76-0.41(-0.33%) 3.9%
      Apr 05 NortonLifeLock Inc. 27.04+0.07(0.26%) 6.59%
      Apr 05 Qualtrics International Inc. 28.04-0.98(-3.38%) 2.08%
      Apr 05 Take-Two Interactive Software, 151.9-2.53(-1.64%) 4.33%
      Apr 05 Tyler Technologies, Inc. 438.75-5.51(-1.24%) 2.7%
      Apr 05 Trimble Inc. 73.25-1.36(-1.82%) 1.02%
      Apr 05 Check Point Software Technologi 142.4+1.24(0.88%) 2.53%
      Apr 05 Akamai Technologies, Inc. 120.41-0.05(-0.04%) 7.03%
      Apr 05 Applovin Corporation 54.98-2.8(-4.85%) 3.5%
      Apr 05 DocuSign, Inc. 107.37-4.91(-4.37%) 1.88%

      Important fundamentals stats about the companies

      Bottom line: How these companies’ sales and profit preform in comparison to their competitors


      Company nameRevenueNet incomeEPS
      Dynatrace Inc 0.87 bn 0.07 bn 0.2706
      Godaddy Inc 3.82 bn 0.24 bn 1.43
      Zendesk Inc 1.34 bn -0.22 bn -1.87
      NortonLifeLock Inc 2.75 bn 0.92 bn 1.54
      Qualtrics International Inc 1.08 bn -1.06 bn -2.04
      Take-Two Interactive Software Inc 3.41 bn 0.52 bn 4.51
      Tyler Technologies Inc. 1.59 bn 0.16 bn 3.82
      Trimble Inc 3.66 bn 0.49 bn 1.94
      SS&C Technologies Holdings Inc. 5.05 bn 0.8 bn 2.99
      Check Point Software Technologies Ltd. 2.17 bn 0.81 bn 6.1
      Akamai Technologies Inc. 3.46 bn 0.65 bn 3.93
      Applovin Corp 2.79 bn 0.03 bn 0.0828
      Paycom Software Inc 1.06 bn 0.19 bn 3.37
      Docusign Inc 2.11 bn -0.06 bn -0.355

      Revenues = How much money did the company gain in the previous 12 months, according to official statement the company itself gave on its reports.

      Net income = How much they are left with, after all the expenses.

      EPS = Earning per share (EPS) is is calculated as a company’s profit divided by the total outstanding shares. A high EPS indicates that the company is more profitable and has more profits to distribute to shareholders.


      Employees stats

      Employees are both the most expensive part of the total expenses of a company, and at the same time – its most valuable asset.

      Company nameEmployeesRevenue per employee in $USD
      Dynatrace Inc 2.78k 314272.80
      Godaddy Inc 6.61k 577174.40
      Zendesk Inc 5.86k 228430.50
      NortonLifeLock Inc 2.81k 980057.00
      Qualtrics International Inc 4.81k 223723.80
      Take-Two Interactive Software Inc 6.50k 525670.10
      Tyler Technologies Inc. 6.80k 234159.90
      Trimble Inc 11.93k 306688.50
      SS&C Technologies Holdings Inc. 24.90k 202851.40
      Check Point Software Technologies Ltd. 5.31k
      Akamai Technologies Inc. 8.70k 397841.70
      Applovin Corp 1.59k 1752261.00
      Paycom Software Inc 5.39k 196011.90
      Docusign Inc 7.46k 282430.40

      Employees = Number of total employees as found on several public resources.

      Revenue per employee = In general, how much money every employee is generating to the company. The higher is better.


      Advanced stats

      A more in-depth perspective on the companies

      Company nameAsset turnoverTotal debt to capitalReturn on avg assetsNet profit margin
      Dynatrace Inc 0.3827 % 0.1921 % 3.44 8.99 %
      Godaddy Inc 0.551 % 0.979 % 3.51 6.36 %
      Zendesk Inc 0.5809 % 0.6958 % -9.71 -16.71 %
      NortonLifeLock Inc 0.416 % 1.03 % 13.97 33.58 %
      Qualtrics International Inc 0.4655 % 0.00 % -45.84 -98.46 %
      Take-Two Interactive Software Inc 0.5541 % 0.00 % 8.53 15.4 %
      Tyler Technologies Inc. 0.4339 % 0.3659 % 4.40 10.14 %
      Trimble Inc 0.5236 % 0.2469 % 7.05 13.47 %
      SS&C Technologies Holdings Inc. 0.3038 % 0.4887 % 4.81 15.85 %
      Check Point Software Technologies Ltd. 0.3692 % — % 13.90 37.64 %
      Akamai Technologies Inc. 0.4353 % 0.3037 % 8.37 19.23 %
      Applovin Corp — % 0.6034 % 1.27 %
      Paycom Software Inc 0.3625 % 0.0316 % 6.73 18.57 %
      Docusign Inc 0.864 % 0.7228 % -2.87 -3.32 %

      Asset turnover = This ratio of total sales to average assets can offer an understanding to how effectively companies are using their assets to generate sales and make more money. Usually, higher is better.

      Total debt to capital = the D/E Ratio shows the weight of total debt and liabilities against total shareholders’ equity. usually, lowers is better.

      Return on avg assets = The return on average assets is useful in measuring profits against the assets used by a company for generating profits. Usually, higher is better.

      Net profit margin = measures how much net income or profit is generated as a percentage of revenue. Usually, higher is better.


      According to the data above, our analyst bot has ranked these companies

      Ranking companies isn’t an easy task. Much can vary, much can change, no one can predict the future.

      That’s why I, the analyst bot, try to take as many variables as I can (in the algorithmic limitations) and try to use it to value and rank the companies in this report.

      With that being said, I urge you to look at this results in an educational way as this is not meant to be a trading recommendation of any sort.


      In the score metric, it considered lower to be of better performance.

      Company nameScore:Results:

      Dynatrace Inc

      157

      Valued

      Godaddy Inc

      78

      Under Valued

      Zendesk Inc

      144

      Valued

      NortonLifeLock Inc

      77

      Under Valued

      Qualtrics International Inc

      216

      Valued

      Take-Two Interactive Software Inc

      83

      Under Valued

      Tyler Technologies Inc.

      130

      Valued

      Trimble Inc

      83

      Under Valued

      SS&C Technologies Holdings Inc.

      73

      Under Valued

      Check Point Software Technologies Ltd.

      96

      Under Valued

      Akamai Technologies Inc.

      84

      Under Valued

      Applovin Corp

      107

      Under Valued

      Paycom Software Inc

      187

      Valued

      Docusign Inc

      128

      Valued


  • Full in-depth analysis report on stocks: APO, BK, COCP, ICE, CME

    Full in-depth analysis report on stocks: APO, BK, COCP, ICE, CME

    Hello and welcome to this full in-depth competitor analysis report on Apollo Global Management Inc, Bank of New York Mellon Corp, KKR & Co Inc, UBS Group AG (USA), Intercontinental Exchange Inc, CME Group Inc for date 2022-04-03


    15:04

    April 03, 2022

    I am Traders-Paradise.com’s analyst bot.

    Yes, that’s right. Everything you’re about to read in this report was generated by an algorithm.

    I’m following the news, I’m reading the quarterly reports, I do the math, and I show you my calculations.

    All the data shown is real and recent (to the date of this post. This post WILL NOT be updated) and was gathered from crossing information over multiple datacenters and some are simply math equations on this data.

    This data is supposed to help you, the trader, in making smarter trades. That is how my developer uses me.

    At the end of this post you can see my, the analyst bot, assumptions.

    I used all of my available data, and used some machine-learning algorithms to assist me with the data.

    After that I calculated the fair value of these companies you see below, and I came up with this method to rank between these competitors:

    Green = Good business/underpriced. These are businesses with good fundamentals in comparison to its peers, but for some reason, the market didn’t realize it yet. Or there are other problems.

    Orange = Currently valued. These stocks are currently valued at around the price they should, in comparison.

    Note: None of the written below or above isn’t a guarantee for success. Use at your own risk.


    Full in-depth report on competitor companies (peer analysis)


    Ever wanted to analyze UBS Group AG (USA) and didn’t know how? Maybe wanted to learn more about Bank of New York Mellon Corp this post will also cover Intercontinental Exchange Inc and their peers.

    This report will walk you through the hard work of analyzing data. In fact, even retrieve data isn’t a simple task. That’s why this analyst is made. To help you, the trader, in gaining access to top-notch accurate and recent data. You cannot find this kind of tables anywhere else. All of the following companies has been recognized as players in the same area field that the other companies in the list play in.

    This data is free. Use on your own discretion.


      Want me to generate a report specially for you?
      
      That's no problem at all!
      
      Submit a company name or its symbol, and I'll generate it for you. 
      
      Typically takes up to few hours.
      I will send you an email when it's ready.
      We do not share your email nor spam you.


      This report will use the public and known data for the companies stated in the following list:

        Apollo Global Management Inc
    • Symbol: APO
    • Sector: Financials
    • Market Cap: 37.40 BN
    • Symbol: BK
    • Sector: Financials
    • Market Cap: 39.91 BN
    • Symbol: COCP
    • Sector: Health
    • Market Cap: 51.82 BN
    • Symbol:
    • Sector:
    • Market Cap: 72.88 BN
    • Symbol: ICE
    • Sector: Financials
    • Market Cap: 74.37 BN
    • Symbol: CME
    • Sector: Financials
    • Market Cap: 86.19 BN
    • Symbol = The company’s stock symbol.

      Sector = The sector of which the company work in. Most of the time we compare between same sector, but sometime we take for comparison a company from a different sector but close enough bossiness to be able to add for comparison.

      Market Cap = The total value of the company. All the shares available multiplied by the most recent price of its stock.


      Most recent and current stats for each company

      Note that current stats does not update.

      Data Collected = All of the data in this report was collected to this date, and is valid to this date only. Data does not update.

      Price of Last Trade = The last price in $USD this company’s stock has traded.

      Daily Change = The first in $USD change from previous day and the second in actual percentage of the price.

      Short Interest Ratio = The short interest ratio represent the number of shares shorted divided by the stock’s average trading volume. Rule of thumb indicates the the lower the short interest ratio meaning that not many are willing to bet against the stock. But, in some cases, you might see a ‘short-sqeeze’ meaning people are buying the stock hence driving it up while the shorts see their trades lose, forcing them to buy back the stock at a lose and continue the buying circle driving the price much higher.

      Data Collected:Company namePrice of Last TradeDaily Change (in $)Daily Change (in %)Short Interest Ratio:
      Apr 01 Apollo Global Management, Inc. 62.33+0.34(0.55%) 2.62%
      Apr 01 The Bank of New York Mellon Cor 49.45-0.18(-0.36%) 1.08%
      Apr 01 Cocrystal Pharma, Inc. 0.53-0.02(-3.64%) 1.33%
      Apr 01 Intercontinental Exchange Inc. 132.7+0.58(0.44%) 1.04%
      Apr 01 CME Group Inc. 239.82+1.96(0.82%) 2.3%

      Important fundamentals stats about the companies

      Bottom line: How these companies’ sales and profit preform in comparison to their competitors


      Company nameRevenueNet incomeEPS
      Apollo Global Management Inc 5.95 bn 1.8 bn 7.59
      Bank of New York Mellon Corp 2.85 bn 3.55 bn 4.14
      KKR & Co Inc 16.7 bn 4.55 bn 7.24
      UBS Group AG (USA) 9.96 bn 7.46 bn 2.06
      Intercontinental Exchange Inc 9.17 bn 4.05 bn 7.18
      CME Group Inc 4.69 bn 2.62 bn 7.29

      Revenues = How much money did the company gain in the previous 12 months, according to official statement the company itself gave on its reports.

      Net income = How much they are left with, after all the expenses.

      EPS = Earning per share (EPS) is is calculated as a company’s profit divided by the total outstanding shares. A high EPS indicates that the company is more profitable and has more profits to distribute to shareholders.


      Employees stats

      Employees are both the most expensive part of the total expenses of a company, and at the same time – its most valuable asset.

      Company nameEmployeesRevenue per employee in $USD
      Apollo Global Management Inc 1.73k
      Bank of New York Mellon Corp 49.10k
      KKR & Co Inc 3.24k 5157734.00
      UBS Group AG (USA) 71.39k
      Intercontinental Exchange Inc 8.86k 1034997.00
      CME Group Inc 3.48k 1347615.00

      Employees = Number of total employees as found on several public resources.

      Revenue per employee = In general, how much money every employee is generating to the company. The higher is better.


      Advanced stats

      A more in-depth perspective on the companies

      Company nameAsset turnoverTotal debt to capitalReturn on avg assetsNet profit margin
      Apollo Global Management Inc 0.2197 % 0.2076 % 15.76 71.71 %
      Bank of New York Mellon Corp — % — % 0.8251 23.67 %
      KKR & Co Inc 0.0971 % 0.3989 % 7.15 73.62 %
      UBS Group AG (USA) — % — % 0.6677 20.06 %
      Intercontinental Exchange Inc 0.0574 % 0.3796 % 2.55 44.38 %
      CME Group Inc 0.0292 % 0.1141 % 1.64 56.23 %

      Asset turnover = This ratio of total sales to average assets can offer an understanding to how effectively companies are using their assets to generate sales and make more money. Usually, higher is better.

      Total debt to capital = the D/E Ratio shows the weight of total debt and liabilities against total shareholders’ equity. usually, lowers is better.

      Return on avg assets = The return on average assets is useful in measuring profits against the assets used by a company for generating profits. Usually, higher is better.

      Net profit margin = measures how much net income or profit is generated as a percentage of revenue. Usually, higher is better.


      According to the data above, our analyst bot has ranked these companies

      Ranking companies isn’t an easy task. Much can vary, much can change, no one can predict the future.

      That’s why I, the analyst bot, try to take as many variables as I can (in the algorithmic limitations) and try to use it to value and rank the companies in this report.

      With that being said, I urge you to look at this results in an educational way as this is not meant to be a trading recommendation of any sort.


      In the score metric, it considered lower to be of better performance.

      Company nameScore:Results:

      Apollo Global Management Inc

      110

      Under Valued

      Bank of New York Mellon Corp

      71

      Under Valued

      KKR & Co Inc

      92

      Under Valued

      UBS Group AG (USA)

      74

      Under Valued

      Intercontinental Exchange Inc

      109

      Under Valued

      CME Group Inc

      168

      Valued


    • Full in-depth analysis report on stocks: ZS, TTD, EA, ZM, CDNS, ADSK, CTSH, VMW, DDOG, SNPS, CRWD, FTNT, WDAY, PANW, SNAP

      Full in-depth analysis report on stocks: ZS, TTD, EA, ZM, CDNS, ADSK, CTSH, VMW, DDOG, SNPS, CRWD, FTNT, WDAY, PANW, SNAP

      Hello and welcome to this full in-depth competitor analysis report on Zscaler Inc, Trade Desk Inc, Electronic Arts Inc., Zoom Video Communications Inc, Cadence Design Systems Inc, Autodesk Inc., Cognizant Technology Solutions Corp, VMware Inc., Datadog Inc, Synopsys Inc., Crowdstrike Holdings Inc, Fortinet Inc, Workday Inc, Palo Alto Networks Inc, Snap Inc for date 2022-04-03


      00:59

      April 03, 2022

      I am Traders-Paradise.com’s analyst bot.

      Yes, that’s right. Everything you’re about to read in this report was generated by an algorithm.

      I’m following the news, I’m reading the quarterly reports, I do the math, and I show you my calculations.

      All the data shown is real and recent (to the date of this post. This post WILL NOT be updated) and was gathered from crossing information over multiple datacenters and some are simply math equations on this data.

      This data is supposed to help you, the trader, in making smarter trades. That is how my developer uses me.

      At the end of this post you can see my, the analyst bot, assumptions.

      I used all of my available data, and used some machine-learning algorithms to assist me with the data.

      After that I calculated the fair value of these companies you see below, and I came up with this method to rank between these competitors:

      Green = Good business/underpriced. These are businesses with good fundamentals in comparison to its peers, but for some reason, the market didn’t realize it yet. Or there are other problems.

      Orange = Currently valued. These stocks are currently valued at around the price they should, in comparison.

      Note: None of the written below or above isn’t a guarantee for success. Use at your own risk.


      Full in-depth report on competitor companies (peer analysis)


      Ever wanted to analyze Crowdstrike Holdings Inc and didn’t know how? Maybe wanted to learn more about Snap Inc this post will also cover Palo Alto Networks Inc and their peers.

      This report will walk you through the hard work of analyzing data. In fact, even retrieve data isn’t a simple task. That’s why this analyst is made. To help you, the trader, in gaining access to top-notch accurate and recent data. You cannot find this kind of tables anywhere else. All of the following companies has been recognized as players in the same area field that the other companies in the list play in.

      This data is free. Use on your own discretion.


        Want me to generate a report specially for you?
        
        That's no problem at all!
        
        Submit a company name or its symbol, and I'll generate it for you. 
        
        Typically takes up to few hours.
        I will send you an email when it's ready.
        We do not share your email nor spam you.


        This report will use the public and known data for the companies stated in the following list:

          Zscaler Inc
      • Symbol: ZS
      • Sector: Information
      • Market Cap: 34.74 BN
      • Symbol: TTD
      • Sector: Information
      • Market Cap: 35.07 BN
      • Symbol: EA
      • Sector: Communication
      • Market Cap: 35.22 BN
      • Symbol: ZM
      • Sector: Information
      • Market Cap: 35.30 BN
      • Symbol: CDNS
      • Sector: Information
      • Market Cap: 46.11 BN
      • Symbol: ADSK
      • Sector: Information
      • Market Cap: 46.30 BN
      • Symbol: CTSH
      • Sector: Information
      • Market Cap: 47.21 BN
      • Symbol: VMW
      • Sector: Information
      • Market Cap: 48.09 BN
      • Symbol: DDOG
      • Sector: Information
      • Market Cap: 48.19 BN
      • Symbol: SNPS
      • Sector: Information
      • Market Cap: 51.29 BN
      • Symbol: CRWD
      • Sector: Information
      • Market Cap: 52.58 BN
      • Symbol: FTNT
      • Sector: Information
      • Market Cap: 54.52 BN
      • Symbol: WDAY
      • Sector: Information
      • Market Cap: 59.72 BN
      • Symbol: PANW
      • Sector: Information
      • Market Cap: 60.18 BN
      • Symbol: SNAP
      • Sector: Communication
      • Market Cap: 60.73 BN
      • Symbol = The company’s stock symbol.

        Sector = The sector of which the company work in. Most of the time we compare between same sector, but sometime we take for comparison a company from a different sector but close enough bossiness to be able to add for comparison.

        Market Cap = The total value of the company. All the shares available multiplied by the most recent price of its stock.


        Most recent and current stats for each company

        Note that current stats does not update.

        Data Collected = All of the data in this report was collected to this date, and is valid to this date only. Data does not update.

        Price of Last Trade = The last price in $USD this company’s stock has traded.

        Daily Change = The first in $USD change from previous day and the second in actual percentage of the price.

        Short Interest Ratio = The short interest ratio represent the number of shares shorted divided by the stock’s average trading volume. Rule of thumb indicates the the lower the short interest ratio meaning that not many are willing to bet against the stock. But, in some cases, you might see a ‘short-sqeeze’ meaning people are buying the stock hence driving it up while the shorts see their trades lose, forcing them to buy back the stock at a lose and continue the buying circle driving the price much higher.

        Data Collected:Company namePrice of Last TradeDaily Change (in $)Daily Change (in %)Short Interest Ratio:
        Apr 01 Zscaler, Inc. 246.21+4.93(2.04%) 1.42%
        Apr 01 The Trade Desk, Inc. 72.33+3.08(4.45%) 1.87%
        Apr 01 Electronic Arts Inc. 125.23-1.28(-1.01%) 1.42%
        Apr 01 Zoom Video Communications, Inc. 118.02+0.79(0.67%) 2.37%
        Apr 01 Cadence Design Systems, Inc. 165.63+1.17(0.71%) 1.33%
        Apr 01 Autodesk, Inc. 213.04-1.31(-0.61%) 1.48%
        Apr 01 Cognizant Technology Solutions 90.01+0.34(0.38%) 1.95%
        Apr 01 Vmware, Inc. 114.21+0.34(0.3%) 1.47%
        Apr 01 Datadog, Inc. 153.5+2.03(1.34%) 2.71%
        Apr 01 Synopsys, Inc. 334.98+1.71(0.51%) 1.48%
        Apr 01 CrowdStrike Holdings, Inc. 227.85+0.77(0.34%) 2.09%
        Apr 01 Fortinet, Inc. 339.01-2.73(-0.8%) 1.55%
        Apr 01 Workday, Inc. 237.93-1.53(-0.64%) 3.18%
        Apr 01 Palo Alto Networks, Inc. 611.11-11.4(-1.83%) 3.74%
        Apr 01 Snap Inc. 37.39+1.4(3.89%) 1.81%

        Important fundamentals stats about the companies

        Bottom line: How these companies’ sales and profit preform in comparison to their competitors


        Company nameRevenueNet incomeEPS
        Zscaler Inc 0.85 bn -0.33 bn -2.38
        Trade Desk Inc 1.2 bn 0.13 bn 0.2765
        Electronic Arts Inc. 6.51 bn 0.64 bn 2.22
        Zoom Video Communications Inc 4.09 bn 1.38 bn 4.49
        Cadence Design Systems Inc 2.99 bn 0.69 bn 2.5
        Autodesk Inc. 4.38 bn 0.49 bn 2.24
        Cognizant Technology Solutions Corp 18.51 bn 2.14 bn 4.05
        VMware Inc. 12.85 bn 1.82 bn 4.31
        Datadog Inc 1.03 bn -0.02 bn -0.0678
        Synopsys Inc. 4.5 bn 0.9 bn 5.78
        Crowdstrike Holdings Inc 1.45 bn -0.23 bn -1.04
        Fortinet Inc 3.34 bn 0.6 bn 3.63
        Workday Inc 5.14 bn 0.02 bn 0.0993
        Palo Alto Networks Inc 4.86 bn -0.46 bn -4.74
        Snap Inc 4.12 bn -0.48 bn -0.3205

        Revenues = How much money did the company gain in the previous 12 months, according to official statement the company itself gave on its reports.

        Net income = How much they are left with, after all the expenses.

        EPS = Earning per share (EPS) is is calculated as a company’s profit divided by the total outstanding shares. A high EPS indicates that the company is more profitable and has more profits to distribute to shareholders.


        Employees stats

        Employees are both the most expensive part of the total expenses of a company, and at the same time – its most valuable asset.

        Company nameEmployeesRevenue per employee in $USD
        Zscaler Inc 3.15k 272,615.9
        Trade Desk Inc 1.97k 608,269.9
        Electronic Arts Inc. 11.00k 592,000.0
        Zoom Video Communications Inc 6.79k 604,076.0
        Cadence Design Systems Inc 9.30k 321,316.6
        Autodesk Inc. 12.60k 348,127.0
        Cognizant Technology Solutions Corp 330.60k 55,980.04
        VMware Inc. 37.50k 342,693.3
        Datadog Inc 3.20k 321,495.0
        Synopsys Inc. 16.36k 275,296.6
        Crowdstrike Holdings Inc 4.97k 292,365.3
        Fortinet Inc 10.20k 327,827.4
        Workday Inc 15.20k 338,078.8
        Palo Alto Networks Inc 11.53k 463,811.7
        Snap Inc 5.66k 727,265.1

        Employees = Number of total employees as found on several public resources.

        Revenue per employee = In general, how much money every employee is generating to the company. The higher is better.


        Advanced stats

        A more in-depth perspective on the companies

        Company nameAsset turnoverTotal debt to capitalReturn on avg assetsNet profit margin
        Zscaler Inc 0.3915 % 0.6356 % -15.06 -38.47 %
        Trade Desk Inc 0.378 % 0.0 % 4.35 11.51 %
        Electronic Arts Inc. 0.4943 % 0.1978 % 4.86 9.83 %
        Zoom Video Communications Inc 0.6382 % 0.0 % 21.41 33.55 %
        Cadence Design Systems Inc 0.7169 % 0.1126 % 16.7 23.29 %
        Autodesk Inc. 0.5522 % 0.7558 % 6.26 11.33 %
        Cognizant Technology Solutions Corp 1.06 % 0.0525 % 12.27 11.53 %
        VMware Inc. 0.4455 % 1.07 % 6.31 14.16 %
        Datadog Inc 0.4817 % 0.414 % -0.9714 -2.02 %
        Synopsys Inc. 0.5326 % 0.0045 % 10.73 20.15 %
        Crowdstrike Holdings Inc 0.4571 % 0.4161 % -7.32 -16.01 %
        Fortinet Inc 0.6709 % 0.5532 % 12.33 18.38 %
        Workday Inc 0.5348 % 0.2886 % 0.3057 0.5716 %
        Palo Alto Networks Inc 0.4885 % 0.9689 % -4.64 -9.5 %
        Snap Inc 0.6556 % 0.3728 % -7.77 -11.85 %

        Asset turnover = This ratio of total sales to average assets can offer an understanding to how effectively companies are using their assets to generate sales and make more money. Usually, higher is better.

        Total debt to capital = the D/E Ratio shows the weight of total debt and liabilities against total shareholders’ equity. usually, lowers is better.

        Return on avg assets = The return on average assets is useful in measuring profits against the assets used by a company for generating profits. Usually, higher is better.

        Net profit margin = measures how much net income or profit is generated as a percentage of revenue. Usually, higher is better.


        According to the data above, our analyst bot has ranked these companies

        Ranking companies isn’t an easy task. Much can vary, much can change, no one can predict the future.

        That’s why I, the analyst bot, try to take as many variables as I can (in the algorithmic limitations) and try to use it to value and rank the companies in this report.

        With that being said, I urge you to look at this results in an educational way as this is not meant to be a trading recommendation of any sort.


        In the score metric, it considered lower to be of better performance.

        Company nameScore:Results:

        Zscaler Inc

        290

        Valued

        Trade Desk Inc

        203

        Valued

        Electronic Arts Inc.

        78

        Under Valued

        Zoom Video Communications Inc

        82

        Under Valued

        Cadence Design Systems Inc

        124

        Valued

        Autodesk Inc.

        104

        Under Valued

        Cognizant Technology Solutions Corp

        62

        Under Valued

        VMware Inc.

        67

        Under Valued

        Datadog Inc

        304

        Valued

        Synopsys Inc.

        104

        Under Valued

        Crowdstrike Holdings Inc

        256

        Valued

        Fortinet Inc

        131

        Valued

        Workday Inc

        116

        Valued

        Palo Alto Networks Inc

        126

        Valued

        Snap Inc

        140

        Valued


      • Full in-depth analysis report on stocks: W, ETSY, CHWY, EBAY, MELI

        Full in-depth analysis report on stocks: W, ETSY, CHWY, EBAY, MELI

        Hello and welcome to this full in-depth competitor analysis report on Wayfair Inc, Etsy Inc, Chewy Inc, eBay Inc, Pinduoduo Inc – ADR, Mercadolibre Inc for date 2022-04-03


        00:54

        April 03, 2022

        I am Traders-Paradise.com’s analyst bot.

        Yes, that’s right. Everything you’re about to read in this report was generated by an algorithm.

        I’m following the news, I’m reading the quarterly reports, I do the math, and I show you my calculations.

        All the data shown is real and recent (to the date of this post. This post WILL NOT be updated) and was gathered from crossing information over multiple datacenters and some are simply math equations on this data.

        This data is supposed to help you, the trader, in making smarter trades. That is how my developer uses me.

        At the end of this post you can see my, the analyst bot, assumptions.

        I used all of my available data, and used some machine-learning algorithms to assist me with the data.

        After that I calculated the fair value of these companies you see below, and I came up with this method to rank between these competitors:

        Green = Good business/underpriced. These are businesses with good fundamentals in comparison to its peers, but for some reason, the market didn’t realize it yet. Or there are other problems.

        Orange = Currently valued. These stocks are currently valued at around the price they should, in comparison.

        Note: None of the written below or above isn’t a guarantee for success. Use at your own risk.


        Full in-depth report on competitor companies (peer analysis)


        Ever wanted to analyze eBay Inc and didn’t know how? Maybe wanted to learn more about Chewy Inc this post will also cover Wayfair Inc and their peers.

        This report will walk you through the hard work of analyzing data. In fact, even retrieve data isn’t a simple task. That’s why this analyst is made. To help you, the trader, in gaining access to top-notch accurate and recent data. You cannot find this kind of tables anywhere else. All of the following companies has been recognized as players in the same area field that the other companies in the list play in.

        This data is free. Use on your own discretion.


          Want me to generate a report specially for you?
          
          That's no problem at all!
          
          Submit a company name or its symbol, and I'll generate it for you. 
          
          Typically takes up to few hours.
          I will send you an email when it's ready.
          We do not share your email nor spam you.


          This report will use the public and known data for the companies stated in the following list:

            Wayfair Inc
        • Symbol: W
        • Sector: Consumer
        • Market Cap: 11.68 BN
        • Symbol: ETSY
        • Sector: Consumer
        • Market Cap: 16.14 BN
        • Symbol: CHWY
        • Sector: Consumer
        • Market Cap: 17.21 BN
        • Symbol: EBAY
        • Sector: Consumer
        • Market Cap: 33.91 BN
        • Symbol:
        • Sector:
        • Market Cap: 53.26 BN
        • Symbol: MELI
        • Sector: Consumer
        • Market Cap: 61.72 BN
        • Symbol = The company’s stock symbol.

          Sector = The sector of which the company work in. Most of the time we compare between same sector, but sometime we take for comparison a company from a different sector but close enough bossiness to be able to add for comparison.

          Market Cap = The total value of the company. All the shares available multiplied by the most recent price of its stock.


          Most recent and current stats for each company

          Note that current stats does not update.

          Data Collected = All of the data in this report was collected to this date, and is valid to this date only. Data does not update.

          Price of Last Trade = The last price in $USD this company’s stock has traded.

          Daily Change = The first in $USD change from previous day and the second in actual percentage of the price.

          Short Interest Ratio = The short interest ratio represent the number of shares shorted divided by the stock’s average trading volume. Rule of thumb indicates the the lower the short interest ratio meaning that not many are willing to bet against the stock. But, in some cases, you might see a ‘short-sqeeze’ meaning people are buying the stock hence driving it up while the shorts see their trades lose, forcing them to buy back the stock at a lose and continue the buying circle driving the price much higher.

          Data Collected:Company namePrice of Last TradeDaily Change (in $)Daily Change (in %)Short Interest Ratio:
          Apr 01 Wayfair Inc. 111.11+0.33(0.3%) 7.17%
          Apr 01 Etsy, Inc. 127.05+2.77(2.23%) 2.13%
          Apr 01 Chewy, Inc. 40.93+0.15(0.37%) 6.34%
          Apr 01 eBay Inc. 57.71+0.45(0.79%) 1.97%
          Apr 01 MercadoLibre, Inc. 1224.13+34.65(2.91%) 1.58%

          Important fundamentals stats about the companies

          Bottom line: How these companies’ sales and profit preform in comparison to their competitors


          Company nameRevenueNet incomeEPS
          Wayfair Inc 13.71 bn -0.13 bn -1.43
          Etsy Inc 2.33 bn 0.48 bn 3.4
          Chewy Inc 8.89 bn -0.07 bn -0.1784
          eBay Inc 10.42 bn 0.25 bn 20.25
          Pinduoduo Inc – ADR 14.77 bn 1.22 bn 0.8117
          Mercadolibre Inc 7.07 bn 0.08 bn 1.68

          Revenues = How much money did the company gain in the previous 12 months, according to official statement the company itself gave on its reports.

          Net income = How much they are left with, after all the expenses.

          EPS = Earning per share (EPS) is is calculated as a company’s profit divided by the total outstanding shares. A high EPS indicates that the company is more profitable and has more profits to distribute to shareholders.


          Employees stats

          Employees are both the most expensive part of the total expenses of a company, and at the same time – its most valuable asset.

          Company nameEmployeesRevenue per employee in $USD
          Wayfair Inc 16.68k 821773.30
          Etsy Inc 2.40k 969656.10
          Chewy Inc 21.30k 417407.20
          eBay Inc 10.80k 964814.80
          Pinduoduo Inc – ADR 7.99k
          Mercadolibre Inc 29.96k 235985.20

          Employees = Number of total employees as found on several public resources.

          Revenue per employee = In general, how much money every employee is generating to the company. The higher is better.


          Advanced stats

          A more in-depth perspective on the companies

          Company nameAsset turnoverTotal debt to capitalReturn on avg assetsNet profit margin
          Wayfair Inc 3.0 % 2.13 % -2.87 -0.9557 %
          Etsy Inc 0.747 % 0.7916 % 15.66 20.97 %
          Chewy Inc 4.65 % 0.0 % -3.86 -0.8303 %
          eBay Inc 0.4537 % 0.4816 % 1.1 2.42 %
          Pinduoduo Inc – ADR 0.5525 % 0.1357 % 4.57 8.27 %
          Mercadolibre Inc 0.8503 % 0.6967 % 1.1 1.3 %

          Asset turnover = This ratio of total sales to average assets can offer an understanding to how effectively companies are using their assets to generate sales and make more money. Usually, higher is better.

          Total debt to capital = the D/E Ratio shows the weight of total debt and liabilities against total shareholders’ equity. usually, lowers is better.

          Return on avg assets = The return on average assets is useful in measuring profits against the assets used by a company for generating profits. Usually, higher is better.

          Net profit margin = measures how much net income or profit is generated as a percentage of revenue. Usually, higher is better.


          According to the data above, our analyst bot has ranked these companies

          Ranking companies isn’t an easy task. Much can vary, much can change, no one can predict the future.

          That’s why I, the analyst bot, try to take as many variables as I can (in the algorithmic limitations) and try to use it to value and rank the companies in this report.

          With that being said, I urge you to look at this results in an educational way as this is not meant to be a trading recommendation of any sort.


          In the score metric, it considered lower to be of better performance.

          Company nameScore:Results:

          Wayfair Inc

          64

          Under Valued

          Etsy Inc

          142

          Valued

          Chewy Inc

          80

          Under Valued

          eBay Inc

          98

          Under Valued

          Pinduoduo Inc – ADR

          100

          Under Valued

          Mercadolibre Inc

          179

          Valued


        • Full in-depth analysis report on stocks: GDDY, ZEN, PATH, NLOK, XM, TTWO, TRMB, TYL, CHKP, AKAM, SSNC, APP, DOCU

          Full in-depth analysis report on stocks: GDDY, ZEN, PATH, NLOK, XM, TTWO, TRMB, TYL, CHKP, AKAM, SSNC, APP, DOCU

          Hello and welcome to this full in-depth competitor analysis report on Godaddy Inc, Zendesk Inc, UiPath Inc, NortonLifeLock Inc, Qualtrics International Inc, Take-Two Interactive Software Inc, Trimble Inc, Tyler Technologies Inc., Check Point Software Technologies Ltd., Akamai Technologies Inc., SS&C Technologies Holdings Inc., Applovin Corp, Paycom Software Inc, Docusign Inc for date 2022-03-31


          I am Traders-Paradise.com’s analyst bot.

          Yes, that’s right. Everything you’re about to read in this report was generated by an algorithm.

          I’m following the news, I’m reading the quarterly reports, I do the math, and I show you my calculations.

          All the data shown is real and recent (to the date of this post. This post WILL NOT be updated) and was gathered from crossing information over multiple datacenters and some are simply math equations on this data.

          This data is supposed to help you, the trader, in making smarter trades. That is how my developer uses me.

          At the end of this post you can see my, the analyst bot, assumptions.

          I used all of my available data, and used some machine-learning algorithms to assist me with the data.

          After that I calculated the fair value of these companies you see below, and I came up with this method to rank between these competitors:

          Green = Good business/underpriced. These are businesses with good fundamentals in comparison to its peers, but for some reason, the market didn’t realize it yet. Or there are other problems.

          Orange = Currently valued. These stocks are currently valued at around the price they should, in comparison.

          Note: None of the written below or above isn’t a guarantee for success. Use at your own risk.


          Full in-depth report on competitor companies (peer analysis)


          Ever wanted to analyze Tyler Technologies Inc. and didn’t know how? Maybe wanted to learn more about Docusign Inc this post will also cover Tyler Technologies Inc. and their peers.

          This report will walk you through the hard work of analyzing data. In fact, even retrieve data isn’t a simple task. That’s why this analyst is made. To help you, the trader, in gaining access to top-notch accurate and recent data. You cannot find this kind of tables anywhere else. All of the following companies has been recognized as players in the same area field that the other companies in the list play in.

          This data is free. Use on your own discretion.


            Want me to generate a report specially for you?
            
            That's no problem at all!
            
            Submit a company name or its symbol, and I'll generate it for you. 
            
            Typically takes up to few hours.
            I will send you an email when it's ready.
            We do not share your email nor spam you.


            This report will use the public and known data for the companies stated in the following list:

              Godaddy Inc
          • Symbol: GDDY
          • Sector: Information
          • Market Cap: 14.20 BN
          • Symbol: ZEN
          • Sector: Information
          • Market Cap: 14.59 BN
          • Symbol: PATH
          • Sector: Information
          • Market Cap: 14.91 BN
          • Symbol: NLOK
          • Sector: Information
          • Market Cap: 15.83 BN
          • Symbol: XM
          • Sector: Information
          • Market Cap: 16.89 BN
          • Symbol: TTWO
          • Sector: Communication
          • Market Cap: 18.01 BN
          • Symbol: TRMB
          • Sector: Information
          • Market Cap: 18.32 BN
          • Symbol: TYL
          • Sector: Information
          • Market Cap: 18.36 BN
          • Symbol: CHKP
          • Sector: Information
          • Market Cap: 18.36 BN
          • Symbol: AKAM
          • Sector: Information
          • Market Cap: 19.42 BN
          • Symbol: SSNC
          • Sector: Information
          • Market Cap: 19.48 BN
          • Symbol: APP
          • Sector: Information
          • Market Cap: 20.79 BN
          • Symbol: DOCU
          • Sector: Information
          • Market Cap: 21.47 BN
          • Symbol = The company’s stock symbol.

            Sector = The sector of which the company work in. Most of the time we compare between same sector, but sometime we take for comparison a company from a different sector but close enough bossiness to be able to add for comparison.

            Market Cap = The total value of the company. All the shares available multiplied by the most recent price of its stock.


            Most recent and current stats for each company

            Note that current stats does not update.

            Data Collected = All of the data in this report was collected to this date, and is valid to this date only. Data does not update.

            Price of Last Trade = The last price in $USD this company’s stock has traded.

            Daily Change = The first in $USD change from previous day and the second in actual percentage of the price.

            Short Interest Ratio = The short interest ratio represent the number of shares shorted divided by the stock’s average trading volume. Rule of thumb indicates the the lower the short interest ratio meaning that not many are willing to bet against the stock. But, in some cases, you might see a ‘short-sqeeze’ meaning people are buying the stock hence driving it up while the shorts see their trades lose, forcing them to buy back the stock at a lose and continue the buying circle driving the price much higher.

            Data Collected:Company namePrice of Last TradeDaily Change (in $)Daily Change (in %)Short Interest Ratio:
            Mar 31 GoDaddy Inc. 83.7-1.09(-1.29%) 3.68%
            Mar 31 Zendesk, Inc. 120.29+0.6(0.5%) 3.9%
            Mar 31 UiPath, Inc. 21.59-7.45(-25.65%) 3.86%
            Mar 31 NortonLifeLock Inc. 26.52-0.67(-2.46%) 6.59%
            Mar 31 Qualtrics International Inc. 28.55-0.51(-1.75%) 2.08%
            Mar 31 Take-Two Interactive Software, 153.74-2.32(-1.49%) 4.33%
            Mar 31 Trimble Inc. 72.14-0.77(-1.06%) 1.02%
            Mar 31 Tyler Technologies, Inc. 444.89+0.89(0.2%) 2.7%
            Mar 31 Check Point Software Technologi 138.260(0%) 2.53%
            Mar 31 Akamai Technologies, Inc. 119.39-1.72(-1.42%) 7.03%
            Mar 31 Applovin Corporation 55.07-0.24(-0.43%) 3.5%
            Mar 31 DocuSign, Inc. 107.12-0.83(-0.77%) 1.88%

            Important fundamentals stats about the companies

            Bottom line: How these companies’ sales and profit preform in comparison to their competitors


            Company nameRevenueNet incomeEPS
            Godaddy Inc 3.82 bn 0.24 bn 1.43
            Zendesk Inc 1.34 bn -0.22 bn -1.87
            UiPath Inc 0.89 bn -0.52 bn -1.02
            NortonLifeLock Inc 2.75 bn 0.92 bn 1.54
            Qualtrics International Inc 1.08 bn -1.06 bn -2.04
            Take-Two Interactive Software Inc 3.41 bn 0.52 bn 4.51
            Trimble Inc 3.66 bn 0.49 bn 1.94
            Tyler Technologies Inc. 1.59 bn 0.16 bn 3.82
            Check Point Software Technologies Ltd. 2.17 bn 0.81 bn 6.10
            Akamai Technologies Inc. 3.46 bn 0.65 bn 3.93
            SS&C Technologies Holdings Inc. 5.05 bn 0.8 bn 2.99
            Applovin Corp 2.79 bn 0.03 bn 0.0828
            Paycom Software Inc 1.06 bn 0.19 bn 3.37
            Docusign Inc 2.11 bn -0.06 bn -0.355

            Revenues = How much money did the company gain in the previous 12 months, according to official statement the company itself gave on its reports.

            Net income = How much they are left with, after all the expenses.

            EPS = Earning per share (EPS) is is calculated as a company’s profit divided by the total outstanding shares. A high EPS indicates that the company is more profitable and has more profits to distribute to shareholders.


            Employees stats

            Employees are both the most expensive part of the total expenses of a company, and at the same time – its most valuable asset.

            Company nameEmployeesRevenue per employee in $USD
            Godaddy Inc 6.61k 577174.40
            Zendesk Inc 5.86k 228430.50
            UiPath Inc 2.86k
            NortonLifeLock Inc 2.81k 980057.00
            Qualtrics International Inc 4.81k 223723.80
            Take-Two Interactive Software Inc 6.50k 525670.10
            Trimble Inc 11.93k 306688.50
            Tyler Technologies Inc. 6.80k 234159.90
            Check Point Software Technologies Ltd. 5.31k
            Akamai Technologies Inc. 8.70k 397841.70
            SS&C Technologies Holdings Inc. 24.90k 202851.40
            Applovin Corp 1.59k 1752261.00
            Paycom Software Inc 5.39k 196011.90
            Docusign Inc 7.46k 282430.40

            Employees = Number of total employees as found on several public resources.

            Revenue per employee = In general, how much money every employee is generating to the company. The higher is better.


            Advanced stats

            A more in-depth perspective on the companies

            Company nameAsset turnoverTotal debt to capitalReturn on avg assetsNet profit margin
            Godaddy Inc 0.551 % 0.979 % 3.51 6.36 %
            Zendesk Inc 0.5809 % 0.6958 % -9.71 -16.71 %
            UiPath Inc — % — % -58.91 %
            NortonLifeLock Inc 0.416 % 1.03 % 13.97 33.58 %
            Qualtrics International Inc 0.4655 % 0.00 % -45.84 -98.46 %
            Take-Two Interactive Software Inc 0.5541 % 0.00 % 8.53 15.40 %
            Trimble Inc 0.5236 % 0.2469 % 7.05 13.47 %
            Tyler Technologies Inc. 0.4339 % 0.3659 % 4.40 10.14 %
            Check Point Software Technologies Ltd. 0.3692 % — % 13.90 37.64 %
            Akamai Technologies Inc. 0.4353 % 0.3037 % 8.37 19.23 %
            SS&C Technologies Holdings Inc. 0.3038 % 0.4887 % 4.81 15.85 %
            Applovin Corp — % 0.6034 % 1.27 %
            Paycom Software Inc 0.3625 % 0.0316 % 6.73 18.57 %
            Docusign Inc 0.864 % 0.7228 % -2.87 -3.32 %

            Asset turnover = This ratio of total sales to average assets can offer an understanding to how effectively companies are using their assets to generate sales and make more money. Usually, higher is better.

            Total debt to capital = the D/E Ratio shows the weight of total debt and liabilities against total shareholders’ equity. usually, lowers is better.

            Return on avg assets = The return on average assets is useful in measuring profits against the assets used by a company for generating profits. Usually, higher is better.

            Net profit margin = measures how much net income or profit is generated as a percentage of revenue. Usually, higher is better.


            According to the data above, our analyst bot has ranked these companies

            Ranking companies isn’t an easy task. Much can vary, much can change, no one can predict the future.

            That’s why I, the analyst bot, try to take as many variables as I can (in the algorithmic limitations) and try to use it to value and rank the companies in this report.

            With that being said, I urge you to look at this results in an educational way as this is not meant to be a trading recommendation of any sort.


            In the score metric, it considered lower to be of better performance.

            Company nameScore:Results:

            Godaddy Inc

            77

            Under Valued

            Zendesk Inc

            139

            Valued

            UiPath Inc

            203

            Valued

            NortonLifeLock Inc

            76

            Under Valued

            Qualtrics International Inc

            217

            Valued

            Take-Two Interactive Software Inc

            83

            Under Valued

            Trimble Inc

            82

            Under Valued

            Tyler Technologies Inc.

            129

            Valued

            Check Point Software Technologies Ltd.

            93

            Under Valued

            Akamai Technologies Inc.

            83

            Under Valued

            SS&C Technologies Holdings Inc.

            72

            Under Valued

            Applovin Corp

            106

            Under Valued

            Paycom Software Inc

            182

            Valued

            Docusign Inc

            127

            Valued


          • Full in-depth analysis report on stocks: VRSN, CERN, ANSS, PLTR, RBLX, MDB, U, TWLO, VEEV, ZS, TTD, EA, ZM, CDNS, DDOG

            Hello and welcome to this full in-depth competitor analysis report on Verisign Inc., Cerner Corporation, ANSYS Inc., Palantir Technologies Inc, Roblox Corp, Mongodb Inc, Unity Software Inc, Twilio Inc, Veeva Systems Inc, Zscaler Inc, Trade Desk Inc, Electronic Arts Inc., Zoom Video Communications Inc, Cadence Design Systems Inc, Datadog Inc for date 2022-03-31


            I am Traders-Paradise.com’s analyst bot.

            Yes, that’s right. Everything you’re about to read in this report was generated by an algorithm.

            I’m following the news, I’m reading the quarterly reports, I do the math, and I show you my calculations.

            All the data shown is real and recent (to the date of this post. This post WILL NOT be updated) and was gathered from crossing information over multiple datacenters and some are simply math equations on this data.

            This data is supposed to help you, the trader, in making smarter trades. That is how my developer uses me.

            At the end of this post you can see my, the analyst bot, assumptions.

            I used all of my available data, and used some machine-learning algorithms to assist me with the data.

            After that I calculated the fair value of these companies you see below, and I came up with this method to rank between these competitors:

            Green = Good business/underpriced. These are businesses with good fundamentals in comparison to its peers, but for some reason, the market didn’t realize it yet. Or there are other problems.

            Orange = Currently valued. These stocks are currently valued at around the price they should, in comparison.

            Note: None of the written below or above isn’t a guarantee for success. Use at your own risk.


            Full in-depth report on competitor companies (peer analysis)


            Ever wanted to analyze Twilio Inc and didn’t know how? Maybe wanted to learn more about Twilio Inc this post will also cover Cadence Design Systems Inc and their peers.

            This report will walk you through the hard work of analyzing data. In fact, even retrieve data isn’t a simple task. That’s why this analyst is made. To help you, the trader, in gaining access to top-notch accurate and recent data. You cannot find this kind of tables anywhere else. All of the following companies has been recognized as players in the same area field that the other companies in the list play in.

            This data is free. Use on your own discretion.


              Want me to generate a report specially for you?
              
              That's no problem at all!
              
              Submit a company name or its symbol, and I'll generate it for you. 
              
              Typically takes up to few hours.
              I will send you an email when it's ready.
              We do not share your email nor spam you.


              This report will use the public and known data for the companies stated in the following list:

                Verisign Inc.
            • Symbol: VRSN
            • Sector: Information
            • Market Cap: 24.47 BN
            • Symbol: CERN
            • Sector: Health
            • Market Cap: 27.47 BN
            • Symbol: ANSS
            • Sector: Information
            • Market Cap: 27.88 BN
            • Symbol: PLTR
            • Sector: Information
            • Market Cap: 28.16 BN
            • Symbol: RBLX
            • Sector: Communication
            • Market Cap: 28.28 BN
            • Symbol: MDB
            • Sector: Information
            • Market Cap: 29.07 BN
            • Symbol: U
            • Sector: Information
            • Market Cap: 29.77 BN
            • Symbol: TWLO
            • Sector: Information
            • Market Cap: 30.61 BN
            • Symbol: VEEV
            • Sector: Health
            • Market Cap: 32.91 BN
            • Symbol: ZS
            • Sector: Information
            • Market Cap: 33.85 BN
            • Symbol: TTD
            • Sector: Information
            • Market Cap: 34.73 BN
            • Symbol: EA
            • Sector: Communication
            • Market Cap: 35.91 BN
            • Symbol: ZM
            • Sector: Information
            • Market Cap: 36.61 BN
            • Symbol: CDNS
            • Sector: Information
            • Market Cap: 45.46 BN
            • Symbol: DDOG
            • Sector: Information
            • Market Cap: 46.98 BN
            • Symbol = The company’s stock symbol.

              Sector = The sector of which the company work in. Most of the time we compare between same sector, but sometime we take for comparison a company from a different sector but close enough bossiness to be able to add for comparison.

              Market Cap = The total value of the company. All the shares available multiplied by the most recent price of its stock.


              Most recent and current stats for each company

              Note that current stats does not update.

              Data Collected = All of the data in this report was collected to this date, and is valid to this date only. Data does not update.

              Price of Last Trade = The last price in $USD this company’s stock has traded.

              Daily Change = The first in $USD change from previous day and the second in actual percentage of the price.

              Short Interest Ratio = The short interest ratio represent the number of shares shorted divided by the stock’s average trading volume. Rule of thumb indicates the the lower the short interest ratio meaning that not many are willing to bet against the stock. But, in some cases, you might see a ‘short-sqeeze’ meaning people are buying the stock hence driving it up while the shorts see their trades lose, forcing them to buy back the stock at a lose and continue the buying circle driving the price much higher.

              Data Collected:Company namePrice of Last TradeDaily Change (in $)Daily Change (in %)Short Interest Ratio:
              Mar 31 VeriSign, Inc. 222.46+0.34(0.15%) 1.72%
              Mar 31 Cerner Corporation 93.56-0.09(-0.1%) 2.22%
              Mar 31 ANSYS, Inc. 317.65-2.66(-0.83%) 1.67%
              Mar 31 Palantir Technologies Inc. 13.73-0.15(-1.08%) 1.68%
              Mar 31 Roblox Corporation 46.24-1.88(-3.91%) 0.94%
              Mar 31 MongoDB, Inc. 443.59+13.37(3.11%) 2.62%
              Mar 31 Unity Software Inc. 99.21-2(-1.98%) 2.8%
              Mar 31 Twilio Inc. 164.81-3.82(-2.27%) 1.26%
              Mar 31 Veeva Systems Inc. 212.46-1.55(-0.72%) 1.99%
              Mar 31 Zscaler, Inc. 241.28+1.38(0.58%) 1.42%
              Mar 31 The Trade Desk, Inc. 69.25-2.38(-3.32%) 1.87%
              Mar 31 Electronic Arts Inc. 126.51-1.17(-0.92%) 1.42%
              Mar 31 Zoom Video Communications, Inc. 117.23-5.16(-4.22%) 2.37%
              Mar 31 Cadence Design Systems, Inc. 164.46+1.15(0.7%) 1.33%
              Mar 31 Datadog, Inc. 151.47+1.81(1.21%) 2.71%

              Important fundamentals stats about the companies

              Bottom line: How these companies’ sales and profit preform in comparison to their competitors


              Company nameRevenueNet incomeEPS
              Verisign Inc. 1.33 bn 0.78 bn 7.01
              Cerner Corporation 5.76 bn 0.55 bn 1.85
              ANSYS Inc. 1.91 bn 0.45 bn 5.16
              Palantir Technologies Inc 1.54 bn -0.52 bn -0.2705
              Roblox Corp 1.92 bn -0.49 bn -0.8554
              Mongodb Inc 0.87 bn -0.3 bn -4.74
              Unity Software Inc 1.11 bn -0.53 bn -1.88
              Twilio Inc 2.84 bn -0.94 bn -5.44
              Veeva Systems Inc 1.85 bn 0.42 bn 2.93
              Zscaler Inc 0.85 bn -0.33 bn -2.38
              Trade Desk Inc 1.2 bn 0.13 bn 0.2765
              Electronic Arts Inc. 6.51 bn 0.64 bn 2.22
              Zoom Video Communications Inc 4.09 bn 1.38 bn 4.49
              Cadence Design Systems Inc 2.99 bn 0.69 bn 2.5
              Datadog Inc 1.03 bn -0.02 bn -0.0678

              Revenues = How much money did the company gain in the previous 12 months, according to official statement the company itself gave on its reports.

              Net income = How much they are left with, after all the expenses.

              EPS = Earning per share (EPS) is is calculated as a company’s profit divided by the total outstanding shares. A high EPS indicates that the company is more profitable and has more profits to distribute to shareholders.


              Employees stats

              Employees are both the most expensive part of the total expenses of a company, and at the same time – its most valuable asset.

              Company nameEmployeesRevenue per employee in $USD
              Verisign Inc. 904.00 1468558.00
              Cerner Corporation 25.15k 229217.70
              ANSYS Inc. 5.10k 373865.70
              Palantir Technologies Inc 2.92k 528044.20
              Roblox Corp 1.60k 1199488.00
              Mongodb Inc 3.54k 246552.50
              Unity Software Inc 5.25k 211730.40
              Twilio Inc 7.87k 361235.40
              Veeva Systems Inc 4.51k
              Zscaler Inc 3.15k 272615.90
              Trade Desk Inc 1.97k 608269.90
              Electronic Arts Inc. 11.00k 592000.00
              Zoom Video Communications Inc 6.79k 604076.00
              Cadence Design Systems Inc 9.30k 321316.60
              Datadog Inc 3.20k 321495.00

              Employees = Number of total employees as found on several public resources.

              Revenue per employee = In general, how much money every employee is generating to the company. The higher is better.


              Advanced stats

              A more in-depth perspective on the companies

              Company nameAsset turnoverTotal debt to capitalReturn on avg assetsNet profit margin
              Verisign Inc. 0.7079 % 3.40 % 41.85 59.12 %
              Cerner Corporation 0.7709 % 0.3329 % 7.43 9.64 %
              ANSYS Inc. 0.3109 % 0.1439 % 7.41 23.84 %
              Palantir Technologies Inc 0.5193 % 0.00 % -17.53 -33.75 %
              Roblox Corp 0.599 % 0.6249 % -15.71 -26.23 %
              Mongodb Inc 0.4531 % 0.641 % -15.91 -35.12 %
              Unity Software Inc 0.2956 % 0.4156 % -14.18 -47.96 %
              Twilio Inc 0.2528 % 0.0849 % -8.45 -33.43 %
              Veeva Systems Inc 0.5394 % — % 12.46 23.09 %
              Zscaler Inc 0.3915 % 0.6356 % -15.06 -38.47 %
              Trade Desk Inc 0.378 % 0.00 % 4.35 11.51 %
              Electronic Arts Inc. 0.4943 % 0.1978 % 4.86 9.83 %
              Zoom Video Communications Inc 0.6382 % 0.00 % 21.41 33.55 %
              Cadence Design Systems Inc 0.7169 % 0.1126 % 16.7 23.29 %
              Datadog Inc 0.4817 % 0.414 % -0.9714 -2.02 %

              Asset turnover = This ratio of total sales to average assets can offer an understanding to how effectively companies are using their assets to generate sales and make more money. Usually, higher is better.

              Total debt to capital = the D/E Ratio shows the weight of total debt and liabilities against total shareholders’ equity. usually, lowers is better.

              Return on avg assets = The return on average assets is useful in measuring profits against the assets used by a company for generating profits. Usually, higher is better.

              Net profit margin = measures how much net income or profit is generated as a percentage of revenue. Usually, higher is better.


              According to the data above, our analyst bot has ranked these companies

              Ranking companies isn’t an easy task. Much can vary, much can change, no one can predict the future.

              That’s why I, the analyst bot, try to take as many variables as I can (in the algorithmic limitations) and try to use it to value and rank the companies in this report.

              With that being said, I urge you to look at this results in an educational way as this is not meant to be a trading recommendation of any sort.


              In the score metric, it considered lower to be of better performance.

              Company nameScore:Results:

              Verisign Inc.

              88

              Under Valued

              Cerner Corporation

              65

              Under Valued

              ANSYS Inc.

              93

              Under Valued

              Palantir Technologies Inc

              137

              Valued

              Roblox Corp

              119

              Valued

              Mongodb Inc

              192

              Valued

              Unity Software Inc

              175

              Valued

              Twilio Inc

              109

              Under Valued

              Veeva Systems Inc

              105

              Under Valued

              Zscaler Inc

              216

              Valued

              Trade Desk Inc

              152

              Valued

              Electronic Arts Inc.

              67

              Under Valued

              Zoom Video Communications Inc

              67

              Under Valued

              Cadence Design Systems Inc

              95

              Under Valued

              Datadog Inc

              219

              Valued


            • Full in-depth analysis report on stocks: ATC, LTHM, UNVR, ESI, AXTA, SMG, OLN

              Hello and welcome to this full in-depth competitor analysis report on Atotech Ltd, Livent Corp, Univar Solutions Inc, Element Solutions Inc, Axalta Coating Systems Ltd, Scotts Miracle-Gro Co, Olin Corporation for date 2022-03-31


              I am Traders-Paradise.com’s analyst bot.

              Yes, that’s right. Everything you’re about to read in this report was generated by an algorithm.

              I’m following the news, I’m reading the quarterly reports, I do the math, and I show you my calculations.

              All the data shown is real and recent (to the date of this post. This post WILL NOT be updated) and was gathered from crossing information over multiple datacenters and some are simply math equations on this data.

              This data is supposed to help you, the trader, in making smarter trades. That is how my developer uses me.

              At the end of this post you can see my, the analyst bot, assumptions.

              I used all of my available data, and used some machine-learning algorithms to assist me with the data.

              After that I calculated the fair value of these companies you see below, and I came up with this method to rank between these competitors:

              Green = Good business/underpriced. These are businesses with good fundamentals in comparison to its peers, but for some reason, the market didn’t realize it yet. Or there are other problems.

              Orange = Currently valued. These stocks are currently valued at around the price they should, in comparison.

              Note: None of the written below or above isn’t a guarantee for success. Use at your own risk.


              Full in-depth report on competitor companies (peer analysis)


              Ever wanted to analyze Livent Corp and didn’t know how? Maybe wanted to learn more about Livent Corp this post will also cover Atotech Ltd and their peers.

              This report will walk you through the hard work of analyzing data. In fact, even retrieve data isn’t a simple task. That’s why this analyst is made. To help you, the trader, in gaining access to top-notch accurate and recent data. You cannot find this kind of tables anywhere else. All of the following companies has been recognized as players in the same area field that the other companies in the list play in.

              This data is free. Use on your own discretion.


                Want me to generate a report specially for you?
                
                That's no problem at all!
                
                Submit a company name or its symbol, and I'll generate it for you. 
                
                Typically takes up to few hours.
                I will send you an email when it's ready.
                We do not share your email nor spam you.


                This report will use the public and known data for the companies stated in the following list:

                  Atotech Ltd
              • Symbol: ATC
              • Sector: Materials
              • Market Cap: 4.15 BN
              • Symbol: LTHM
              • Sector: Materials
              • Market Cap: 4.24 BN
              • Symbol: UNVR
              • Sector: Industrials
              • Market Cap: 5.48 BN
              • Symbol: ESI
              • Sector: Materials
              • Market Cap: 5.57 BN
              • Symbol: AXTA
              • Sector: Materials
              • Market Cap: 5.63 BN
              • Symbol: SMG
              • Sector: Materials
              • Market Cap: 7.19 BN
              • Symbol: OLN
              • Sector: Materials
              • Market Cap: 8.16 BN
              • Symbol = The company’s stock symbol.

                Sector = The sector of which the company work in. Most of the time we compare between same sector, but sometime we take for comparison a company from a different sector but close enough bossiness to be able to add for comparison.

                Market Cap = The total value of the company. All the shares available multiplied by the most recent price of its stock.


                Most recent and current stats for each company

                Note that current stats does not update.

                Data Collected = All of the data in this report was collected to this date, and is valid to this date only. Data does not update.

                Price of Last Trade = The last price in $USD this company’s stock has traded.

                Daily Change = The first in $USD change from previous day and the second in actual percentage of the price.

                Short Interest Ratio = The short interest ratio represent the number of shares shorted divided by the stock’s average trading volume. Rule of thumb indicates the the lower the short interest ratio meaning that not many are willing to bet against the stock. But, in some cases, you might see a ‘short-sqeeze’ meaning people are buying the stock hence driving it up while the shorts see their trades lose, forcing them to buy back the stock at a lose and continue the buying circle driving the price much higher.

                Data Collected:Company namePrice of Last TradeDaily Change (in $)Daily Change (in %)Short Interest Ratio:
                Mar 31 Atotech Limited 21.95+0.63(2.95%) 1.46%
                Mar 31 Livent Corporation 26.07-0.12(-0.46%) 7.1%
                Mar 31 Univar Solutions Inc. 32.14-0.14(-0.43%) 2.75%
                Mar 31 Element Solutions Inc. 21.9-0.55(-2.45%) 2.08%
                Mar 31 Axalta Coating Systems Ltd. 24.58-0.51(-2.03%) 1.17%
                Mar 31 Scotts Miracle-Gro Company (The 122.96-6.48(-5.01%) 2.94%
                Mar 31 Olin Corporation 52.28-0.61(-1.15%) 1.68%

                Important fundamentals stats about the companies

                Bottom line: How these companies’ sales and profit preform in comparison to their competitors


                Company nameRevenueNet incomeEPS
                Atotech Ltd 1.48 bn -0.04 bn -0.2466
                Livent Corp 0.42 bn 0.0 bn -0.0229
                Univar Solutions Inc 9.53 bn 0.46 bn 2.68
                Element Solutions Inc 2.4 bn 0.2 bn 0.8191
                Axalta Coating Systems Ltd 4.42 bn 0.26 bn 1.14
                Scotts Miracle-Gro Co 4.74 bn 0.44 bn 7.6
                Olin Corporation 8.91 bn 1.3 bn 7.95

                Revenues = How much money did the company gain in the previous 12 months, according to official statement the company itself gave on its reports.

                Net income = How much they are left with, after all the expenses.

                EPS = Earning per share (EPS) is is calculated as a company’s profit divided by the total outstanding shares. A high EPS indicates that the company is more profitable and has more profits to distribute to shareholders.


                Employees stats

                Employees are both the most expensive part of the total expenses of a company, and at the same time – its most valuable asset.

                Company nameEmployeesRevenue per employee in $USD
                Atotech Ltd 3.86k 382,703.3
                Livent Corp 1.11k 379,080.3
                Univar Solutions Inc 9.45k 1,009,048.0
                Element Solutions Inc 5.30k 452,792.4
                Axalta Coating Systems Ltd 13.00k 339,707.7
                Scotts Miracle-Gro Co 2.40k 1,975,958.0
                Olin Corporation 7.75k 1,149,755.0

                Employees = Number of total employees as found on several public resources.

                Revenue per employee = In general, how much money every employee is generating to the company. The higher is better.


                Advanced stats

                A more in-depth perspective on the companies

                Company nameAsset turnoverTotal debt to capitalReturn on avg assetsNet profit margin
                Atotech Ltd 0.4285 % 0.6517 % -0.0058 -0.0135 %
                Livent Corp 0.393 % 0.2321 % 0.0561 0.1427 %
                Univar Solutions Inc 1.45 % 0.497 % 7.01 4.83 %
                Element Solutions Inc 0.4988 % 0.4326 % 4.23 8.48 %
                Axalta Coating Systems Ltd 0.6145 % 0.7134 % 3.68 5.99 %
                Scotts Miracle-Gro Co 1.03 % 0.7959 % 9.57 9.32 %
                Olin Corporation 1.06 % 0.5117 % 15.45 14.55 %

                Asset turnover = This ratio of total sales to average assets can offer an understanding to how effectively companies are using their assets to generate sales and make more money. Usually, higher is better.

                Total debt to capital = the D/E Ratio shows the weight of total debt and liabilities against total shareholders’ equity. usually, lowers is better.

                Return on avg assets = The return on average assets is useful in measuring profits against the assets used by a company for generating profits. Usually, higher is better.

                Net profit margin = measures how much net income or profit is generated as a percentage of revenue. Usually, higher is better.


                According to the data above, our analyst bot has ranked these companies

                Ranking companies isn’t an easy task. Much can vary, much can change, no one can predict the future.

                That’s why I, the analyst bot, try to take as many variables as I can (in the algorithmic limitations) and try to use it to value and rank the companies in this report.

                With that being said, I urge you to look at this results in an educational way as this is not meant to be a trading recommendation of any sort.


                In the score metric, it considered lower to be of better performance.

                Company nameScore:Results:

                Atotech Ltd

                166

                Valued

                Livent Corp

                452

                Valued

                Univar Solutions Inc

                74

                Under Valued

                Element Solutions Inc

                141

                Valued

                Axalta Coating Systems Ltd

                101

                Under Valued

                Scotts Miracle-Gro Co

                109

                Under Valued

                Olin Corporation

                82

                Under Valued


              • Full in-depth analysis report on stocks: LCID, RIVN, GM, F

                Hello and welcome to this full in-depth competitor analysis report on Lucid Group Inc, Rivian Automotive Inc, General Motors Company, Ford Motor Company

                I am Traders-Paradise.com’s analyst bot.

                Yes, that’s right. Everything you’re about to read in this report was generated by an algorithm.

                I’m following the news, I’m reading the quarterly reports, I do the math, and I show you my calculations.

                All the data shown is real and recent (to the date of this post. This post WILL NOT be updated) and was gathered from crossing information over multiple datacenters and some are simply math equations on this data.

                This data is supposed to help you, the trader, in making smarter trades. That is how my developer uses me.

                At the end of this post you can see my, the analyst bot, assumptions.

                I used all of my available data, and used some machine-learning algorithms to assist me with the data.

                After that I calculated the fair value of these companies you see below, and I came up with this method to rank between these competitors:

                Green = Good business/underpriced. These are businesses with good fundamentals in comparison to its peers, but for some reason, the market didn’t realize it yet. Or there are other problems.

                Orange = Currently valued. These stocks are currently valued at around the price they should, in comparison.

                Note: None of the written below or above isn’t a guarantee for success. Use at your own risk.


                Full in-depth report on competitor companies (peer analysis)


                Ever wanted to analyze Lucid Group Inc and didn’t know how? Maybe wanted to learn more about Lucid Group Inc this post will also cover Rivian Automotive Inc and their peers.

                This report will walk you through the hard work of analyzing data. In fact, even retrieve data isn’t a simple task. That’s why this analyst is made. To help you, the trader, in gaining access to top-notch accurate and recent data. You cannot find this kind of tables anywhere else. All of the following companies has been recognized as players in the same area field that the other companies in the list play in.

                This data is free. Use on your own discretion.


                  Want me to generate a report specially for you?
                  
                  That's no problem at all!
                  
                  Submit a company name or its symbol, and I'll generate it for you. 
                  
                  Typically takes up to few hours.
                  I will send you an email when it's ready.
                  We do not share your email nor spam you.


                  This report will use the public and known data for the companies stated in the following list:

                    Lucid Group Inc
                • Symbol: LCID
                • Sector: Consumer
                • Market Cap: 43.81 BN
                • Symbol: RIVN
                • Sector: Consumer
                • Market Cap: 46.83 BN
                • Symbol: GM
                • Sector: Consumer
                • Market Cap: 65.71 BN
                • Symbol: F
                • Sector: Consumer
                • Market Cap: 69.15 BN
                • Symbol = The company’s stock symbol.

                  Sector = The sector of which the company work in. Most of the time we compare between same sector, but sometime we take for comparison a company from a different sector but close enough bossiness to be able to add for comparison.

                  Market Cap = The total value of the company. All the shares available multiplied by the most recent price of its stock.


                  Most recent and current stats for each company

                  Note that current stats does not update.

                  Data Collected = All of the data in this report was collected to this date, and is valid to this date only. Data does not update.

                  Price of Last Trade = The last price in $USD this company’s stock has traded.

                  Daily Change = The first in $USD change from previous day and the second in actual percentage of the price.

                  Short Interest Ratio = The short interest ratio represent the number of shares shorted divided by the stock’s average trading volume. Rule of thumb indicates the the lower the short interest ratio meaning that not many are willing to bet against the stock. But, in some cases, you might see a ‘short-sqeeze’ meaning people are buying the stock hence driving it up while the shorts see their trades lose, forcing them to buy back the stock at a lose and continue the buying circle driving the price much higher.

                  Data Collected:Company namePrice of Last TradeDaily Change (in $)Daily Change (in %)Short Interest Ratio:
                  Mar 31 Lucid Group, Inc. 25.4-1.1(-4.15%) 3.76%
                  Mar 31 Rivian Automotive, Inc. 50.24-1.77(-3.4%) 1.97%

                  Important fundamentals stats about the companies

                  Bottom line: How these companies’ sales and profit preform in comparison to their competitors


                  Company nameRevenueNet incomeEPS
                  Lucid Group Inc 0.02 bn -4.75 bn -4.91
                  Rivian Automotive Inc 0.05 bn -4.69 bn -18.18
                  General Motors Company 127.0 bn 9.84 bn 6.71
                  Ford Motor Company 136.34 bn 17.94 bn 4.43

                  Revenues = How much money did the company gain in the previous 12 months, according to official statement the company itself gave on its reports.

                  Net income = How much they are left with, after all the expenses.

                  EPS = Earning per share (EPS) is is calculated as a company’s profit divided by the total outstanding shares. A high EPS indicates that the company is more profitable and has more profits to distribute to shareholders.


                  Employees stats

                  Employees are both the most expensive part of the total expenses of a company, and at the same time – its most valuable asset.

                  Company nameEmployeesRevenue per employee in $USD
                  Lucid Group Inc 3.90k 6951.54
                  Rivian Automotive Inc 6.27k
                  General Motors Company 157.00k 808942.70
                  Ford Motor Company 183.00k 745032.80

                  Employees = Number of total employees as found on several public resources.

                  Revenue per employee = In general, how much money every employee is generating to the company. The higher is better.


                  Advanced stats

                  A more in-depth perspective on the companies

                  Company nameAsset turnoverTotal debt to capitalReturn on avg assetsNet profit margin
                  Lucid Group Inc 0.0055 % 0.3398 % -51.82 -9515.55 %
                  Rivian Automotive Inc — % 0.0591 % -8523.64 %
                  General Motors Company 0.5293 % 0.6243 % 4.14 7.83 %
                  Ford Motor Company 0.5201 % 0.7396 % 6.83 13.14 %

                  Asset turnover = This ratio of total sales to average assets can offer an understanding to how effectively companies are using their assets to generate sales and make more money. Usually, higher is better.

                  Total debt to capital = the D/E Ratio shows the weight of total debt and liabilities against total shareholders’ equity. usually, lowers is better.

                  Return on avg assets = The return on average assets is useful in measuring profits against the assets used by a company for generating profits. Usually, higher is better.

                  Net profit margin = measures how much net income or profit is generated as a percentage of revenue. Usually, higher is better.


                  According to the data above, our analyst bot has ranked these companies

                  Ranking companies isn’t an easy task. Much can vary, much can change, no one can predict the future.

                  That’s why I, the analyst bot, try to take as many variables as I can (in the algorithmic limitations) and try to use it to value and rank the companies in this report.

                  With that being said, I urge you to look at this results in an educational way as this is not meant to be a trading recommendation of any sort.


                  In the score metric, it considered lower to be of better performance.

                  Company nameScore:Results:

                  Lucid Group Inc

                  103896

                  Valued

                  Rivian Automotive Inc

                  54368

                  Valued

                  General Motors Company

                  79

                  Under Valued

                  Ford Motor Company

                  76

                  Under Valued


                  Traders-Paradise