
Growth investing strategy can be a great way to get high returns, but the key is to understand what growth stocks are. Your time horizon and risk tolerance are major factors.
This is all about the growth stock investing strategy. It is the art of science implemented in investing. Investing requires significant research. But to create the growth stock investing strategy you’ll need a really good understanding and knowledge about growth stocks and underlying business.
Why did we say it is the art of science?
Well, buying a stock is the art itself. Growth stocks are elite stocks because they are what could make a lot of money for you. So, you will need a great growth stock investing strategy to ensure the great gains they are able to provide. Growth stock’s value can be boosted and some careless traders could be faced with its decreased price with no warnings. To avoid losses you’ll need a stable growth stock investing strategy.
What is growth stock investing strategy?
Growth stocks are a popular investment. The reason is quite clear: If some investors can make money by investing in them, why shouldn’t you? But if you want that, you’ll need knowledge, system, growth stock investing strategy to know when and how to react when the right time comes.
To recognize the right time for investing in the growth stocks the essential part is to know when some company can grow. It could happen due to organic growth, expansion, and in case of an acquisition. But keep in mind, not all growth is a good one.
Let’s make clear all of these cases of growth.
When the company improves its operations and capabilities from year to year we can talk about organic growth. But organic growth can shift negative if circumstances change. So, since it is changeable it is still good but not the best growth.
The growth caused by the expansion of the company means the company is reinvesting. It is actually expanding its operations. For example, the company may invest in its equipment, facilities, new branches, etc. As a result, you’ll notice low or no EPS and a high debt ratio. Sometimes both are visible. Of course, you can ignore low EPS if it is caused due to the company’s development and you see the company is reinvesting.
We are talking about acquisition and growth caused by that when one company buys the other one. For example, two companies have had a problem with organic and expansionary growth for many years. To solve the problem they bought smaller companies to increase revenue and earnings. This type of growth is very good for dividend investors.
But is it good for growth stock investors? We are afraid it isn’t. Growth stock investors prefer expansionary growth. That may give them high returns. That is exactly happening, for example, with companies that started as small but with the potential to expand a big.
How to develop a growth stock investing strategy
Growth investing is an investment strategy directed on capital appreciation. Investors who implement this style are recognized as growth investors. But how to get in the race? How to know when is the right time? For that, you’ll need a growth stock investing strategy.
First of all, you have to be able to make a difference between the normal market and the situation when the market is not normal. The worst growth stock investing strategy is to jump into the market and make a mess and losses. You will need time to build knowledge when the market is normal. Hence, you’ll need the practice to know when the market is normal to be able to recognize when it isn’t.
Why is it so important to know when the market isn’t normal? What are you supposed to do in the markets that are not normal? This part may sound like nonsense but the periods when the markets are not normal are the best time to buy or sell stocks. That’s all wisdom.
So, you have to maintain your trading journal. That may include everything you read and learn about investing and trading. For example, you can follow economic data for determined periods. No matter if they are weeks or months. Also, your journal should include the market’s movements and investment decisions.
Do it effortlessly. You have to know what’s happening in the market, you need to watch how the stocks on your watchlists are performing.
That will arm you against the emotional risks of trading and making bad trades. Also, that will give you a chance to build an objective, repeatable trading strategy, so your portfolio will perform better.
You have to understand how the market movements are driven. For example, the market movements are handled by fundamental conditions which are long term, economics which is midterm but also the news which is short term. Economic and fundamental conditions are crucial for growth stocks. What do you mean, how the company can grow if the fundamental or economic conditions are against its progress? It’s impossible.
How to select stock for growth investing
Choosing stocks is not the way you may become rich. That is a mistake and don’t fall into that. You are not just picking a stock, you are choosing it after you estimate it well. In other words, you have to be familiar with stock. So, that to say, choosing stock is a very good way to obtain more education. When you get good knowledge about the market, you’ll be in harmony with the market.
Being in harmony with the market will provide you to know when is the right time to enter or exit the position. With this fine-tuned sense of market movements, you will know why the market is doing what it is doing, why it is better to buy or sell, why some stock is going up or dropping down.
While you are picking stocks, you are actually creating your watch list. Of course, you’ll add only the stocks you are interested in, meaning they meet your investment criteria.
Making a watch list can improve your growth stock investing strategy. Selected stocks are what you want to know more about, nothing else matters.
Of course, it is absolutely okay if you have more than one watch list. You can create it depending on types of stocks, investing style, etc. Also, you can find growth stocks in almost every industry or sector, so you can make a watch list for each sector, for instance, and update them after the earnings cycles end.
Indicators important for growth stock investing strategy
That to say, it is always better to follow the trend, not the other investors. Sometimes you’ll need to be patient with your watch list and pay attention constantly. You have to follow the prices’ changes, also the news, and to wait. Always keep in mind that growth stocks are impressive and exciting. Media makes a big noise sometimes about growth companies publishing good information and avoiding bad. That could lead to the stock’s price to rise because the fresh money is coming. But try to avoid following the masses. If you follow the crowd you will never get a favorable price.
Wait for the right time to pull the trigger. Sometimes the hardest part of growth stock investing is to recognize when it is the right time to buy. During hype, the prices will go up. But everything will be changed when bad news is on the scene. They will cause the stock price to go down.
The growth stocks are flying higher by optimism, desires, and exaltation. Well, investing isn’t based on current earnings. It is based on future earnings.
For a successful growth stock investing strategy is a more important report that suggests the changes in the future outlook. As a growth investor, you would like to see that the market can reset its expectations. If there is confirmation of such changes you’ll know that the price will drop, sometimes very quick and sharp. That’s the moment when you are going to buy the stock because the price is low. Oh, yes! The reward will come later.
Using indicators
Just use technical analysis. You have literally thousands of techniques to analyze the market by using technical analysis. The most important is the trend, support, and resistance levels. If these levels are not clear enough, check the trading volume. It is maybe the best indicator of the direction of a stock price.
When the volume is rising along with the increasing prices it represents the expanding demand and a high possibility the trend will remain to rise. The big secret of growth investing in comparison to the value investing is that growth will win each time.
Other indicators for growth stock investing are stochastic and MACD. MACD measures the momentum of a stock’s move by the convergence and divergence of two moving averages. Stochastics believe that daily price movement is random inside a general trend.
A drop in stock prices inside the uptrend that is supported by bullish signals in MACD and stochastic is one of the most powerful technical entry signals.
Is growth investing strategy hard?
It may seem difficult to create a growth stock investing strategy but it is quite simple. The goal is to discover and invest in growth stocks. Buying them is easy but selling can be the trickier part. Until you sell the stock you’ll not earn money. That’s a simple rule. At least it should be simple unless your emotions are involved. It can be hard to sell the stock that makes a profit. Don’t be greedy. Do it in the peaks. Never think you can do more because in most cases you never do.
Take profit when you can. Set the take profit point and stop-loss point.
At the end of the day, all that matters is profit.
Be patient with your growth stock Investing strategy. It is key. Never hunt the higher prices, you can lose money. When you enter a position, wait for prices to go higher. When you notice a selling opportunity, always take the possibility to profit.


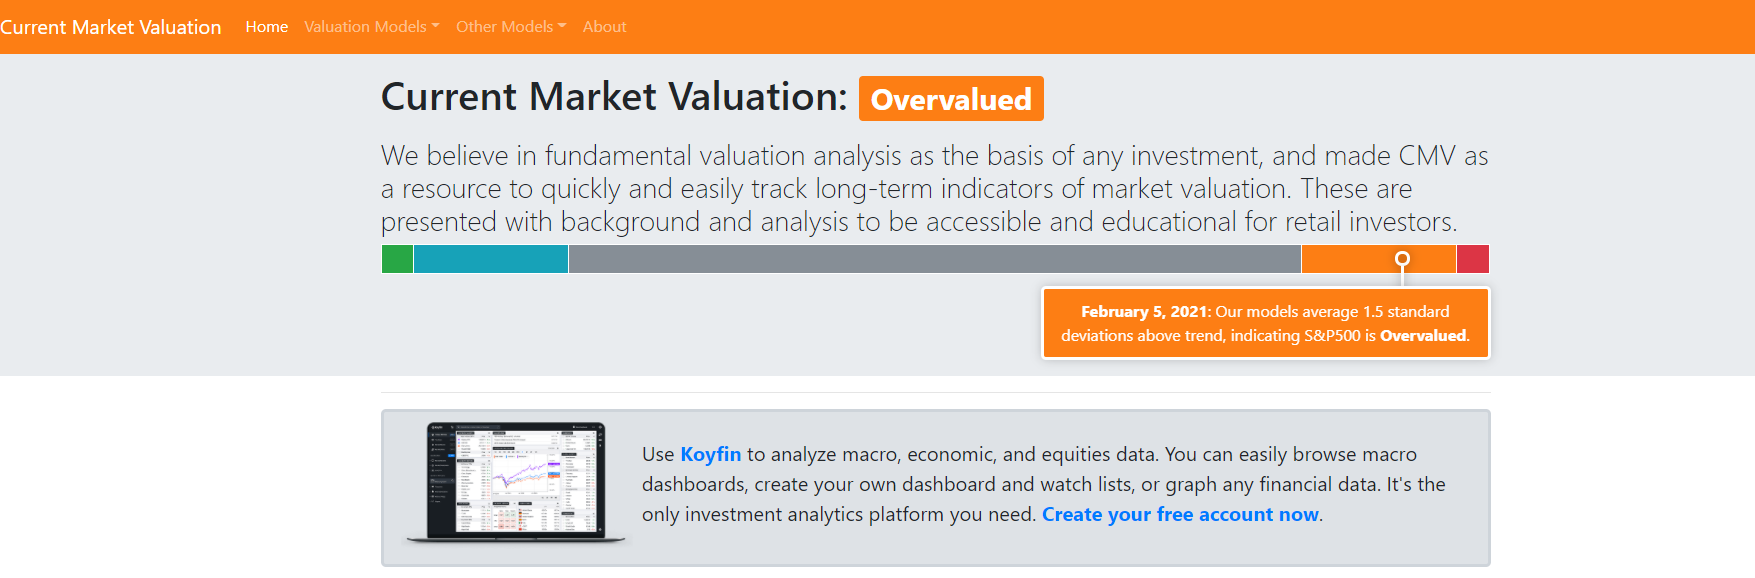 (Image from currentmarketvaluation.com)
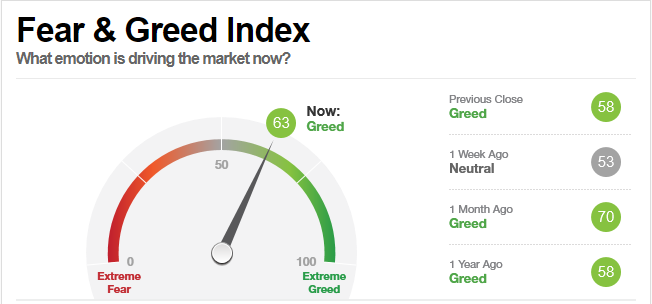
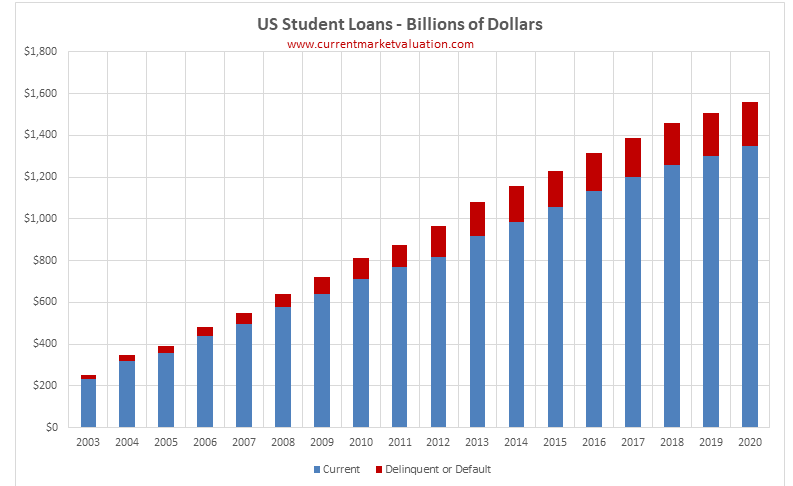 (Image from currentmarketvaluation.com)