By Gorica Gligorijevic
Most of the scams were interrupted thanks to the enforcement of rules by bodies such as the FCA. But today we are faced with the more advanced scammers.
Of course, not every forex signal is the scam.
There are still very reliable services but it can take time to recognize them. First of all, there are so many speeches about scams all around the forex. Don’t believe every word you hear. Just because someone offers poor quality, doesn’t necessarily make it a scam with the intention of cheating you. Think about the intent of the sellers. If all they want is your money without making an effort to deliver, it’s a scam.
The opportunity of scamming still exists for many forex scams.
Scammers tempt new investors with a promise of quick fortunes through “secret trading formulas” or algorithm-based “proprietary” trading methodologies. Before choosing a broker or platform, go through your own search.
Forex signal providers may be an individual or retail firm that promises to trade your account or give you signals to enable you to make a killing out of the market. Some of them will promote their experience and back it up with a few testimonies.
Some promise very high returns and guaranteed profits, either through a managed account where the firm makes trades on the investor’s behalf or by trading using the firm’s trading platform. Most traders will receive some initially returns from the firm to give the impression that their trading has been a success.
Scammers will encourage traders or investors to invest more money. But at this stage or soon after the returns stop, their account is suspended and there’s no further contact with the firm.
Important to know is the fact that many scam firms claim to be FCA authorized.
How can they do it?
Many fake trading and brokerage firms will use the title, ‘firm registration number’ (FRN) and address of regular companies and signal providers who are FCA authorized. This is the so-called ‘clone firm’. The fake providers will give you their phone number, address and website details. Sometimes they will claim that a brokerage’s contact info on the Register is out of date. Or scammers might claim to be abroad firm, and that’s the reason they don’t have updated contact and website.
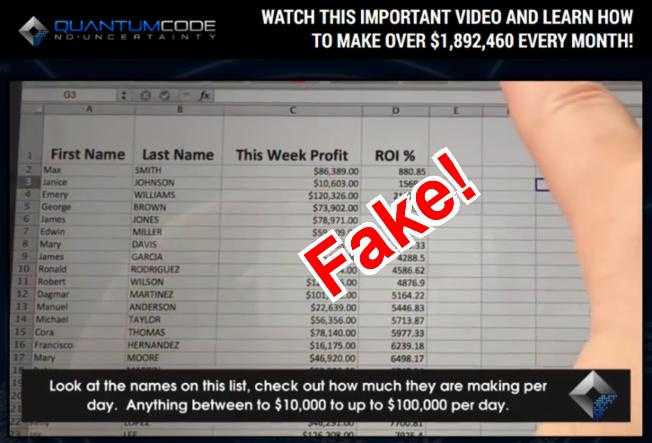
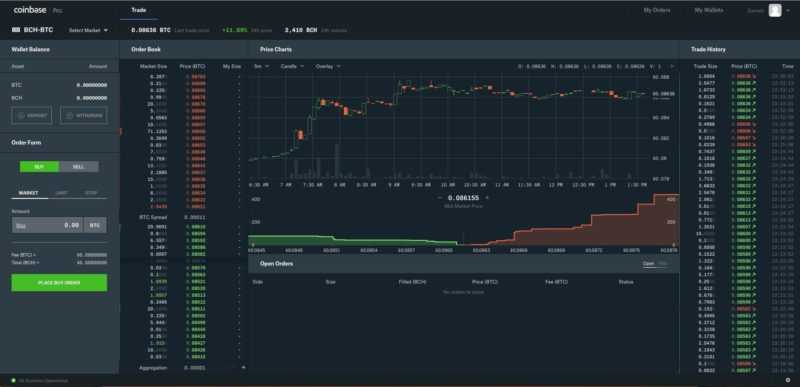
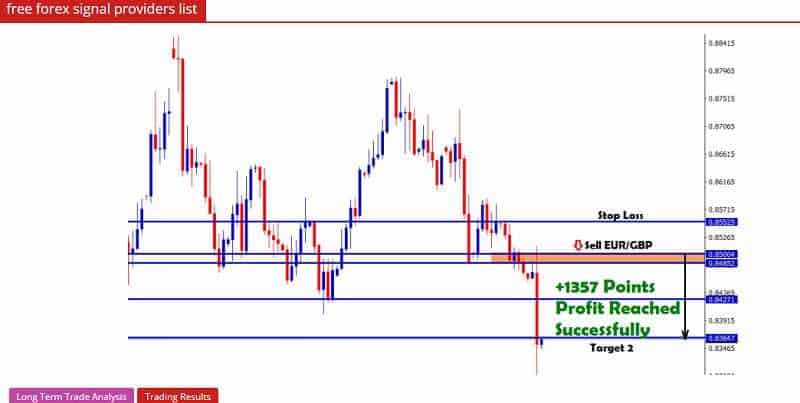
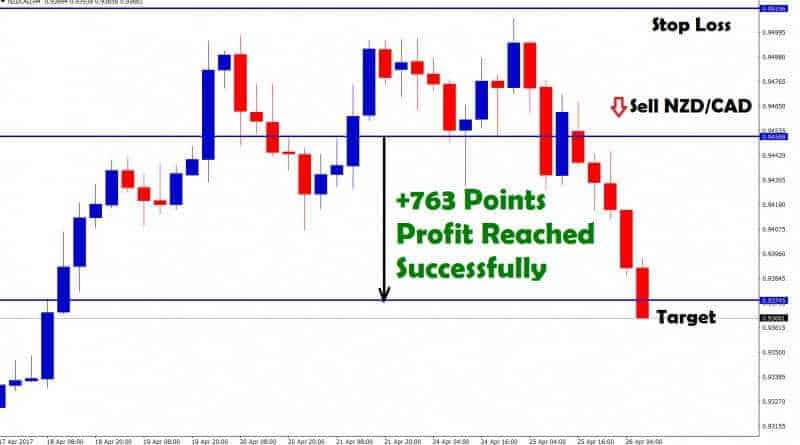
An example of scam trading signals
Some scammers may copy the website of an approved company, and change, for example only the phone number.
When you want to pick your signal provider you have to check several things.
Trustworthy Forex signal service should be verified in websites like the Forex Peace Army. Further, you shouldn’t pay more than a few hundred dollars for a good signal system.
Be especially careful of system sellers who offer programs at excessive prices and claim they can guarantee remarkable results. Choose one of the many legitimate sellers who are decent and whose systems have been properly tested to potentially earn a substantial income.
Another problem is the mixed funds.
Without a record of separated accounts, the trader cannot follow the precise executions of their investments. If you don’t check this issue, you are opening the door to scams. Scammers can use a trader or investor’s money to buy houses, cars, and planes or just vanish with your money. They can offer an investor the false opportunity to have his forex trades managed by highly-skilled forex traders who can offer outstanding market returns in return for a share of the profits.
The catch is, this “management” offer requires the investor to give up control over his money and hand it to someone he knows little about other than the hyped-up and often the completely false record of success available on the scammer’s website and booklet. And the trader or investor often ends up without money, while the scammer uses investors’ funds to buy yachts.
Still, the forex market is not entirely unregulated.
Some forex brokers do not deal fairly with their customers and defraud them.
How does it work?
They start as an unregulated broker. And they publish the offer of large incentives to recruit affiliates who then bring the clients. Once the broker has a few million dollars in funds, empty the accounts, transfer the money to an anonymous tax haven and shut the doors.
Hard to believe?
If some signal seller claims that everything he or she touches turns into gold, don’t trust.
Trust me, I am rich! C’mon!
Their model is a fairytale of sales tactics where clients are suckered into a free seminar, then persuaded to buy several thousand dollars courses, then upsold again to a more expensive course. The tactics are so good the clients don’t even know they’re being cheated. The education they provide is nothing you can’t find for free elsewhere on the internet. Pay them to teach you, start trading, and allow them to buy a Lamborghini. Huh!
Million Dollar Pips was one of the most popular strategies ever sold, but the developer never traded it on a real account.
How does it work?
Develop a simple automated strategy that trades a lot with a high percentage win rate. Run it on a dozen accounts using a variety of settings. After several months, pick the best track record and publish to Myfxbook or some other traders community site.
Develop a sales page detailing how “sophisticated” and “professional” the strategy is. Buy an email list, contact affiliates offering a 50% commission on all sales, then launch!
A few years ago it wasn’t uncommon for someone to sell thousands of copies of such strategy.
This kind of scams will fail, there is no doubt. Like any other did.
Where the warning signs can be found?
If brokers won’t allow the withdrawal of monies from investor or trader accounts. Or, if it is impossible to withdraw money.
Also, if enter or exit a trade during an economic announcement is not in line with expectations. And, if the trading station doesn’t operate to your liquidity expectations.
The best way to determine if a signal seller can benefit you is to open paper money or practice trading account with one of the better-known forex brokers.
Be patient, and eventually, you’ll determine whether predictive signaling works for you or doesn’t.
The list of the biggest scammers you can FIND HERE on Traders Paradise’s Wall of Shame
How to avoid signal provider scams
I think everyone should learn at least the basics of how to spot Forex scams.
First, ensure you deal with signal service providers originating from locations you have heard of before.
Second, if they are authentic, their payment method should be one of the common online payment methods such as PayPal or credit card payments.
Listed here are some of the attributes to look into before following a signal service:
The signal should have verified records of myfxbook, FPA, and other credible verification sites.
The rule is, if the results are not verified, just move on do not waste time or money on unverified results.
In most cases, you will not know on what basis their decisions are made on, so this makes the verification part very important. Focus on signals with over 6 months record of profit and with over 100 trades. If whatever is being shown as results are for less than 100 trades that means the statistics are not sufficient to make any judgment.
The result should be sufficient to offer statistical significance to inform your decisions. Again if the results are for less than 6 months, then the strategy could just be lucky and with time it may be proved wrong.
Make sure the signal operates with drawdown levels you are comfortable with.
This will vary from one trader to the other. Some traders have a bigger desire for risk some have low. If for instance, you take a strategy with 30% drawdown, that means $3,000 could be in drawdown with an account of $10,000 and you remain comfortable. So work with a drawdown that does not give you sleepless nights.
Don’t just focus on how much a strategy earns, take a look at its drawdown too.
Get a signal with reasonable performance or subscription fees. When you are paying to a signal service, also check the fee charged is fair. Unless you are doing this to test the strategy, this strategy will only make sense if you have a huge account.
As we said before, any forex signal service should offer a certain trial period or money-back guarantee. They should allow traders to test before buying. If that is not the case, move on and don’t do not waste your money. If they don’t trust their strategy, why should you?