3 min read

- Study your previous trades and recognize the types of trade you were entering.
Regardless of personal experience in trading, conversations and exchange of views with other traders are valuable. In one of such conversations, the topic was the types of trade. After many hours and a lot of coffee, we had one conclusion: There are 3 types of trade.
I need your attention for a minute. Let me explain this.
True is, whatever measure, guide or indicator you are looking for, whatever the time frame, there are only 3 types of trade.
I meet a lot of people thinking they’ve mastered trading. The problem is they didn’t understand the differences between the trades they took.
Sure thing is, it will be easier for you if you know the ultimate goal and what can you expect from the trade you took. And it is possible if you know the type of trade you just implemented. This is very important because your knowledge is what determinate where to place your stop loss and your take profit.
When a professional trader enters a trade, he knows exactly what he’s trading. And my trading friends and me, we can recognize 3 types of trade.
- Reversal trade
- Breakout trade
- Pullback trade
Each of those trades has some special characteristics (I’ll tell you more about each of them). Depending on the market you’re trading, the success of each type of trades may be different. In Forex trading, the 3 types of trade work good.
Some traders are attracted to trade all of those types for a limited number of currency pairs. But others are specialized in only one of those trades. When a professional trader enters some trade, he must know what he is trading.
REVERSAL TRADE as the type of trade
A lot of traders think that implementing Reversal trades is composed of “calling a top” or “calling a bottom”. This isn’t quite true. Actually, the entry price of a reversal trade is often in a previous zone of support or resistance. Reversal trades are among the most popular types of trade because of their ability to be easily spotted. They take place in a ranging market.

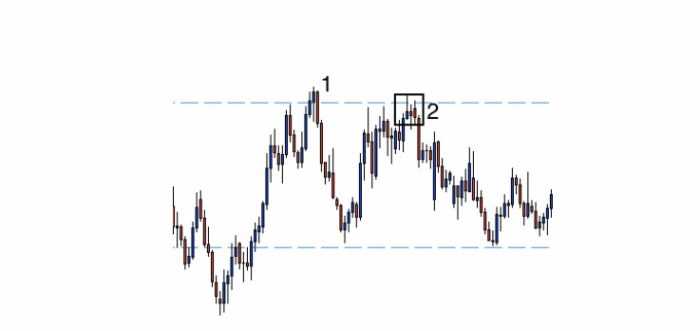
As you can see the buyers were very aggressive on the chart above because they pushed the price up all the way to point 1 from an original support zone.
But, once the price hit a resistance zone (marked as 1), buyers started to take profit. And several traders began to short the currency pair and got more aggressive. They took control of the market. This had for the result to create a strong rapid decrease in price.
At point 2, the same result came, which was a good opportunity to enter a Reversal trade. The sellers placed their orders at that level and the buyers began to take profit because they knew the price had reversed in the past at the same level.
The stop loss would usually be placed above the highest point (A) and the take profit somewhere below the resistance zone. It is tolerable to expect a risk-to-reward of 1:2.
BREAKOUT TRADE as the type of trade
Breakouts trades as one of the types of trade are usually made by a strong continuous movement in a direction. Some traders call it an acceleration because the movement is fast.

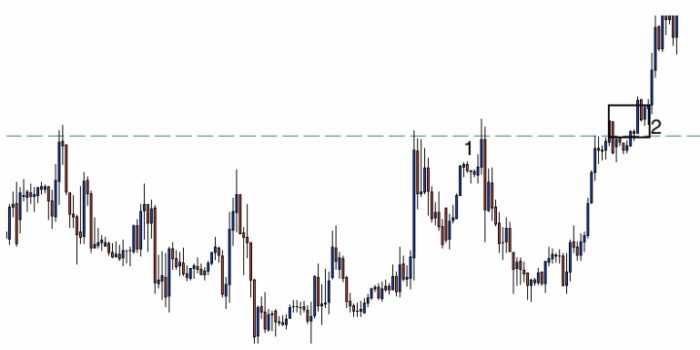
As you can see, the main resistance zone is marked by green.
This is a typical example of Breakout trade.
Take a look, the bulls were confident and kept pushing the price higher and higher to point 1. At that price, the sellers became more aggressive and took control of the market until the buyers showed even more power. The level pointed with a 2 shows a price at which bears are known to get more aggressive in the market. But, they were not aggressive when the price reached that level.
Because there were no traders wanting to sell the currency pair aggressively, more and more traders went long, thus pushing the price higher and breaking through the resistance level.
The stop loss on that trade would usually go slightly below the resistance zone that was broken and the take profit somewhere above the zone. It is tolerable to expect a risk-to-reward of 1:2.
PULLBACK TRADE as one of the types of trade
Pullback trades are usually more solid because the retracement back to a previous price level represents a certain confirmation. ( Retracement is a temporary reversal in the direction of a stock’s price that goes against the prevailing trend. A retracement does not signify a change in the larger trend.)

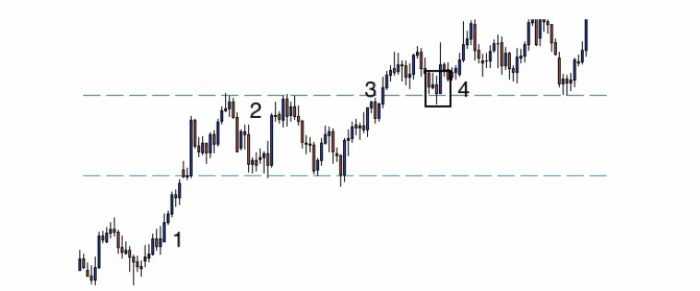
As you can see, a pullback trade is characterized by a retracement, often to the previous support or resistance zone.
Take a look to the chart above, the price kept ranging between a support and resistance zone. At point 2, no one was aggressive enough to move the price significantly higher or lower.
Once the price broke above the resistance zone at point 3, several traders began to feel excited about their profit so far. Most of them thought that this high price might be a good opportunity to take a profit. But, as more and more people took profit on long trades, the price slowly decreased.
When the price got back to the previous resistance zone, some traders began to feel that this price was too low. Those traders then bought the currency pair once again (at point 4) to push the price up.
The stop loss on that trade would usually go slightly below the resistance zone that was broken and the take profit somewhere above the zone. It is tolerable to expect a risk-to-reward of 1:2.
But there are some other styles of trade speaking about styles of trade.
RUNAWAYS
A stock that goes up or down too fast has a greater potential for a short counter-trend. This is caused by investors who take profits. If you bought a stock and make a very good return in a short amount of time, you will likely want to exit the trade to lock in profits.
One type of trade is to play this process, shorting a stock that goes up too quickly or buying a stock that goes down too fast. This trade goes against the longer term momentum of the stock and is only a short-term trade. For savvy traders, it can be a lucrative move.
ANTICIPATIONS
Some chart patterns show a mood but lack a trend. For example, those familiar with charts will know that ascending triangles show optimism and descending triangles pessimism. However, they are consolidation patterns, which means the price, in general, is going sideways over time.
One of the types of trade is to anticipate a breakout by buying stocks in ascending triangles or shorting stocks in descending triangles. Since price volatility is low, the risk of the trade is less and the upside greater if the stock does what we expect of stocks in these patterns, breakout. This is for advanced traders.
How to use all these types of trades?
Look at the top of this post. When a professional trader enters a trade, he knows exactly what he’s trading.
But do you know too?
Study your previous trades and recognize the types of trades you were entering. Then ask yourself this simple question:
”Did I make this as well as I could?”
If you get YES as the answer, you are a very good trader. But if your answer is NO this will help you to make progress.
Risk Disclosure (read carefully!)


Leave a Reply