DEFINITION of Anaume
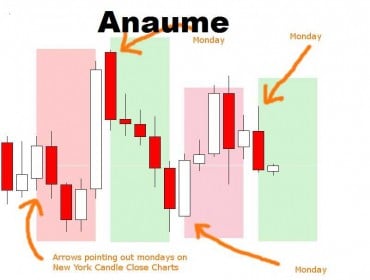
Anaume is candlestick formation in trading charts. Let’s say, an exceptional exhaustion pattern (meaning “gap-filling”) composed of five candles. Japanese discovered this pattern of five candlesticks. One candlestick is equivalent to one trading day.
Hence, there are five trading days in one week on the market. And there are four weeks in the month, the full pattern has twenty candlesticks.
WHAT IT IS IN ESSENCE
Ana-ume literally means to fill up the hole. From this come meaning such as to fill a gap or deficit. Meaning, to make up a loss, to supply a deficiency. Or to cover a deficit or loss.
To add what is the need for something to make it complete. Which means, filling the gap. This is a popular strategy. There you buy a stock when it gaps down in the morning. And then wait for it to fill the gap.
When a stock opens on a significant gap down, there is an imbalance caused by too many sellers. It can, therefore, be a good opportunity to buy the stock and wait for the gap to fill.
The anaume occurs when the gap is filled in after a market price has changed directions.
This pattern coupled with the other patterns indicates a strong potential for a bullish reversal and price advance.
HOW TO USE ANAUME
A candlestick chart (also called Japanese candlestick chart) is a style of financial chart used to describe price movements of a security, derivative, or currency. Each “candlestick” typically shows one day, thus a one-month chart may show the 20 trading days as 20 “candlesticks”
If the stock closes lower than its opening price, a filled candlestick is drawn with the top of the body. Representing the opening price and the bottom of the body representing the closing price. Compared to traditional bar charts, many traders consider candlestick charts more visually appealing and easier to interpret.