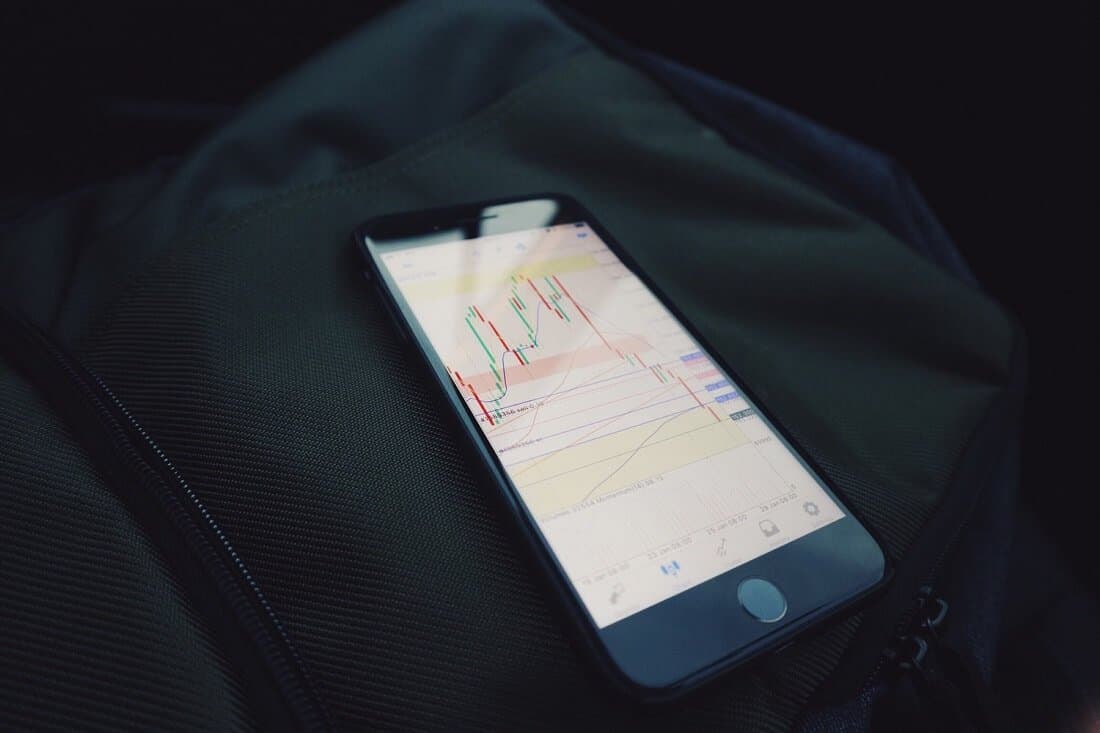
Finding the key support and resistance levels is a crucial component of trading. Moving averages can help.
By Guy Avtalyon
Is it possible to use moving averages as support and resistance? How can they help us in trading? Is there any trick on how to use them? We know from the previous article that moving averages are an average of closing prices during the recent days. How much info we can use in the meaning of moving averages as support and resistance levels?
If you take a look at any chart with moving averages and trend lines that are formed you’ll understand why this is the subject. Moreover, this understanding may have a great impact on your profit.
Moving averages as support and resistance are extremely powerful and we’ll show you why and how.
What are the moving averages as support and resistance?
First of all, these levels are not just like conventional support and resistance. Conventional, traditional levels are visible as horizontal lines in your charts but these provided by moving averages are dynamic. They are changing according to the recent changes in price.
Dynamic support and resistance levels are zones where the market could pull back into and get support requiring to be at horizontal support or resistance levels. Why is it dynamic? Because it measures resistance and support using moving averages that are changing as market changes.
You can find many forex traders that use moving averages as support and resistance levels. For example, it is common among them to sell when the price increases and reaches the moving average and tests it. As a forex trader, you cannot ignore when the price often checks out the moving averages before it bounces back. You must understand that something is happening when the price reaches these levels.
What happens is the market is developing, evolving. So you can’t always buy or sell at previously outlined levels. Also, trends’ momentum is dynamic too due to the order flows. Momentum can often be the primary forcing power of trends or movements.
But to sum what we had here. So-called static support and resistance levels are horizontal and can’t move. On the other hand, dynamic support and resistance levels are moving and they are not horizontal.
What causes support and resistance?
When a price goes up and down, it faces obstacles on the way. If obstacles act in a way to prevent the price to drop lower, we are talking about – support. Hence, when it stops the up progress, it is resistance.
Support is formed when more traders are selling than buying. Sellers will usually cover their short positions and take the profit. The price will go lower and lower. As it happens, buyers will start to buy at that lower price and many of them will enter the new long positions. If the number of buyers is bigger than the sellers, they will create a support level eventually. But if the price moves up that means the more traders are buying and if the number of sellers is bigger than the number of buyers it is so-called resistance.
How moving averages help to find support and resistance levels
The question is how do we estimate the strength of the signal we’re seeing. Is it breakout or bounce? There are moving averages as support and resistance levels on the scene to help us. One of the benefits of using moving averages for this purpose is their ability to be handy even when the market price is going through a hidden area in our charts.
Have you ever had trouble finding key support and resistance levels when looking at the charts? Of course, you had. It is pretty much usual that when looking at charts and notice a price action, you see the price is pulling back but you cannot find support or resistance levels in that zone. But if you try to reveal how the market is valuing dynamic levels, your charts will be more clear. Moreover, you’ll find some trading opportunities you were missing before. That’s kind of an “angle-changer”. You have one perspective more to judge your trade.
One of the best ways to estimate the ability of support or resistance levels is to watch price action around them. It isn’t hard to read price action. For example, on candlestick charts it’s easy.
For example, if you use the 15-minute chart and the price rises to the 50 EMA. That could be a really good dynamic support or resistance level. You’ll notice that every time the price touches 50 EMA and tests it, you’ll see a bounce back down because the price uses this moving average as resistance. Try it, it’s simply amazing. But the price will not always perfectly bounce back from the moving average. Sometimes it will go a bit above before it starts going back in trend direction.
Sometimes the price will simply explode through it all together. Some forex traders usually leap on two moving averages and buy or sell when the price is in the middle of the zone between the two moving averages.
Does this really work?
The logic behind why moving averages as support and resistance work are very similar to why price moves. Let’s say that the majority of traders use 10-days, 20-days. 50-days, 100-days or 200-days moving averages. So, what do you think, what can happen when almost 90% of them use all these five? Nothin special. But if they choose to use only one of them in expectation for it to operate as support or resistance? Yes, you’re right. The price will respect that. When more traders expect something to happen and they have a common goal, it will happen.
Let’s examine this in the case of 10 and 20 EMAs that are providing support and resistance. What can you see?
Can you see how the 10 and 20 EMAs are providing support and resistance? These moving averages can be a powerful help but only if used with the right assembly factors. Let’s look at a setup where they unite several other factors.
Can you see how the pin bar marked in the red circle rejected the 10 EMA and a key price action level both? We have a clear uptrend without resistance beyond this key level. This was an example of a great setup. Feel free to test it.
The price will rarely bounce exactly, again, and again from the same moving average. Instead, it’s more efficient to form a support or resistance zone between two moving averages.
When the price moves into the zone between the 20 MA and 50 MA, we should ask if a reversal is going to happen. That could be a danger zone, so it may be smart to hedge the position.
How to use moving averages to lock in profit
If you want to lock in profit, move up your stop level in your trend-following trade only if you have a clear signal of bounce from moving averages you use as support or resistance. That is one of the tricks for using moving averages as support and resistance. But you have to keep in mind that moving averages as support and resistance levels are just saying to us what’s going on at these levels. We still have to look out for additional signals and find them.
The truth is that if you add MAs you’ll have additional in-trade information that may help you to maximize your trades. But like everything in Forex, you’ll have no guarantees. Consider these averages as a tool in your trading toolkit that you can adopt and use to increase your trading success.


Leave a Reply