A golden cross is a bullish signal
2 min read

The last, 2018 was a bear market for Bitcoin and crypto-assets. But this year is a bull market or we can say it is the opening stages of it. Why we are saying that?
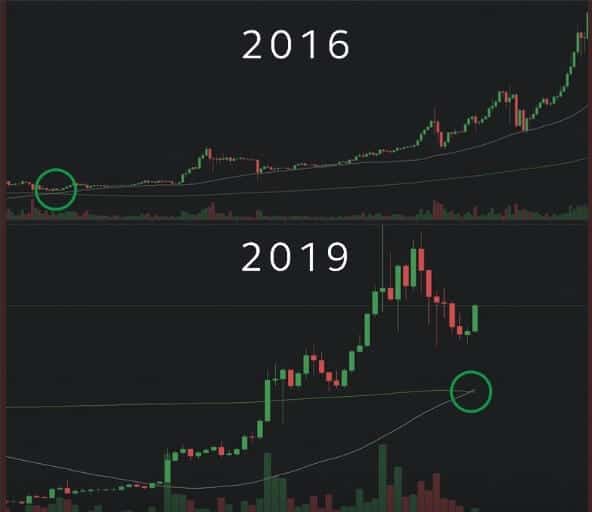
On the three-day chart, we can see a “golden cross”.
A golden cross is an exactly a bullish signal. Typically it is a sign that the asset is going to start a bull run. And you can see that on the three-day chart, it is very obvious, without any dilemma.
The golden cross is a bullish breakout pattern. It is a positive momentum indicator, happening when a security’s short-term price moving average moves above its long-term moving average.
Bitcoin price has triggered a “golden cross” on the three-day price chart. That causes great enthusiasm among its supporters.
The golden cross is a powerful sign that Bitcoin is surely entering a bull run. This conclusion is based on past experiences, of course. So, we can understand why investors are so excited.
The death cross is the opposite. It is the point where the short-term price moving average moves below the long-term moving average. No matter if we are talking about golden cross or death cross, the short-term moving average is regularly a 50-day moving average. The long-term moving average is a 200-day moving average.
The similar situation we had in February 2016. At that time, Bitcoin produced a 4,900% return to investors.
Will the same happen once again? If the golden cross stands, Bitcoin could go on to produce investors enormous returns. The majority of asset class will never bring such return.
A golden cross is a powerful indicator that an asset’s price is going to grow. Opposite, a death cross is an indication that an asset will decline in price.
ROI (Return on Investment) of Bitcoin was 7,870.79% on the date of 3/8/2019. At the same date, the market cap was $192,025,701,130. The 24h value was $17,827,812,399.
Before the previous golden cross in February 2016, the Bitcoin was priced at just about $400 per BTC. But after the golden cross was formed Bitcoin brought 4,900% in returns as it hit $20,000.
When the golden cross appears, the asset will need approximately a year and a half for that, so it might happen in December 2020. Yes, it will take some time for BTC to achieve highs above $500,000 with rising in percentage as this one is.
Mike Novogratz states that even ordinary investors have to invest 2-3 percent of portfolios into crypto. But, he cautions that they should get “real nervous” if they see the bitcoin price drops below a key level.
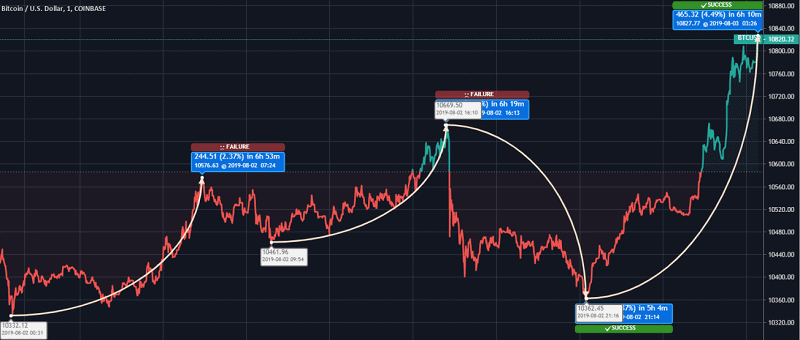
This investor had foretold that bitcoin would consolidate in a range set by $10,000-lows and $14,000-highs.
The bottom line
You might think that the market cap of BTC must be very massive to reach this price. Also, it is pretty impossible to see that huge return again soon. But Bitcoin knows how to surprise us. So, everything is possible.
The moving average on the three-day BTC/USD chart is on a constant upward trajectory. This trend may stay in the future.
Seasoned traders call this long-term bull market signal a lagging trend indicator. The moving average studies are based on historical analysis. But, we have a low capacity to predict how this asset will behave in the future since the golden cross was seen only once. All we know is that this indicator is a very powerful indicator of bulls trends.
If history repeats, this sign will confirm that soon we will see a true record rally. The one that will go far over the previous maximum.